Information Geometry in Finance, Markets & Trading


Information geometry applies the concepts and methods of differential geometry to problems in probability theory and statistics, which are important in finance.
It explores the geometric structure of statistical models and studies how these structures influence inference and decision-making processes.
The key concept in information geometry is the notion of a statistical manifold, which is a geometric space where each point represents a probability distribution.
Key Takeaways – Information Geometry in Finance, Markets & Trading
- Information geometry provides a mathematical framework to visualize and analyze complex financial data in multi-dimensional space.
- Enables a deeper understanding of the nuanced, nonlinear relationships and patterns within financial markets for better decision-making.
- Helps traders analyze financial data in the context of statistical manifolds.
- By leveraging the curvature and topology of data space, information geometry can help with various forms of analysis (e.g., optimization).
In the context of finance, information geometry can be applied in several ways:
Portfolio Optimization
One of the most direct applications of information geometry in finance is in portfolio optimization.
The space of potential portfolios can be viewed as a statistical manifold, with each point representing a different combination of assets.
Information geometric methods can then be used to understand the curvature and structure of this space.
This helps in the selection of optimal portfolios that balance risk and return in a more nuanced way than traditional methods.
Risk Management
Information geometry can help in understanding and managing the risks associated with different financial instruments.
By modeling the space of risk factors as a geometric object, one can gain insights into the relationships and dependencies between different risks, which is important for risk management and mitigation strategies.
Option Pricing & Derivatives
In options pricing and derivatives, information geometry can be used to model the uncertainty and dynamics of underlying assets.
The geometric approach can provide new perspectives on the sensitivities of option prices to various factors (like volatility, interest rates, etc.), leading to potentially more robust pricing models.
Algorithmic Trading
Information geometry can be applied to the development of trading algorithms.
By understanding the geometric properties of market data, these algorithms can potentially identify patterns and trends that aren’t immediately apparent through traditional statistical methods.
Economic Indicators & Macroeconomic Modeling
Information geometry can also be applied to model economic indicators and macroeconomic factors, and help in the construction of models that more accurately reflect the dynamics of economic systems.
Statistical Manifolds & Use in Trading
In information geometry, a statistical manifold is a geometric space in which each point represents a probability distribution.
This concept is based on the idea that probability distributions can be parameterized and thus can be considered as points in a geometric space.
The geometry of this space is defined in terms of the Fisher Information Metric, which gives a way to measure distances between probability distributions.
Example of a Statistical Manifold
For example, let’s say we had an example of a 5-asset portfolio where each asset (or return stream) has equal risks and equal returns and all assets are uncorrelated to each other.
This graph shows that if you were to concentrate your risk in just one of the five, you would have a poor return-to-risk ratio – represented by the steepness of the curvature in the space.
However, if you were to diversify better among them, you would land in a flatter part of the space, which represents a better return-to-risk ratio.
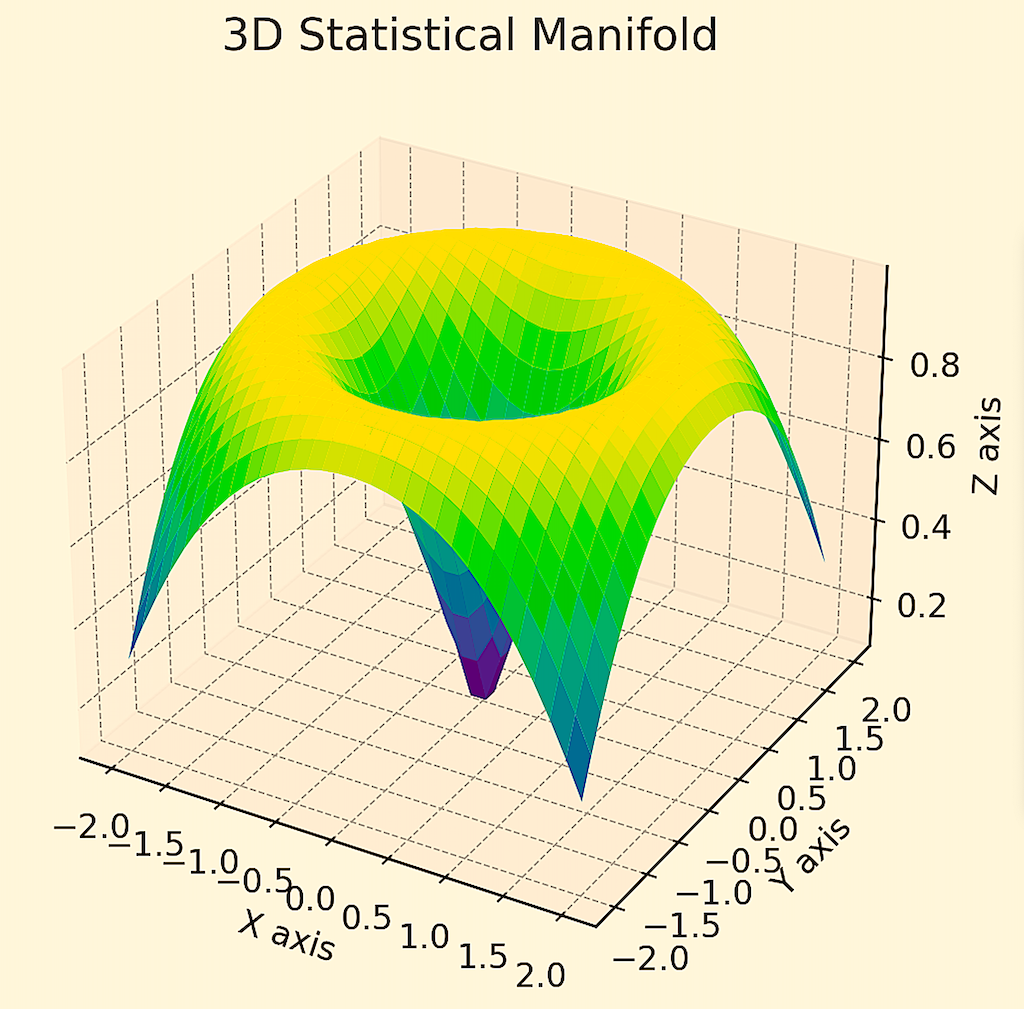
Each point on the graph would show a theoretical probability distribution of a certain combination of assets.
Also, if this was a “probabilities of probabilities” scenario where the probabilities themselves aren’t well-known – as is often the case in markets – we would have higher-order probability structures.
Instead of a curved 2D plane in a 3D space we would have extra layers of dimensionality and then optimize off that structure.
Understanding Statistical Manifold
Parameterization of Probability Distributions
Consider a family of probability distributions parameterized by a set of parameters (like the mean and variance in a normal distribution).
Each set of parameters corresponds to a unique probability distribution, and therefore to a point on the statistical manifold.
Fisher Information Metric
The Fisher Information Metric provides a way to measure the “distance” between different probability distributions (or points) on the manifold.
This metric is defined in terms of the sensitivity of the probability distribution to changes in its parameters.
In simple terms, it measures how much the probability distribution changes as you slightly tweak its parameters.
Geodesics
The shortest path between two points (distributions) on the manifold is called a geodesic.
In the context of statistical manifolds, these geodesics represent the most efficient way to move from one probability distribution to another in terms of information change.
Related Mathematical Fields
Information geometry is intertwined with several other mathematical fields.
Integrating these with information geometry can provide a comprehensive and robust approach to financial modeling and analysis.
Here’s a look at related mathematical fields and additional methods that can be employed:
Differential Geometry
This is the core mathematical foundation of information geometry.
It deals with the properties of curves and surfaces, and extends these concepts to higher dimensions.
Differential geometry provides the tools to define and analyze the curvature and topology of statistical manifolds.
Probability and Statistics
Information geometry applies the concepts of differential geometry to probability theory, heavily in the context of statistical inference and estimation.
Linear Algebra
Linear algebra is useful for understanding the structure of data and models. And useful in high-dimensional spaces.
Eigenvalue decomposition and singular value decomposition are key techniques in linear algebra that find applications in finance.
Calculus of Variations and Optimal Control Theory
These fields provide methods to find optimal paths or strategies, akin to finding geodesic paths in information geometry.
Numerical Analysis
For implementing models and solving equations that arise in information geometry, numerical methods are essential, particularly when dealing with high-dimensional data.
Triangulating with Additional Methods
By combining information geometry with these related mathematical fields and methods, a quant trader can develop a more nuanced, multi-faceted understanding of financial phenomena, which can lead to better decision-making and financial models.
Machine Learning and Data Science
Techniques like neural networks, regression analysis, and clustering can provide empirical insights that complement the theoretical models of information geometry.
These methods are particularly useful for pattern recognition, predictive modeling, and risk classification.
Time Series Analysis
Time series methods can help understand and predict the temporal/time-related dynamics of markets, which can be important for validating the models developed using information geometry.
Econometrics
To understand the economic factors influencing financial markets and to test hypotheses about market behaviors.
Behavioral Finance
This field examines the psychological factors affecting trader-investor behavior.
Integrating insights from behavioral finance can provide a more holistic view, especially in models that might otherwise assume rational behavior.
Risk Management Techniques
Tools like Value at Risk (VaR), Conditional Value at Risk (CVaR), and stress testing are essential in assessing and managing the risks identified through information geometric models.
Stochastic Processes and Random Walk Theory
Stochastic processes are useful in modeling the randomness inherent in financial markets, and their integration can validate or challenge the assumptions in information geometric models.
Optimization Theory
Particularly relevant for portfolio optimization and resource allocation problems in finance, leveraging both linear and nonlinear optimization techniques.
We’ll dedicate the rest of the article to the application of information geometry to portfolio construction.
We’ll use the example of risk parity or balanced beta allocation.
Using Information Geometry for Trading Frameworks (Example: Risk Parity)
Incorporating concepts such as statistical manifolds and information geometry into a risk parity framework (particularly in the context of balancing allocations to avoid environmental biases towards discounted inflation and growth conditions) involves a certain approach.
Here’s how this can be structured.
Modeling the Environment Using Statistical Manifolds
The risk parity strategy differs from traditional portfolio optimization by focusing not just on the expected returns of assets but more critically on the allocation of risk.
Integrating concepts like statistical manifolds and information geometry can enhance the understanding and implementation of risk parity strategies.
Environmental Dimensions
Create a statistical manifold where each dimension represents a key economic variable that’s part of this framework:
- discounted inflation
- discounted growth conditions
- risk premiums, and
- discount rates
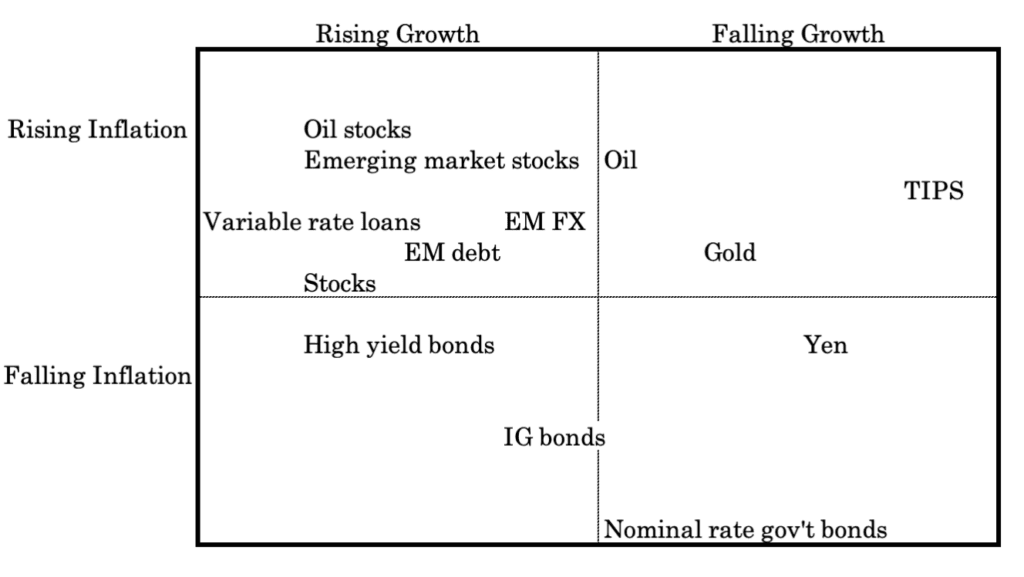
Asset Class Mapping
Position each asset class within this manifold based on its sensitivity and response to these variables.
You can first think of it in terms of a 2D framework:
Risk-Adjusted Distance
Use the principles of information geometry to assess the “distance” between asset classes in a risk-adjusted space.
This helps in understanding the diversification benefits and risk contributions of each asset class under varying economic conditions.
Dynamic Allocation
Regularly update the portfolio allocation based on the changing geometry of the manifold, which reflects shifts in economic conditions and asset class sensitivities.
Risk Dynamics
The manifold’s geometry can illustrate how the risk dynamics of different asset classes change under different market scenarios, such as shifts in inflation or economic growth.
Correlation Structure
The curvature and other geometric properties of the manifold can provide insights into the correlation structure between asset classes.
This is important in risk parity strategies to ensure risks are not concentrated but are spread out across different assets across different dimensions (diversification by asset class, country, and currency).
Practical Implementation in Portfolio Management
Asset Class Selection
Choose asset classes with varying sensitivities to inflation, growth, risk premiums, and discount rates to provide a wide coverage across the manifold.
High curvature areas of a manifold might indicate asset classes that are highly sensitive to changes in economic conditions.
As we showed graphically in a preceding section, steepness in a manifold means the portfolio is highly sensitive to changes in economic and market conditions.
For instance, if you concentrate your portfolio in anything – stocks, bonds, oil, etc. – you’ll have big ups and downs relative to a more diversified mix that more efficiently extracts risk premiums from the market.
Risk Parity Optimization
Adjust the portfolio to ensure that each asset class’s risk contribution is in line with its expected performance under the current economic conditions.
Consider both the absolute risk of each asset and its relative risk premium.
You can go heavier on an asset if you’re compensated relative to its risk and relative to it throwing off balance in a portfolio.
In other words, if an asset class shows a high risk premium that is sufficiently compensated in a risk-adjusted sense, increase its allocation.
Conversely, reduce allocation to asset classes with low risk premiums or high sensitivity to adverse economic conditions.
Continuous Monitoring
Use the manifold structure to continuously monitor how changes in economic conditions affect the risk-return profile of the portfolio.
This would involve tracking the movement of asset classes within the manifold as economic variables evolve.
Scenario Analysis and Stress Testing
Conduct scenario analyses to understand how the portfolio would perform under various economic conditions, such as high inflation or low growth periods.
This method ensures that the portfolio is positioned to capitalize on compensated risks (like high risk premiums) while maintaining a balanced and diversified risk profile.
Information Geometry in Portfolio Construction
Measuring Diversification
Information geometry can help quantify the degree of diversification in a portfolio.
The distance between points (representing different asset combinations) in the manifold can indicate how similar or different they are in terms of risk.
Leverage
In some cases, apply leverage to lower-risk asset classes to equalize their risk contribution with higher-risk asset classes.
For example, government bonds tend to be low-risk and low-return.
But they can be made to be high-risk, high-return assets like stocks when applying leverage of leverage-like techniques (e.g., futures, options, swaps).
This is a type of financial engineering that gets assets or returns streams on an equal risk basis.
Continuous Monitoring and Rebalancing
Regularly monitor the portfolio to ensure risk contributions remain balanced.
Other Forms of Analysis (e.g., Topological Data Analysis)
Algebraic topology, particularly topological data analysis, can be used to identify complex patterns in high-dimensional financial data, such as identifying clusters of assets that behave similarly.