Riemannian Manifolds in Finance, Markets & Trading


Riemannian manifolds are mathematical constructs from the field of differential geometry, which have applications in various disciplines, including finance and quant trading.
We’ll cover both the fundamental concepts of Riemannian manifolds and their practical applications in financial contexts.
Key Takeaways – Riemannian Manifolds in Finance, Markets & Trading
- Geometric Framework
- Riemannian manifolds provide a geometric framework to model non-linear market structures and dynamics.
- Allows traders to analyze and visualize financial markets in a multi-dimensional space.
- Risk and Correlation Analysis
- By representing financial assets or portfolios as points on a manifold, traders can more effectively analyze risk and correlations.
- May lead to better portfolio diversification and risk management strategies.
- Predictive Insights
- Uses the curvature and topology of manifolds helps in identifying trends and anomalies.
- Coding Example
- We provide a coding example of Riemannian manifolds later in the article.
Concepts in Riemannian Geometry & Riemannian Manifolds
A Riemannian manifold is a framework where each point has a space* attached to it, allowing for the measurement of distances and angles in a smooth, continuous way.
This inner product varies smoothly from point to point.
(*A space, in a mathematical context, is a set of elements along with a set of rules or properties defining how these elements relate to each other.)
Metric Tensor
The key component of a Riemannian manifold is the metric tensor, which defines how distances and angles are measured.
Geodesics
These are the “shortest paths” between points on a manifold, akin to straight lines in Euclidean geometry.
In finance, these can represent optimal paths or strategies.
Curvature
This describes how a manifold deviates from being flat.
Curvature can have various interpretations in financial models, depending on what’s being modeled.
Most common modeling forms of risk (e.g., volatility), prices, and other variables that may be non-linear.
Applications in Finance, Markets, and Trading
Portfolio Optimization
Riemannian manifolds can be used to model the space of trading/investment portfolios.
Geodesics on this manifold can represent efficient paths for portfolio rebalancing or transitioning between portfolios (i.e., trading from one asset allocation to another).
Below is an example of a 3D statistical manifold where you’re trying to optimize a portfolio among five different assets with the same risk and return and have correlations of zero among them.
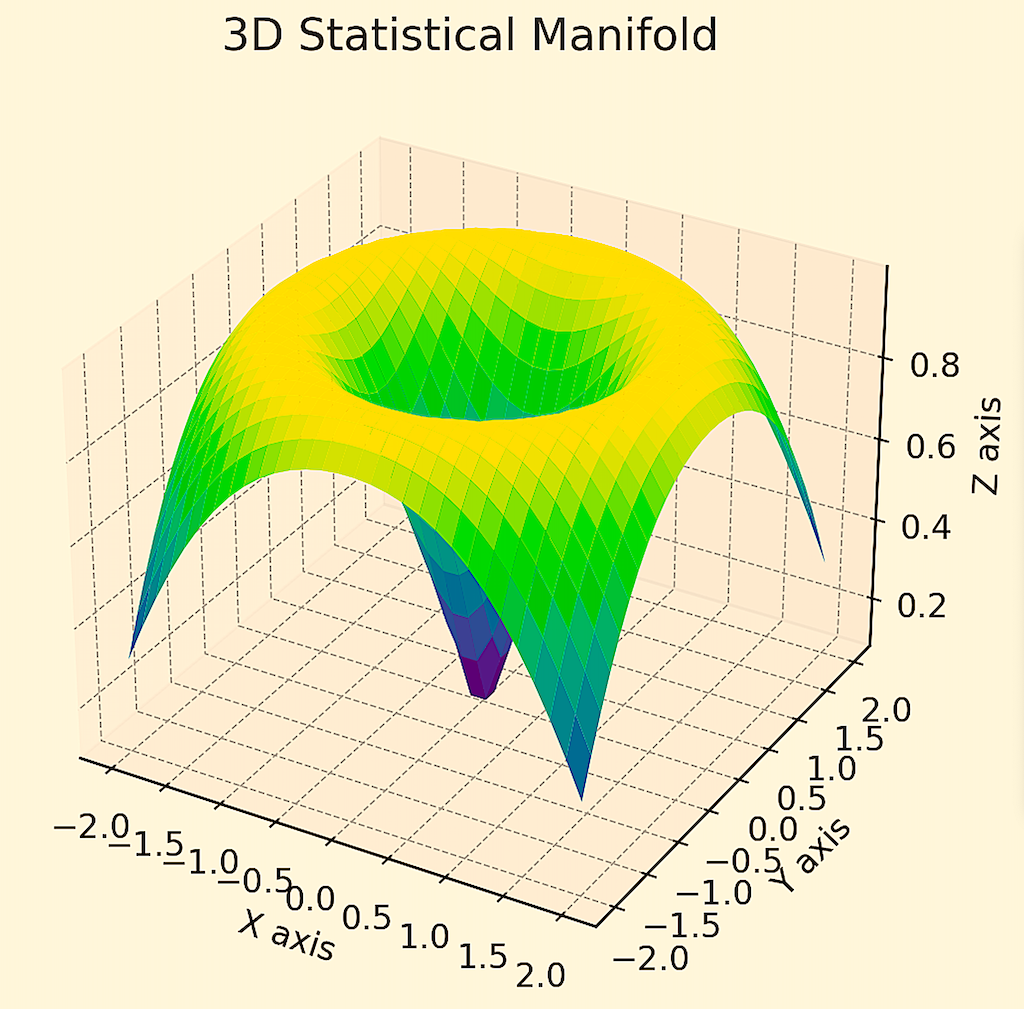
High levels of curvature typically indicate portfolio allocations that are highly sensitive to changes in discounted economic conditions (and consequently represent suboptimal forms of portfolio optimization relative to alternatives).
Portfolios in flatter parts of the manifold indicate more balanced portfolios that are less sensitive to such changes.
Types of portfolios that are more likely to be treated favorably by differential geometric interpretations tend to be those that are well-diversified, such that they do well across a range of growth, inflation, interest rate, and other environments that cause changes to portfolios.
We have a few articles below that look into how to do this:
Risk Management
The curvature of the manifold can be related to risk in financial markets.
Areas of high curvature might represent higher market volatility or instability.
Option Pricing Models
In certain advanced models, the space of possible underlying asset prices over time can be represented as a Riemannian manifold.
This can allow for a more nuanced or precise understanding of option pricing.
Market Dynamics
Manifolds can model the complex structure of financial markets, where the traditional Euclidean geometry doesn’t suffice.
This can lead to better understanding of market behavior and asset price movements.
Many financial models assume linearities in pricing or are oversimplified.
Algorithmic Trading
In algorithmic trading, Riemannian manifolds can be utilized to optimize trade execution paths in high-dimensional and complex market environments.
Interest Rate Models
Modeling the term structure of interest rates can also be approached using Riemannian geometry, to capture the complexities of yield curve movements.
Riemannian Manifolds & Machine Learning
Riemannian manifolds in machine learning enable the modeling of complex, non-linear data structures in a geometric space.
This approach facilitates the understanding and analysis of high-dimensional data by providing a framework to capture intrinsic geometric properties.
It enhances algorithms for tasks like clustering and dimensionality reduction. This improves their performance on datasets with underlying non-Euclidean structures.
By leveraging the curvature and topology of these manifolds, machine learning models can more accurately represent real-world data.
This can lead to improved learning accuracy and predictive power in applications ranging from computer vision, natural language processing, and the various types of mathematical, statistical, and probabilistic frameworks used in finance and quant trading.
Mathematics Behind Riemannian Manifolds
Here are some basic mathematical equations related to Riemannian manifolds and potential applications in finance:
Metric Tensor
The metric tensor, g_{ij}, defines the inner product on the tangent space at each point on the manifold.
This means that at each point on the manifold, g_{ij} provides an inner product that allows you to measure distances and angles in the tangent space at that point.
So it defines a local notion of geometry on the manifold.
In finance, this could involve defining a risk metric on a portfolio space (i.e., a certain allocation of assets).
Riemann Curvature Tensor
The Riemann curvature tensor, R_{ijkl}, describes how the metric varies from point to point on the manifold.
It measures non-flatness.
In financial contexts, curvature could represent how risk changes from one portfolio to another.
Ricci Curvature
The Ricci curvature, Ric_{ij}, is a trace of the Riemann tensor and measures the degree to which the volume of a geodesic ball deviates from that of a ball in Euclidean space.
In finance, Ricci curvature could indicate how much portfolio risk concentrates as you move in portfolio space.
Scalar Curvature
The scalar curvature, R, is the trace of the Ricci tensor and gives a measure of total curvature at a point.
In quant trading, higher scalar curvature could indicate greater overall risk concentration for a given portfolio.
Laplace-Beltrami Operator
The Laplace-Beltrami operator, Δ, acts on functions on the manifold.
In finance, the LB operator could represent a risk-sensitivity differential operator that prices assets consistently with changes in risk.
Summary
To summarize, key geometric concepts like the metric, connection, curvature, and differential operators on a manifold could be employed in measuring financial risk across a portfolio space in various ways.
The equations relate risk at different points and with different directions in the portfolio space.
Challenges & Considerations
Complexity
The application of Riemannian manifolds in finance is mathematically complex and requires deep understanding of both differential geometry and financial theory.
Data and Computation
Implementing these models requires strong data infrastructure and significant computational resources.
Interpretation
The abstract nature of these models requires careful interpretation to apply conclusions meaningfully in real-world financial contexts.
While Riemannian manifolds are not mainstream in everyday financial practice, they offer a framework for modeling and understanding complex financial phenomena that go beyond the capabilities of traditional linear models.
Their use is more prominent in theoretical and advanced quantitative finance, particularly in areas requiring sophisticated mathematical modeling.
Coding Example
Applying Riemannian manifolds directly to a specific financial problem in Python requires an understanding of both differential geometry and the specific financial context.
We can illustrate a basic example that shows how a Riemannian manifold concept might be integrated into a financial analysis scenario, such as portfolio optimization.
Let’s consider a simplified scenario where we want to model the space of trading/investment portfolios as a manifold and compute the geodesic (shortest path) between two portfolios.
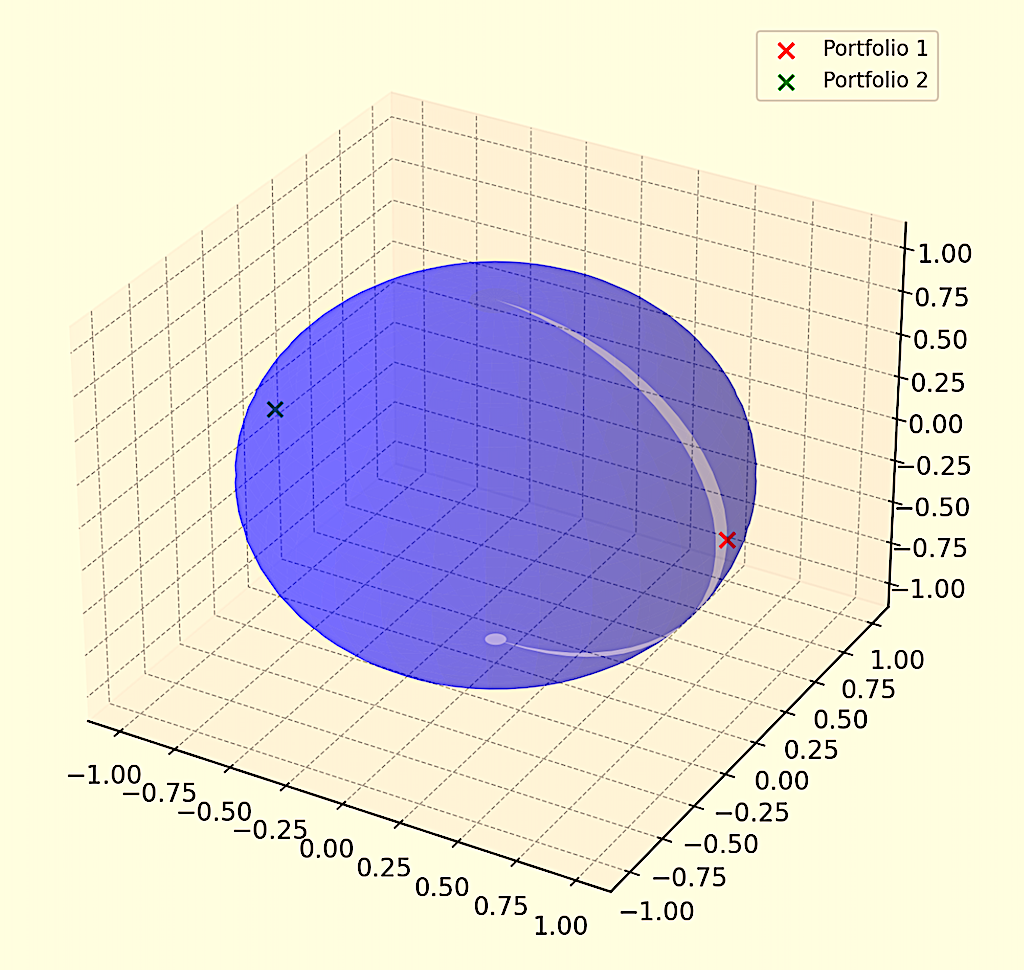
We’ll plot a simplified 3D graph representing a spherical manifold with two points marked on it, symbolizing two different portfolios.
The sphere serves as a conceptual financial space, and the points (portfolios) are positioned on its surface.
In a more advanced and specific financial context, the path connecting these points could represent an optimal transition strategy between the two portfolios.
import matplotlib.pyplot as plt

import numpy as np

from mpl_toolkits.mplot3d import Axes3D


# Function to create a sphere (representing the manifold)

def create_sphere(radius=1, step=0.1):

    u = np.arange(0, 2 * np.pi, step)

    v = np.arange(0, np.pi, step)

    x = radius * np.outer(np.cos(u), np.sin(v))

    y = radius * np.outer(np.sin(u), np.sin(v))

    z = radius * np.outer(np.ones(np.size(u)), np.cos(v))

    return x, y, z


# Define two portfolios (points on the sphere)

portfolio_1 = np.array([1, 0, 0])  # Point on the surface of the sphere

portfolio_2 = np.array([-1, 0, 0])  # Another point on the surface of the sphere


# Create the sphere

x, y, z = create_sphere()


# Plot the sphere and the portfolios

fig = plt.figure(figsize=(8, 8))

ax = fig.add_subplot(111, projection='3d')

ax.plot_surface(x, y, z, color='b', alpha=0.3)

# Mark the portfolios

ax.scatter(portfolio_1[0], portfolio_1[1], portfolio_1[2], color='red', s=50, label='Portfolio 1')

ax.scatter(portfolio_2[0], portfolio_2[1], portfolio_2[2], color='green', s=50, label='Portfolio 2')

ax.legend()

plt.show()
Riemannian Manifolds vs. Other Types of Manifolds & Applications in Finance
Riemannian manifolds and other types of manifolds each have potential applications in finance.
Understanding the differences between these manifolds is important to appreciating their applicability in various financial contexts.
Riemannian Manifolds
Riemannian manifolds are smooth manifolds equipped with a Riemannian metric, which allows for the definition of length, angles, and volume.
This metric is a positive-definite inner product on the tangent space at each point.
Example applications in finance include:
Portfolio Optimization
The metric tensor can represent the risk structure of different assets, where geodesics represent optimal transitions between portfolios.
Risk Measurement
The curvature of a Riemannian manifold can be interpreted as financial risk, where areas of high curvature indicate higher risk.
Symplectic Manifolds
Defined in the context of Hamiltonian mechanics, symplectic manifolds are even-dimensional and equipped with a symplectic form, a non-degenerate, closed, differential 2-form.
Application
Used in quantitative finance for modeling the dynamics of market systems, where the symplectic structure could represent conservation laws (like conservation of capital) or could model the parameters of a specific type fo problem.
Complex Manifolds
These are manifolds with a complex structure.
Allow the transition from real to complex coordinates.
Application
In areas like derivative pricing, where complex analysis can provide more nuanced solutions.
Lie Groups
Smooth manifolds that are also groups and whose group operations are smooth.
Application
Modeling the evolution of prices and returns in financial markets. They can represent continuous symmetries and dynamics of financial instruments.
Finsler Manifolds
Generalizations of Riemannian manifolds, where the metric is defined on the tangent bundle and isn’t necessarily quadratic.
Application
Potentially useful in risk management and portfolio optimization, and a more general framework than Riemannian manifolds.
Hermitian Manifold
A Hermitian manifold is a space where complex data points are connected through a consistent, complex-valued measurement of angles and lengths.
Application
Can be used to model complex financial instruments or scenarios where both magnitude and phase (like price and momentum in trading) are critical to enhance the analysis of complex derivatives or risk assessment.
Sub-Riemannian Manifold
This is a manifold where the metric is defined only on a subset of all possible tangent directions.
Application
It’s applied in situations where only partial information is available or in high-dimensional datasets with constraints.
Pseudo-Riemannian Manifold
A pseudo-Riemannian manifold generalizes Riemannian manifolds by allowing the metric to have indefinite signature.
Application
This can model scenarios with non-standard risk-return profiles.
Useful in advanced risk modeling and in understanding markets with atypical volatility and stability properties.
Comparison & Financial Applications
Flexibility
Riemannian manifolds (with their well-defined metric properties) are suited for applications where notions of distance and angle are important, such as in risk assessment and portfolio optimization.
Finsler manifolds offer more flexibility but at the cost of increased complexity.
Conservation Principles
Symplectic manifolds are particularly relevant in areas of finance that can be modeled by conservation laws, akin to those in physics, such as in certain dynamic market models.
Complex Analysis
Complex manifolds are valuable in areas where complex analysis provides better solutions, like certain types of derivative pricing models.
Dynamics of Financial Markets
Lie groups are useful in understanding the continuous dynamics of financial instruments, such as modeling the flow of prices and returns over time.
Conclusion
While Riemannian manifolds are useful in finance for modeling scenarios where geometric concepts like distance and curvature are applicable, other types of manifolds also offer unique perspectives suited to different financial applications.
The choice of manifold depends on the specific characteristics of the financial problem and the underlying assumptions about market behavior and instrument dynamics.