Symplectic Geometry in Finance, Markets & Trading (Coding Example)


Symplectic geometry, originating in classical mechanics, is a branch of differential geometry concerned with symplectic manifolds (a way of representing and visualizing non-linear data).
A symplectic manifold is a smooth manifold equipped with a closed, non-degenerate 2-form, known as a symplectic form.
This field has found applications in various areas, including finance, particularly in the context of quantitative and algorithmic trading.
Key Takeaways – Symplectic Geometry in Finance, Markets & Trading
- Enhanced Market Modelling
- Symplectic geometry offers advanced methods to model unique market dynamics.
- Can provide deeper insights into market behavior.
- Risk Management
- Using symplectic structures can improve the understanding and management of portfolio risks, especially in more complex, quant-driven trading strategies.
- Algorithmic Trading Efficiency
- Symplectic integrators aid in developing more accurate and stable algorithms for quantitative and algorithmic trading, and modeling their evolution over time.
Applications in Finance
Quantitative & Algorithmic Trading
Symplectic geometry can find applications in the modeling and analysis of market dynamics.
Algorithms can use symplectic integrators, which are numerical methods that preserve the symplectic structure, and model the time evolution of markets.
Risk Management & Portfolio Optimization
The concepts of Hamiltonian dynamics can be used to help model the evolution of portfolios and financial markets.
Derivative Pricing
Some models of derivative pricing could benefit from the geometric insights provided by symplectic geometry in select cases.
Market Microstructure Analysis & Liquidity
The study of the detailed mechanics of how trading occurs and how it affects asset pricing can be enhanced by symplectic methods.
These tools can be used to understand the flow and impact of orders in a market, as well as liquidity dynamics.
Games or Bets with Discrete Payoffs
In a situation where:
- games or betting come with discrete payoffs and
- considerations of how many bets you take are important…
…symplectic manifolds can show the optimal return/risk.
For instance, further down in the article we use the example of basketball shot selection strategy and how it could be modeled. Shooting very close to the hoop can be very efficient because these shots are easiest to make, but taking more 3-point shots gives you 50% more value per shot made.
So you might have a situation where you have a bimodal distribution (short shots and long shots), where you want to shoot efficiently (not take too many shots or too few shots), and that yields the best return/risk ratio.
That can give you a unique manifold with more than one optimal point.
In finance, this might be analogous to a barbell type of investment/trading approach.
- The manifold would illustrate the interplay between different types of investments or trades (high-risk vs. low-risk) and their impact on the overall portfolio performance (return/risk ratio).
- Just as in the basketball analogy where you have more than one optimal point (efficient short shots and high-value long shots), in the financial symplectic manifold, there can be multiple peaks or valleys representing different optimal mixes of trading/investment strategies.
- This manifold would help visualize how changing one aspect of the portfolio (like adding more high-risk assets) affects the overall risk/return profile, helping traders/investors to find the balance point that aligns with their objectives and risk tolerance.
Limitations and Challenges
Complexity and Abstraction
Symplectic geometry is a mathematically sophisticated and abstract field, which can make its direct application in finance challenging.
Modeling Limitations
Financial markets are influenced by a wide array of factors, including human behavior and regulatory changes, which might not be easily captured by geometric methods.
Symplectic Geometric Structure
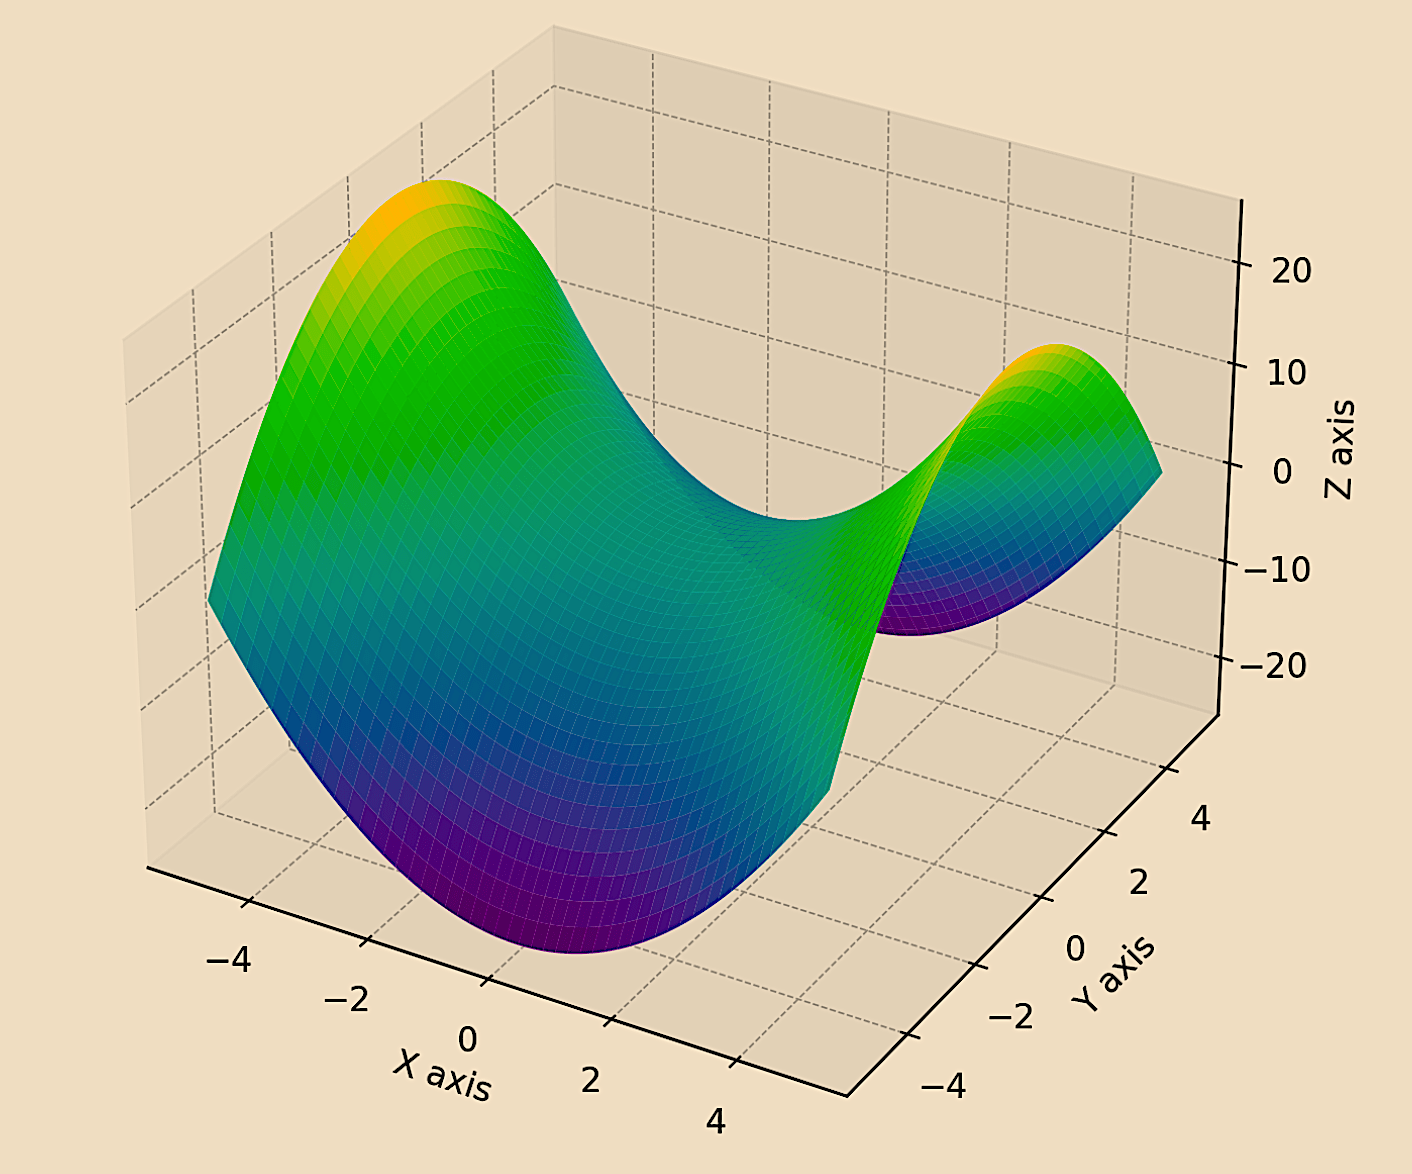
The visualization below represents a simple symplectic manifold.
In this example, a saddle-shaped surface is plotted in three dimensions.
This type of surface is a basic representation and can be seen as a simple model of a symplectic structure.
import matplotlib.pyplot as plt
import numpy as np
from mpl_toolkits.mplot3d import Axes3D

# Symplectic manifold visualization

# Define a grid
x = np.linspace(-5, 5, 100)
y = np.linspace(-5, 5, 100)
x, y = np.meshgrid(x, y)

# Define a symplectic form, e.g., a simple saddle as an example
z = x**2 - y**2

# Plotting
fig = plt.figure(figsize=(10, 8))
ax = fig.add_subplot(111, projection='3d')
ax.plot_surface(x, y, z, cmap='viridis')

# Labels and title
ax.set_xlabel('X axis')
ax.set_ylabel('Y axis')
ax.set_zlabel('Z axis')
ax.set_title('Symplectic Manifold Representation')

plt.show()
The symplectic manifold visualized here, while a simplified representation, can be thought of as a tool for illustrating certain financial concepts when we draw parallels between the manifold’s dimensions and financial variables.
Let’s explore a couple hypothetical examples:
1. Liquidity and Trade Execution
- X-Axis – This could represent the size of a trade or order (e.g., negative value meaning short, positive meaning long).
- Y-Axis – This might symbolize the liquidity of the asset being traded.
- Z-Axis – The surface can then illustrate the impact of trade size and asset liquidity on the execution price or slippage. Larger trades in less liquid assets might show greater slippage, visualized by the curvature of the manifold.
2. Game with Discrete Payoffs
- X-Axis (Relative mix of bets) – This could represent the relative volume of payoffs between two payoffs that are possible. Think of it analogously as the percentage of 2-point shots vs. the number of 3-point shorts by a basketball player with the X-axis being distance from the basket. You get this type of curved polarity because dunks and layups are most efficient, 3-pointers get you 50% more value per shot, and midrange jumpers get you the same value as a dunk or layup but are harder to hit.
- Y-Axis (Momentum) – Volume of bets. If you trade too little or overtrade, your results will be suboptimal. Like in basketball, if you never shoot you can’t score; if you shoot too much you won’t be efficient.
- So the polarity with shot selection (ease of shot vs. value) and balance in how they’re taken leads to the saddle shape.
- Z-Axis (Interplay) – The resulting surface could then illustrate the risk-return trade-off. Taking the appropriate bets in the right volume will yield the best return-risk ratio. Likewise, in basketball, taking dunks and layups when available paired with efficient 3-point shooting (more value) is a mix that could work well.
Conclusion
While symplectic geometry is not mainstream in financial analysis, its applications offer interesting insights, mostly in areas where the dynamics of financial systems are important.
Nevertheless, the effectiveness of these applications depends heavily on the specific context and the ability to translate abstract mathematical concepts into practical financial strategies.