3-Asset & 4-Asset Portfolios


3-asset and 4-asset portfolios can be used to simplify your approach.
We look at various combinations to help you get an idea on how to structure such a portfolio.
We are primarily focusing on risk-adjusted returns.
While many may just want a stocks-heavy portfolio to try to maximize their returns, we take more of an approach in line with balanced beta or risk parity.
Typically, the main argument against diversification is that it can hurt your returns.
But that’s not necessarily true when you can engineer the portfolio to your desired risk and return characteristics. (We explore this at the bottom of the article.)
We’ll use four different assets:
In all of the examples, we use data from 1972 forward. (Past performance is no indication of future performance.)
Key Takeaways – 3-Asset & 4-Asset Portfolios
- Quality diversification can still be done with very simple portfolios.
- We take a look at financial engineering at the end of the article to explain how to better engineer a portfolio to the type of risk and reward characteristics you want.
- Diversification, financial engineering, and hedging (cutting off tail risk) would be the three basic ingredients in portfolio construction – i.e., strategic asset allocation (as opposed to tactical trading).
First Set of Portfolios
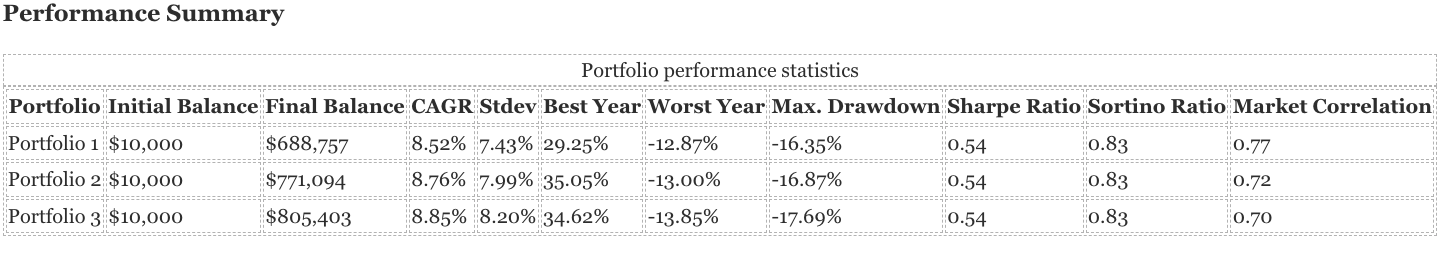
Let’s look at 3 portfolios:
Portfolio 1
- Stocks: 40%
- Bonds: 35%
- Gold: 15%
- Cash: 10%
Portfolio 2
- Stocks: 40%
- Bonds: 35%
- Gold: 20%
- Cash: 5%
Portfolio 3
- Stocks: 40%
- Bonds: 40%
- Gold: 20%
- Cash: 0%

In each case, we had stocks as 40% of the allocation.
Bonds were 35-40%.
Gold was 15-20%.
Cash was 0-10%.
All of these portfolios are generally so similar that the risk-adjusted metrics (Sharpe, Sortino) are all the same.
The least diversified, which was Portfolio 3, did have the largest drawdown (due to a lack of cash).
Second Set of Portfolios
Portfolio 1
- Stocks: 35%
- Bonds: 40%
- Gold: 15%
- Cash: 10%
Portfolio 2
- Stocks: 35%
- Bonds: 40%
- Gold: 20%
- Cash: 5%
Portfolio 3
- Stocks: 35%
- Bonds: 45%
- Gold: 20%
- Cash: 0%
Here we set stocks to 35% of the allocation, and adjust the allocations of the other four assets.
Here we can also see not much difference to the previous set of portfolios.
Because of the slightly higher bonds and lower stocks allocation, the drawdowns are a little lower, as is the CAGR.
The market correlations are lower too, for those looking to have less correlation to the market.
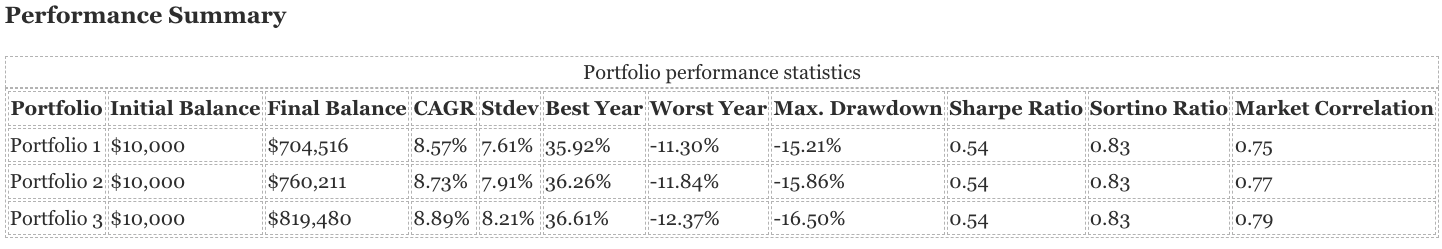
Third Set of Portfolios
Portfolio 1
- Stocks: 30%
- Bonds: 45%
- Gold: 15%
- Cash: 10%
Portfolio 2
- Stocks: 30%
- Bonds: 45%
- Gold: 20%
- Cash: 5%
Portfolio 3
- Stocks: 30%
- Bonds: 50%
- Gold: 20%
- Cash: 0%

Stocks are now 30% of the allocations and we made adjustments to the others.
It’s at this point that we can see the Sharpe and Sortino ratios starting to fall.
This is basically saying that it thinks the portfolio is getting a bit too heavy on the bonds.
It’s also saying that a heavier cash allocation is also viable and that 0-5% might not be enough.
Of course, whether cash is good or bad depends on the environment (are the interest rates on it high enough relative to inflation and relative to other assets).
But this exercise is to get a gist of what the best strategic asset allocation is while keeping our portfolio assets relatively low.
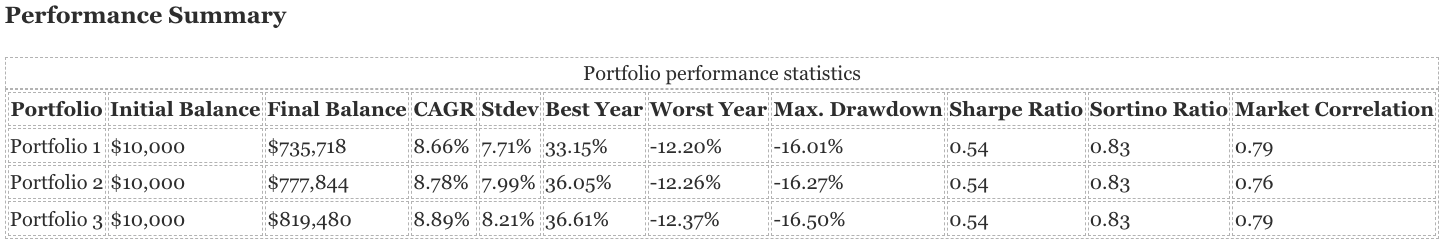
Fourth Set of Portfolios
Portfolio 1
- Stocks: 45%
- Bonds: 30%
- Gold: 15%
- Cash: 10%
Portfolio 2
- Stocks: 45%
- Bonds: 30%
- Gold: 20%
- Cash: 5%
Portfolio 3
- Stocks: 45%
- Bonds: 35%
- Gold: 20%
- Cash: 0%

Stocks were moved up to 45% of the allocation, given that in the last set of portfolio the risk-adjusted metrics started to fade.
With 45%, we can see that the Sharpe ratios are strong, but the Sortino ratios are a bit weaker, especially when heavier on the stocks relative to the bonds.
We noticed that the Sortino ratios tended to get hurt in particular on any allocation under 30% bonds, no matter the mix of the other assets.
Fifth Set of Portfolios
Portfolio 1
- Stocks: 40%
- Bonds: 25%
- Gold: 25%
- Cash: 10%
Portfolio 2
- Stocks: 40%
- Bonds: 30%
- Gold: 20%
- Cash: 10%
Portfolio 3
- Stocks: 40%
- Bonds: 30%
- Gold: 15%
- Cash: 15%

Let’s try 40% stocks again.
In the first one, we test the bonds-gold ratio at 1:1. This produces a little bit of a weaker Sortino ratio, so that’s out.
Now we test the gold-cash ratio in Portolios 2 and 3.
Portfolio 2 does a bit better, with the 40/30/20/10 mix over 40/30/15/15 mix.
So, it likes gold a bit better than cash at 2:1 instead of 1:1.
Sixth Set of Portfolios
Portfolio 1
- Stocks: 42.5%
- Bonds: 27.5%
- Gold: 17.5%
- Cash: 12.5%
Portfolio 2
- Stocks: 42.5%
- Bonds: 30%
- Gold: 17.5%
- Cash: 10%
Portfolio 3
- Stocks: 40%
- Bonds: 30%
- Gold: 20%
- Cash: 10%

We tried boosting the stocks to 42.5% in Portfolios 1 and 2, and compared it to the 40/30/20/10 mix that it liked.
The 40/30/20/10 mix still did best (better Best Year, better Worst Year, better Max Drawdown, highest Sortino Ratio, and lowest Market Correlation).
Let’s try 37.5% stocks in the next batch.
Seventh Set of Portfolios
Portfolio 1
- Stocks: 37.5%
- Bonds: 32.5%
- Gold: 17.5%
- Cash: 12.5%
Portfolio 2
- Stocks: 37.5%
- Bonds: 32.5%
- Gold: 20%
- Cash: 10%
Portfolio 3
- Stocks: 40%
- Bonds: 30%
- Gold: 20%
- Cash: 10%
They’re all virtually the same.
It’s like splitting hairs.
Eighth Set of Portfolios
Portfolio 1
- Stocks: 35%
- Bonds: 32.5%
- Gold: 20%
- Cash: 12.5%
Portfolio 2
- Stocks: 37.5%
- Bonds: 30%
- Gold: 22.5%
- Cash: 10%
Portfolio 3
- Stocks: 40%
- Bonds: 30%
- Gold: 20%
- Cash: 10%

Once we go a little too heavy on the gold (above 20%), its risk-adjusted metrics start to fall.
Ninth Set of Portfolios
Portfolio 1
- Stocks: 35%
- Bonds: 30%
- Gold: 20%
- Cash: 15%
Portfolio 2
- Stocks: 37.5%
- Bonds: 30%
- Gold: 20%
- Cash: 12.5%
Portfolio 3
- Stocks: 40%
- Bonds: 30%
- Gold: 20%
- Cash: 10%
Here we hold the gold and bonds amount the same and adjust the stocks and cash.
They’re all about the same.
More cash-heavy portfolios lower the drawdown amount and volatility, but lower the returns.
But in terms of risk-adjusted returns, they’re about the same.
Tenth Set of Portfolios
Portfolio 1
- Stocks: 30%
- Bonds: 30%
- Gold: 20%
- Cash: 20%
Portfolio 2
- Stocks: 40%
- Bonds: 35%
- Gold: 20%
- Cash: 5%
Portfolio 3
- Stocks: 40%
- Bonds: 30%
- Gold: 20%
- Cash: 10%
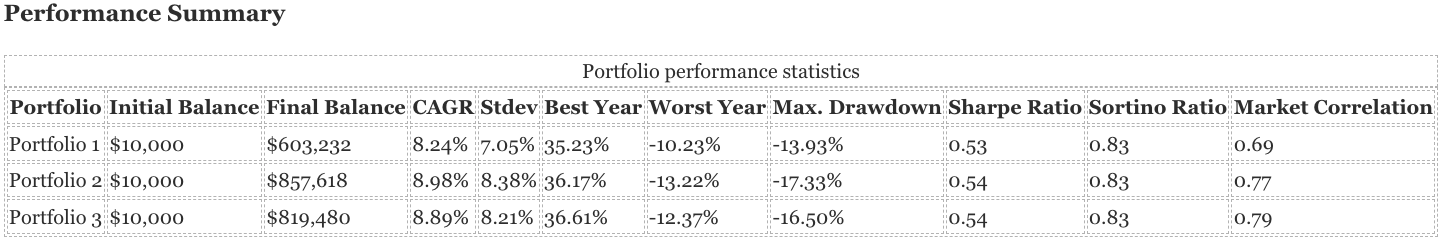
Moral of the story here – don’t have cash too high (which is 20% in this case).
Eleventh Set of Portfolios
Portfolio 1
- Stocks: 35%
- Bonds: 40%
- Gold: 15%
- Cash: 10%
Portfolio 2
- Stocks: 35%
- Bonds: 30%
- Gold: 20%
- Cash: 15%
Portfolio 3
- Stocks: 40%
- Bonds: 30%
- Gold: 20%
- Cash: 10%

So, we’re at the point of diminishing returns.
Certain allocations score the same in terms of risk-adjusted returns.
So, one’s preference would then be framed in terms of factors like:
- Volatility
- CAGR
- Drawdown consideration
- Market correlation
We can also look at some deeper metrics:
| Metric | Portfolio 1 | Portfolio 2 | Portfolio 3 |
| Arithmetic Mean (monthly) | 0.71% | 0.71% | 0.74% |
| Arithmetic Mean (annualized) | 8.82% | 8.88% | 9.25% |
| Geometric Mean (monthly) | 0.68% | 0.69% | 0.71% |
| Geometric Mean (annualized) | 8.52% | 8.57% | 8.89% |
| Standard Deviation (monthly) | 2.15% | 2.20% | 2.37% |
| Standard Deviation (annualized) | 7.43% | 7.61% | 8.21% |
| Downside Deviation (monthly) | 1.18% | 1.21% | 1.34% |
| Maximum Drawdown | -16.35% | -15.21% | -16.50% |
| Stock Market Correlation | 0.77 | 0.75 | 0.79 |
| Beta(*) | 0.36 | 0.36 | 0.41 |
| Alpha (annualized) | 4.45% | 4.53% | 4.33% |
| R2 | 58.96% | 55.53% | 61.67% |
| Sharpe Ratio | 0.54 | 0.54 | 0.54 |
| Sortino Ratio | 0.83 | 0.83 | 0.83 |
| Treynor Ratio (%) | 11.14 | 11.36 | 10.83 |
| Calmar Ratio | 0.02 | 0.08 | 0.10 |
| Active Return | -1.80% | -1.75% | -1.43% |
| Tracking Error | 11.11% | 11.27% | 10.59% |
| Information Ratio | -0.16 | -0.16 | -0.14 |
| Skewness | -0.09 | -0.07 | -0.15 |
| Excess Kurtosis | 1.33 | 1.72 | 1.71 |
| Historical Value-at-Risk (5%) | 2.79% | 2.64% | 2.96% |
| Analytical Value-at-Risk (5%) | 2.82% | 2.90% | 3.16% |
| Conditional Value-at-Risk (5%) | 3.92% | 3.99% | 4.37% |
| Upside Capture Ratio (%) | 44.18 | 44.13 | 48.62 |
| Downside Capture Ratio (%) | 27.69 | 27.32 | 32.93 |
| Safe Withdrawal Rate | 4.92% | 5.25% | 5.39% |
| Perpetual Withdrawal Rate | 4.26% | 4.30% | 4.58% |
| Positive Periods | 399 out of 621 (64.25%) | 400 out of 621 (64.41%) | 400 out of 621 (64.41%) |
| Gain/Loss Ratio | 1.30 | 1.28 | 1.24 |
“Optimal” Allocations
From this, we can say that the idea allocations are somewhere around:
- 35-40% Stocks
- 30-40% Bonds
- 15-20% Gold
- 5-15% Cash
And this is based on backtesting.
So, also think about whether the allocation is logical.
In terms of bonds, how much do you want split between nominal and inflation-linked bonds.
How much in terms of gold or other commodities?
How much cash do you prefer?
Financial Engineering Considerations
In portfolio management, financial engineering pertains to the design and adaptation of portfolios to achieve specific risk and return objectives.
By employing a combination of instruments, derivatives, and strategies, a portfolio can be engineered or re-balanced to match its desired risk-return profile, ensuring that investments align with an investor’s goals and risk tolerance.
For example, stocks can be owned through futures. Some bonds can be owned through futures contracts. As can gold.
With futures, you put up a small amount of collateral relative to the amount of exposure you have.
However, this has to be managed carefully.
Let’s look at the following portfolios engineered 2:1:

We can see from this that with our simple balanced portfolio, we would have gotten stock-like volatility (around 14-16% annualized), but much improved returns.
We discussed in separate articles that drawdowns are the worst thing in trading (a 30% drawdown takes a 43% gain just to get up to a nominal breakeven) and it’s generally a good thing to limit them at a certain level.
This can be done with better diversification or using OTM options to hedge.
These cost money, and will eat into your returns. But defense and risk management is the most important thing.
If you’re using 3:1 leverage:

Your CAGR is very high (based on past data), but your max drawdown is over 40%.
It’s generally a good idea to limit that.
If there’s a takeaway from this section, it’s that diversification combined with prudent financial engineering and hedging (i.e., cutting off tail risk) can be a powerful combination to get a portfolio with the type of risk and reward you’re aiming for.