The Complete Guide to Trading and Investing in Consumer Staples


Consumer staples are among the most stable types of stocks that return fairly consistently.
The volatility of stocks is one of the main reasons why many traders and investors are hesitant to commit to them.
Key Takeaways – Consumer Staples
- Consumer staples reduce risk. They usually don’t beat the market over a full cycle, though they may on a risk-adjusted basis.
- Since 1999, the staples ETF returned 6.6% a year versus 7.8% for the S&P 500, but its worst drawdown was -32.6% against -50.8%. They help smooth the ride, not to win the race.
- If you’re trading tactically, you generally want to tilt toward them late in the cycle, when rates are rising and liquidity is tightening. They lag when money is loose and tech leads.
- The real risk is rising interest rates, not falling demand. They trade like bonds and de-rate when yields climb, as they did from 2016 to 2018.
- Pricing power separates good staples from weak ones. Favor durable brands with roughly 50% gross margins and steady volume growth over companies that only raise prices.
- They can replace bond income to an extent (though they still correlate highly with other equities). Expect 2-4% yields, and check the payout ratio: 50-65% is healthy, 85%+ is fragile.
- Don’t overpay. A high-teens to low-20s P/E is normal. Compare the dividend yield to the 10-year Treasury before buying.
- Watch newer threats: weight-loss drugs affecting demand, private label, and health trends. Favor companies adapting their lineup.
- Most people do better owning an ETF (e.g., XLP, VDC, FSTA) than trying to pick winners.
What are consumer staples and what makes them attractive?
Certain businesses involve selling products people need to physically live. This can make them good stores of value over time.
If a company’s earnings are reliable, they don’t rely on interest rate cuts to help offset a loss in income.
One particular risk factor associated with owning stocks with interest rates so low is that you can’t rely on interest rate cuts to help you in the event of a recession.
When the economy is in its later stages – characterised by low unemployment and rising inflation – it can make sense to adjust your portfolio toward more defensive sectors.
Among equities, consumer staples are typically seen as the most defensive flavor of equities. These are the firms providing everyday essentials – products people continue buying regardless of economic conditions.
While the specific companies in this category may shift over time, the broader sector has a track record of delivering steady earnings through the ups and downs of the cycle.
Investors looking for exposure to this area can consider sector-specific ETFs like XLP from SPDR and VDC from Vanguard, both of which offer diversified access to leading consumer staples stocks.
For those seeking more flexibility or lower upfront capital requirements, futures contracts are also available – IXR on Globex tracks the consumer staples space, while IXU covers utilities, another defensive segment with similar resilience.
Consumer staples and economic cycles
Consumer staples are less affected by economic cycles than other types of investments because they sell “needs” (necessities) rather than “wants” (luxuries).
The products associated with consumer staples – e.g., food, beverages, basic medicine, the everyday basics – will always have demand.
People may cut back on their spending levels on certain things.
If people see their income drop, that means they’re probably going to cut out travel and hotels, delay the purchase of big spending items (e.g., cars, electronics), luxury shopping, and so on. But they’ll still need the everyday stuff.
A quality consumer staple business to invest in would be one whose consumer product or service sees negligible changes in consumer demand regardless of the condition of the economy, household wealth, or the current level of aggregate spending.
The general absence of cyclicality means their sales are not generally correlated with the economy’s health.
This is opposed to companies that are sensitive to interest rates (because of the nature of their cash flows or because they have a lot of debt) or highly interconnected with how the economy performs, like a manufacturing business.
Every financial asset is controlled by interest rates. But as long as the losses in income aren’t substantial, the level of interest rates isn’t as important.
For example, in 2008, one of the historically bad recessions, one of the few members of the S&P 500 that actually saw gains that year was Wal-Mart.
Wal-Mart sells a lot of the basics like groceries and personal care items. So this stock held its value quite well.
Interestingly, a company like Proctor & Gamble (PG) or Coca-Cola (KO) does not typically experience a drop in sales when the economy performs poorly (or when it’s booming).
Some consumer staples like Costco (COST) fit a “growth plus staple” type of character.
This makes consumer staple stock an attractive proposition for many traders and investors who are looking to better balance their portfolios with more stable, non-cyclical stocks.
Other stocks in consumer staple industries include consumer food manufacturers (e.g., General Mills), consumer tobacco manufacturers (e.g., Phillip Morris International), and consumer beverage (e.g., PepsiCo).
Traders and investors can feel pretty good about the idea that these companies or companies similar to them, on aggregate, are very likely to see their earnings increase fairly reliably at about the rate of nominal GDP growth.
Why consumer staples have pricing power
Stable demand is only part of the story. The other aspect is the ability to charge more without losing customers.
A lot of consumer staples companies own brands that people buy on autopilot. When you reach for toothpaste, laundry detergent, or a soft drink, you usually grab the same one you bought last time.
That habit is worth money. Procter & Gamble sells Tide, Pampers, Gillette, and Crest. When P&G raises the price of a Tide refill by 8 percent, most shoppers keep buying it. What’s semi-annoying to consumers is often cheered by investors because more of that cash flow goes to them.
The product is a small part of the household budget, and the perceived cost of switching to a cheaper brand and being disappointed feels higher than the few dollars saved.
Coca-Cola has spent more than a century building a brand that people associate with a specific taste. You can buy a generic cola for less, but a large share of buyers won’t.
That gap between what people will pay for Coke and what the syrup and can actually cost is the company’s margin. Pricing power also comes from distribution and shelf space.
P&G, Nestlé, and PepsiCo have relationships with every major grocery chain, convenience store, and warehouse club on earth. A new competitor can make a better cereal, but getting it onto shelves at Walmart, Kroger, and Costco at national scale is close to impossible without spending billions.
That barrier protects the incumbents. This shows up most clearly during inflation. In 2021 and 2022, input costs jumped for nearly every packaged goods company.
Procter & Gamble, PepsiCo, and Coca-Cola all pushed through multiple rounds of price increases, often 6 to 12 percent, and volumes held up reasonably well.
Their revenue and margins expanded even as costs rose. A company without pricing power would have eaten the cost increase and watched its margins shrink.
There’s a limit, though. Push prices too far and shoppers trade down to store brands. We’ll come back to that, because it’s one of the real threats to the sector.
Consumer staples vs. Other types of stocks
Stocks represent ownership in a company that entitles you to receive the earnings of the business over time.
For most stocks, this is a positive over the long run, but stocks move around a lot in price, which makes them risky. It’s easier for capital losses to exceed any dividends or distribution received from them. Many don’t have any payout in this regard and are dependent on capital gains.
However, research has shown that buying more defensive stocks – like consumer staples – helps to lower a stock portfolio’s volatility while still getting nearly the same returns as those associated with riskier business models (e.g., fast-growing tech companies).
A 2019 study by the investment management firm AQR found that the lowest beta parts of the market tend to have higher risk-adjusted returns than the highest beta components.
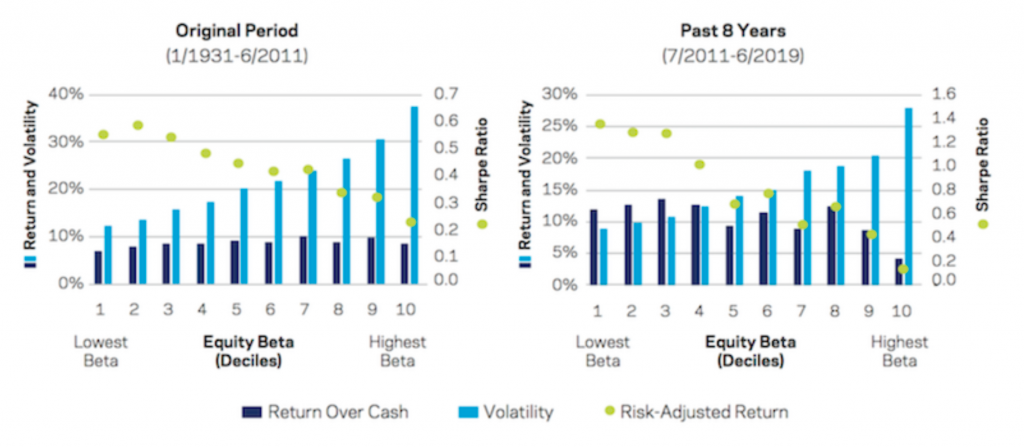
The green dots indicate the risk-adjusted return.
The 1931-2011 period (on the left image above) shows superior risk-adjusted returns in the lowest beta equities.
From 2011 to the present (right image), this relationship became even starker with the lowest beta stocks outperforming the higher beta ones.
The 2011-2019 period was also a relatively steady bull run.
This indicates that it might not be a bad idea to tilt a stock portfolio to lower beta sectors like utilities and consumer staples relative to higher beta, cyclical sectors like consumer discretionary, industrials, and low-/no-earnings tech companies.
When building a stock portfolio or an asset portfolio in general, we can think of things in a few ways:
Cyclical cash flow vs. Stable cash flow
We can increase our reward relative to our risk by balancing sector weights in a more efficient way.
To bring more stability to a portfolio, we can limit our allocation to more cyclical forms of cash flow and increase allocations to sectors that generate more stable cash flow.
Correlation
To balance risks more optimally, we should allocate more heavily toward sectors that are less correlated to the market and toward sectors that have lower beta to the market.
Value and growth
An important aspect of any portfolio is not about the one thing you should have, but rather having a blend of various things that can help improve your return relative to each unit of risk you take on.
So ideally, we should strive to have a healthy balance between value and growth.
Though tech is cyclical and volatile (because future cash flows are highly unknown) and has high drawdowns when people concentrate their bets in this sector, it is still an important growth leg and source of balance in a portfolio.
There is often what’s referred to as rotation in equity markets where capital moves from one sector to another.
Capital isn’t destroyed so much as it just circulates.
So if you can balance well between different assets, different sectors, different asset classes, different countries, and different currencies, you’ll have a better balanced and more consistently returning portfolio relative to one where you’re just concentrated in a few things.
Everybody’s favorite asset class will draw down more than 50 percent over the course of their lifetime.
That’s borderline intolerable when it comes to your life savings, so diversification is a key element to any portfolio strategy.
Size / market capitalization
We should also balance to a degree based on market capitalization or size.
A portfolio that’s split between:
- small caps (like the Russell 2000)
- large caps (e.g., Dow Jones Industrial Average), and
- the NASDAQ (i.e., a more tech- and growth-focused index)…
…in equivalent parts improves the reward relative to the risk in comparison to just, e.g., the S&P 500 alone.
Most consumer staples stocks tend to be larger conglomerates that are better diversified.
The best environments to own consumer staples
Consumer staples are a source of stable cash flows.
What environments are best for stable cash flows?
The latter stages of business cycles
A major one is toward the end of business cycles.
The end of a business cycle is characterized by inflation heating up and central bankers starting to slow things down to maintain price stability.
This includes measures like raising interest rates and slowing down purchases of bonds and other assets that they do as part of the QE programs.
As this starts to happen, you’ll generally see rotation in the stock market.
You’ll see the assets that are dependent on this liquidity start to underperform. The money isn’t disappearing, it’s simply shifting into safer forms of equities and other assets.
Long-duration equities like low-/no-earning tech which perform well in the early cycle start to give way to lower-duration (lower earnings multiples) stocks like consumer staples.
Characteristics of a late-cycle economy
During the late cycle, the unemployment rate is generally low. In the US, the U-3 rate is typically less than 4-5 percent.
In this case, as a trader, you’d probably want to pull back a bit on sources of cyclical cash flow in your portfolio – e.g., companies that sell autos, machinery, engage in manufacturing – and have more stable sources of cash flow.
As the cycle goes on, getting the mix right between growth and price stability is hard. Inevitably there’s a recession at some point.
But even in a recession, people still need to spend on the basics even if they’re pulling back their spending on things like restaurants, vacations, big purchases, and so on.
They still need food, basic medicine, and so on.
Moreover, these companies don’t rely on a cut in interest rates to offset the lost income to stabilize their stock prices.
Periods of high nominal GDP growth
The 2021-2022 period is a good example.
In the US and most of the developed world, policymakers were giving you the basic set of factors:
- high nominal GDP growth (real growth plus inflation)
- super-low nominal interest rates
The high nominal GDP growth came from lots of fiscal spending while central banks pinned short-term rates at very low levels as well as longer term rates through QE programs.
High nominal GDP growth is good for things that correlate closely with it.
Stuff that people always need (consumer staples) is a good proxy.
On the other hand, when GDP growth is low but policymakers are trying to get it going again, this tends to favor longer duration equities like tech, and consumer staples don’t perform as well.
Consumer staples stocks for inflationary or stagflationary environments
In terms of coming up with an inflation playbook or game-planning for a stagflationary environment, you have opportunities with consumer staples
Most portfolios are not very well prepared for inflation because they’re long a mix of stocks and bonds. The majority of both asset classes perform poorly when inflation runs above expectation.
Consumer staples can perform well in an inflationary environment because they benefit from aggregate spending.
A policymaker will have to worry about how much of that is real growth and how much of that is inflation. But for someone in the financial markets receiving that stream of income, it’s just cash flow.
Most portfolios also typically don’t own commodities, which will tend to do well in an inflationary environment.
This is because commodities are either producing the inflation in the first place because their prices are going up or because of the lack of supply relative to demand.
Most types of stocks and bonds are likely to suffer in real terms when inflation runs above expectations for an elongated period. This was true in the 1970s. A stocks and bonds portfolio gained in nominal terms but lost value in real terms.
So the general goal of those in the markets during periods of higher inflation and higher-than-normal nominal GDP is to try to lock in cash flows that approximate the level of growth in the real economy.
And they may even want to go short things like interest rates – e.g., Treasury futures, borrowing cash within reasonable levels, shorting eurodollar futures (which approximate fed funds futures).
This is because the general risk to a low interest rates / high nominal GDP environment is a rise in interest rates.
When this happens, credit creation in an economy falls, which hits nominal GDP, which hits incomes, which hits spending.
This causes the market to go from discounting a higher level of spending to a lower level of spending. When combined with a rise in interest rates, stocks decline.
Consumer staples are best equipped to handle this. They’re still likely to get hit, but outperform most other sectors and probably the broader market.
But the basic strategy in such a scenario is to arbitrage the difference between nominal GDP and the very low level of interest rates you’re receiving.
So if nominal GDP is 8-10 percent, for example, and interest rates are 0-2 percent, then that general menu is going to incentivize you to go long nominal GDP against interest rates. There’s a 6-10 percent spread to capture.
Consumer staples are a good way to own cash flows that correlate well with this level of spending in the real economy.
Their revenue should roughly mirror nominal GDP, plus they don’t always have costs that vary linearly with inflation. But it depends on the business, as each is different.
In other words, the pricing of consumer staples companies does a pretty good job of aligning with the inflationary pressure and aggregate demand and spending in the economy…
…but without having the variables costs tied to those pressures.
So, this can mean companies like consumer staples, utilities, and other some other equities (depending on the business) can effectively serve as a quality store of value, which roughly grow at the rate nominal GDP does.
They can also pass along a lot of pricing pressure off to consumers. We saw this during the rise in inflation in the US in 2021. Consumer staples companies like Proctor & Gamble raised their prices on consumers to handle the inflationary pressure.
The stock price reacted well in this scenario, as demand for these things wasn’t likely to fall much because of the price increases and it would help these companies’ margins.
Good Staple Business vs. Weak Staple Business
Not every company that sells everyday products is worth owning. The good ones share a few financial traits.
The first is high gross margins
Procter & Gamble runs gross margins around 50 percent.
Coca-Cola’s are higher still, often above 60 percent, because syrup costs very little to make relative to what people pay.
High gross margins give a company room to absorb cost spikes and still fund advertising, which protects the brand.
The second is steady, recurring revenue from small repeat purchases
People buy shampoo, soda, and snacks dozens of times a year, in small amounts, without thinking hard about it. That produces a smooth, predictable sales base. Compare that to a company selling refrigerators or cars, where delayed purchases swings the quarter.
The third is capital efficiency
Many staples businesses don’t need to sink huge amounts into factories and equipment to grow.
- They convert a high share of profit into free cash flow, which they return to shareholders or reinvest in brands.
- Return on invested capital for the better names sits well above their cost of capital, year after year.
Costco is a useful exception. Its gross margin on merchandise is thin, often around 11 percent, far below a typical staple.
But it makes most of its profit from membership fees and moves enormous volume at low prices. That model produces reliable cash flow and fierce customer loyalty, which is why it trades like a premium staple even though the margin structure looks nothing like P&G’s.
When you screen the sector, the businesses to favor are the ones with durable brands, high returns on capital, and the ability to grow volume slowly over time, not just push prices.
A staple that can only grow by raising prices is more fragile than it looks, because price increases eventually run into the trade-down problem.
Where the Growth Comes From: International and Emerging Markets
If snack and soda demand is flat or drifting lower in the United States and Europe, where does growth come from?
For the biggest staples companies, a large share of it comes from overseas. Procter & Gamble, Coca-Cola, PepsiCo, Colgate-Palmolive, and Philip Morris International earn roughly half or more of their revenue outside the United States. Coca-Cola sells its drinks in more than 200 countries.
As incomes rise in places like India, Indonesia, Nigeria, and Brazil, hundreds of millions of people start buying their first branded soap, toothpaste, or soft drink.
That gives the sector years of volume growth that mature markets can’t offer.
Philip Morris International is a clean example of the model. It was spun off from Altria specifically to sell outside the United States, and it has leaned into smoke-free products like its heated-tobacco device to grow in markets where cigarette volumes are declining.
The cost of all that foreign exposure is currency risk. When a company earns euros, reais, and rupees but reports results in dollars, a strong dollar shrinks those earnings when they’re converted back.
In years when the dollar rises sharply, a multinational staple can post solid local-currency growth and still report flat or lower dollar revenue.
That currency drag isn’t relevant to how the business is actually performing, but it shows up in the numbers and the stock price.
For you as an investor, trader, or researcher, this means two things.
- International exposure is where much of the sector’s growth lives, especially as developed-market demand softens.
- And the reported results of these companies will bounce around with the dollar, so it pays to separate currency effects from the underlying business when you judge how a company is doing.
Risks to consumer staples
The biggest risk is generally not the cash flows declining over time – central banks will always target an inflation rate of at least zero to avoid deflation – but rather the interest rates going up.
This is why it makes sense to short interest rates so you can benefit if your spread starts to close in low interest rates / high nominal GDP scenarios.
Most portfolios don’t hedge this main risk.
The main risk is interest rates rising because of the aforementioned factor of inflation. It’s not deflation, because if there’s deflation (e.g., 2008) they’ll stimulate and spend money, which will end up supporting the prices of various things.
The big risk to overstimulation is stagflation. This is where real growth doesn’t go up much, but inflation does.
And most portfolios – because they generally own mostly stocks while sprinkling in some bonds – are vulnerable under this situation because both underperform in real terms under such an environment.
Part of the reason why portfolios heavy on equities and more 60/40 stocks/bonds mixes are so popular is that they’ve worked for decades.
So most traders and investors start to extrapolate what they’ve become used to even when conditions are changing that make the future likely to be different from what it looked like in the rear-view mirror.
Most portfolios are heavily exposed to the rest of inflation.
Owning equities that can correlate better with inflation, like consumer staples, is just one step.
Owning consumer staples could also become challenging if policy tightening coincides with organically slowing growth and inflation.
In this case, consumer staples would be hit on both the interest rate aspect of their valuations in addition to the drop in nominal growth and nominal spending, which could hurt their revenue, earnings, and overall cash flow.
How input costs shape staples margins
The cost of goods sold for most staples companies is, at its core, commodities.
- Cereal makers buy grain.
- Chocolate makers buy cocoa and sugar.
- Beverage companies buy aluminum for cans, plastic resin for bottles, and sweeteners.
- Personal care companies buy oils and chemicals derived from crude.
- Shipping all of it burns diesel.
This cuts two ways. When a company can raise prices faster than its input costs climb, margins expand.
When input costs spike and prices can’t keep up, margins get squeezed.
Cocoa is a clear recent example. Cocoa prices roughly tripled through 2024 and touched record highs above $10,000 per metric ton, driven by poor harvests in the Ivory Coast and Ghana.
Hershey and Mondelez, which make Hershey bars, Cadbury, and Oreos, both warned that their chocolate margins would take a hit. They raised candy prices, but a price increase large enough to fully offset a tripling in a core ingredient risks pushing shoppers away, so they absorbed part of the cost.
Coffee tells a similar story. When green coffee prices rise sharply, roasters like J.M. Smucker, which owns Folgers, face the choice of eating the cost or raising prices on a product where shoppers notice every increase.
There’s usually a lag. A company locks in some input costs through hedging and supplier contracts, so a cost spike shows up in margins a few quarters later, and price increases take time to negotiate with retailers.
That lag is why staples margins can wobble for a year or two even when the long-run business is fine.
The takeaway is to look at where a company’s costs come from and how much pricing power it has to pass them along. A branded leader with 50 percent gross margins has far more cushion than a low-margin private label manufacturer facing the same cost spike.
Slower-moving risks: when consumer behavior changes
Interest rates and the business cycle are the risks this framework focuses on.
There’s another set that moves more slowly but can do real damage: shifts in what people actually buy.
The clearest current example is in cases of newer classes of weight-loss drugs. Semaglutide and similar GLP-1 medications, sold as Ozempic, Wegovy, Zepbound, and Mounjaro, reduce appetite. Millions of people now take them.
In late 2023, Walmart said its early data showed customers on these drugs were buying slightly less food, and Wall Street analysts started modeling lower demand for snacks, sugary drinks, and packaged desserts. Nestlé responded by launching a line of foods aimed at people on the drugs. PepsiCo and Mondelez management have pushed back, arguing the near-term hit is small.
Nobody knows the full effect yet, but it’s a real question mark hanging over the snack and soda makers that didn’t exist a few years ago. Private label is a slower, steadier threat. Store brands like Costco’s Kirkland Signature, Walmart’s Great Value, Target’s Good & Gather, and the entire Aldi and Trader Joe’s model keep taking share from national brands.
When shoppers feel squeezed, they discover that the store-brand cereal or paper towels work fine and cost less, and many never switch back. Every dollar that moves from a branded product to a private label one pressures the branded company’s volume and margins.
Health and wellness is another trend working against part of the sector.
- Soda volumes in developed markets have been drifting lower for years as people move toward water and unsweetened drinks.
- Cigarette volumes decline at a fairly steady low-single-digit rate every year, which is why tobacco companies lean so heavily on price increases and newer products to keep earnings flat to growing.
- Processed and sugary foods face steady pressure from buyers reading labels more carefully.
- Brand loyalty among younger shoppers also looks weaker than it was for their parents. Some of the assumed stickiness that makes a brand valuable may not hold as well for the next generation, which has grown up comparing prices and reviews on a phone before buying.
Of course, people will keep eating, cleaning, and drinking. But it does mean we can’t treat every legacy brand as permanently safe.
The companies adapting their products and acquiring faster-growing brands are in a better position than the ones defending a shrinking core with price increases alone.
This is also why many people interested in staples will simply index to a consumer staples ETF, like XLP, VDC, or FSTA, instead of picking the winners, which is a difficult game.
Or simply accept the staples portion of a broad index. For the big ETFs in this space – e.g., SPY, VT – staples are traditionally 4-5% of the total allocation.
What is and what isn’t consumer staples?
The basic idea we’ve mentioned is to buy stuff that people always need and doesn’t fluctuate much no matter how good or how bad economic conditions might be.
Still, there’s some blurriness in terms of what’s a need and what’s more discretionary.
For example, is tobacco a consumer staple?
Many would argue that it is since the people who use it have a tendency to consume the same amount on a regular basis.
It’s not something that’s needed to physically live, though it has characteristics of something that does when it becomes a part of people’s lifestyles.
On the other hand, something like going to see a movie isn’t a consumer staple because you don’t need to go to the movie theater.
What you can do is measure how stable the amount of spending is on a good or service when aggregate spending behavior changes.
For example, you can take variations in the employment rate as a proxy for falls in income. Then you can look at how that impacts spending in different types of products and services in the economy.
Then, you can take a look at how that flows through into earnings.
You can set the unemployment rate at increments like 5 percent (near full employment), 10 percent (bad recession – e.g., 2008), 15 percent, and 20 percent (very bad recessions – e.g., 2020).
For example, things that are very hard hit like airlines, travel, and restaurants see very large impacts.
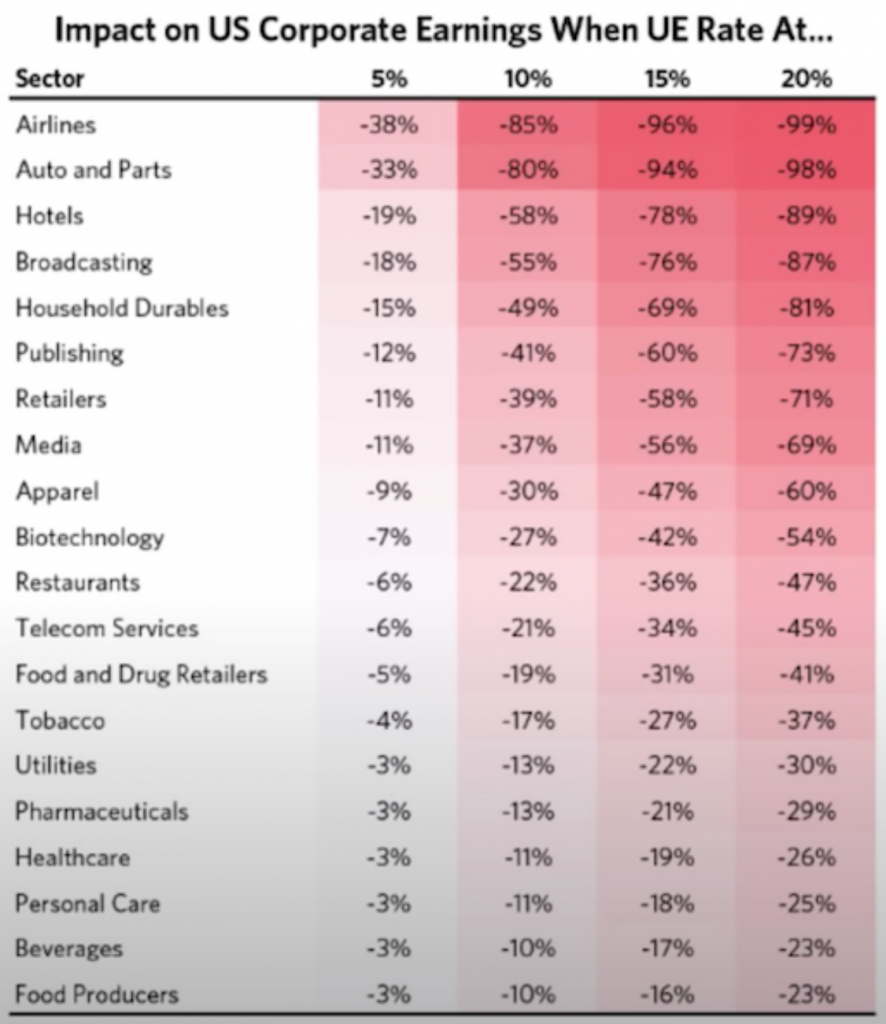
If unemployment hits 10 percent in those sectors, their earnings decline very close to zero.
This means you need very large declines in interest rates to offset the lost income to get a bottom in their share prices.
However, when rates are at or near zero percent, then you’re not going to get that. In a normal recession, you need 500bps of easing. Short-term rates are well short of five percent throughout the developed world.
Things like durable goods are somewhere in the middle. They aren’t true consumer staples but they aren’t decimated like things such as gaming, lodging, and leisure.
In our earlier example of tobacco, their earnings are hit 17 to 37 percent running unemployment from 10 to 20 percent. It’s closer to staples than a lot of other things.
Staples like food, basic medicines, and personal care products are a lot less.
Food producers and beverages are best off, which makes sense because it’s the most basic need.
Personal care, healthcare, and pharmaceuticals aren’t far behind.
Utilities as a form of consumer staples
Utilities are up there as well, just ahead of tobacco.
Utilities are considered their own sector outside of consumer staples, though they have staples-like properties.
Everybody needs electricity, running water, gas to heat their homes, and so on.
So even in a terrible recession people are still largely going to pay their utility bills.
Utility companies do, however, tend to be more leveraged. So this makes them more rate-sensitive than the average company.
So from a cash flow perspective, they tend to be pretty reliable. But their valuations can nonetheless be hit by a rise in interest rates.
Consumer Staples as a Way to Replace Bond Income
For decades, people could rely on bonds as a stable source of income.
But with cash and bond yields at close to zero and real yields on quality bonds negative in most of the developed world, it doesn’t make a lot of sense to own these.
In fact, some even look to short bonds.
They still have some diversification value. But for income generation purposes, they’re of little value and they still come with a lot of downside. (There’s no limit to high how yields can rise.)
More and more, traders and investors looking to still own bonds are going to have to go to other countries, which means taking on some level of currency risk.
There are certain ETFs that make it easier than buying individual foreign bonds (e.g., EMLC) but for many traders there’s an availability issue.
Alternative bond sources
Even an asset class like commodities can be a piece of replacing a bond portfolio.
Commodities on their own don’t yield anything, but this doesn’t matter as much when the yields on everything else have collapsed.
When interest rates are held low, especially in real terms, this makes commodities more attractive to own.
If there’s a lot of spending and economic activity, then the need for commodities increases. If supply doesn’t keep up, which is often the case, their prices go up.
The liquidity created from low interest rates has to go somewhere. And a lot of that is going to spill out of terrible-returning cash and bonds into other things.
Those other things are assets like:
- some forms of stocks
- private businesses
- commodities
- currency-like commodities (e.g., gold)
- real estate
- real assets (e.g., art, collectibles), and
- alternatives stores of value (e.g., bitcoin and other forms of cryptocurrency)
As we mentioned earlier in the article, if interest rates are low and nominal GDP is high then you probably want to own nominal GDP in a diversified way.
This also means that investment vehicles with an income generation focus – typically individual investors approaching retirement as well as pensions, endowments, foundations, and similar types of investors – are going to look for safer types of stocks and businesses to own.
Fixed income yields are so low in nominal terms and mostly negative in real terms that they want to be in equity markets but in a safer way.
Consumer staples can act as a type of bond replacement. It might not be the most exciting portfolio, but owning various types of assets whose cash flows closely mirror nominal GDP and spending patterns can be a good strategy.
As a whole, they’ll probably be more reliable than the average stock.
Dividends and Shareholder Returns
Relative to other sectors, a larger part of the return from consumer staples comes from dividends. This is the piece that makes them work as a bond substitute. Most large staples pay a dividend yield somewhere between 2 and 4 percent.
Procter & Gamble, Coca-Cola, PepsiCo, Colgate-Palmolive, and Kimberly-Clark have all paid and raised their dividends for decades.
Procter & Gamble has increased its dividend every year for more than 65 years. Coca-Cola and Colgate-Palmolive have each done it for more than 60. PepsiCo, Kimberly-Clark, Walmart, and Hormel have streaks above 50 years.
That group of long-term raisers is often called the Dividend Aristocrats, companies in the S&P 500 with at least 25 straight years of increases, and consumer staples are heavily represented in it. Those streaks matter because they signal discipline.
A company that has raised its payout through the dotcom crash, 2008, and the 2020 shutdown has proven its cash flow holds up – all due to the steady demand.
The number to watch is the payout ratio, the share of earnings paid out as dividends. A staple paying out 50 to 65 percent of earnings has room to keep raising the dividend and still reinvest.
One paying out 85 or 90 percent has less cushion, and a bad year could force a freeze. Some tobacco companies, for example, run very high payout ratios because volumes are shrinking and they return most of their cash to shareholders.
Buybacks are the second way these companies return cash. When P&G or Coca-Cola buys back its own stock, it reduces the share count, which lifts earnings per share even if total profit is flat.
Combine a 3 percent dividend yield, 0-2 percent of buybacks, and low-single-digit earnings growth, and you can get to a mid- to high-single-digit total return without the stock needing to do anything dramatic. That’s the math behind owning staples for income.
The trade-off is growth. A company returning most of its cash to shareholders has less left to reinvest, which is part of why staples grow earnings slowly.
You’re accepting modest growth in exchange for a reliable, rising income stream and shallower drawdowns. For an investor near retirement, or anyone trying to replace bond income, that’s often a fair trade.
How to Think about Valuation
Buying a good business at a bad price is still a bad investment.
Consumer staples can get expensive, and knowing roughly what you’re paying matters.
For example, P&G has been mentioned a lot in this article, but would you pay, e.g., 35x earnings for it at standard economic growth rates? It depends on the person.
Staples usually trade at a price-to-earnings ratio somewhere in the high teens to low twenties, a premium to the broader market in some periods and a discount in others.
The premium reflects the predictability of the earnings. You’re paying up for a smoother ride. The catch is the bond-proxy effect. Because investors buy staples partly for their dividends, the sector behaves a little like a long-term bond. With utilities, staples are the most bond-like sector.
When interest rates fall, the dividends look more attractive relative to bond yields, and money flows in, pushing valuations up. When rates rise, the opposite happens, and staples can de-rate even if the underlying businesses are doing fine.
This played out in 2016 and 2017. With bond yields very low, investors piled into staples, utilities, and other steady dividend payers as bond substitutes, and the sector got expensive. When yields started rising in 2018, those same stocks fell out of favor and underperformed, not because their sales dropped, but because of rising rates on the present value effect and the valuations came back down.
A simple check is to compare a staple’s dividend yield and overall prospective forward return to the yield on a 10-year Treasury. When a quality staple yields more than a Treasury, you’re getting paid to take equity risk and you also get dividend growth on top.
When the Treasury yields far more, the relative case for the staple weakens, and you’d want a cheaper entry price. It’s also worth looking at free cash flow yield and organic sales growth, the growth in sales stripped of acquisitions and currency moves.
A staple growing organic sales at 4 to 6 percent deserves a higher multiple than one stuck at 1 to 2 percent. Paying a premium multiple for a brand with shrinking volumes is how traders and investors lose money in a sector that’s supposed to be safe.
Staples vs. the Other Defensive Sectors
Consumer staples aren’t the only place to hide when you want lower volatility.
It helps to know how they compare to the other defensive corners of the market.
Healthcare is the closest comparison. People need medicine and medical care regardless of the economy, so demand is steady, much like staples.
Healthcare tends to offer more growth, since drug pipelines and aging populations push revenue higher over time, but it carries risks staples don’t, mainly regulation, patent expirations, and drug pricing politics.
A staples portfolio and a healthcare portfolio both cushion a downturn and have lower beta to the general market on average, but they wobble for different reasons.
Utilities are the most bond-like of the group. Their revenue is steady because everyone has to pay their electric and water bill, but their returns are often capped by regulators, and they carry a lot of debt.
That debt makes them more sensitive to interest rates than the average staple. When rates jump, utilities usually fall harder.
Telecom and certain real estate sectors also act as defensive, dividend-heavy holdings, and like utilities they tend to move with interest rates because of the high yields and heavy borrowing involved.
For building a defensive part of your portfolio, the practical point is that these sectors don’t all behave the same way – though they generally are positively correlated and mostly go up and down together.
Staples are mainly exposed to consumer demand and input costs. Utilities and telecom are mainly exposed to interest rates.
Healthcare is exposed to regulation and innovation. Holding more than one of them gives you steadier protection than concentrating in a single defensive sector, because they won’t all be hit by the same shock at the same time.
Combined, consumer staples (4.5-4.8%), utilities (2.2-2.4%), and healthcare (7.8-8.8%) are around 15-16% of the S&P 500 and 14-15% of the popular VT world stock ETF.
How the Sector Reshapes Itself through Deals
Consumer staples is a sector that’s constantly buying, selling, and splitting up brands. Naturally, that activity is part of how the companies adapt.
When a legacy brand stops growing, or at least growing to expectations, the parent often sells it and buys something faster-growing instead.
Procter & Gamble spent years cutting its brand count from around 170 down to roughly 65, selling off slower lines like Duracell and a large beauty portfolio to focus on its strongest names.
The goal was a smaller set of brands with better growth and higher margins. Deals also go the other way and don’t always work.
Kraft and Heinz merged in 2015 in a deal backed by 3G Capital and Berkshire Hathaway, with a plan to cut costs aggressively. The combined Kraft Heinz later wrote down the value of brands like Kraft and Oscar Mayer by billions of dollars, a reminder that cost-cutting can’t fix brands that consumers are slowly walking away from.
For you, the lesson is to watch what management is doing with the portfolio. A company pruning weak brands and adding categories that are actually growing – such as pet food, premium coffee, or health-focused snacks – is positioning for the next decade.
A company standing still while its core brands age is the one to be careful with, no matter how safe the sector looks on paper.
Do Consumer Staples Outperform a Regular Stock Portfolio?
All sectors outperform in one environment or another. So being well-diversified is a good thing, even if having a certain sectoral tilt can make sense to achieve certain goals.
In this case, we’ll do a comparison of consumer staples versus the aggregate stock market over time, using the two most popular ETFs of each.
- XLP = Consumer Staples Select Sector SPDR ETF
- SPY = SPDR S&P 500 ETF Trust
SPY came about in 1993. XLP has been around since December 1998, with 1999 being its first full year.
So, we can go from 1999 forward for comparison’s sake.
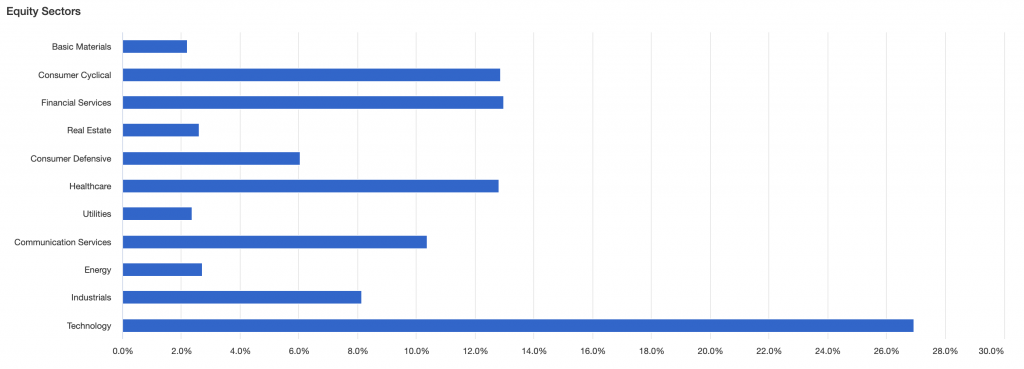
First, here’s the S&P 500’s sectoral breakdown:
S&P 500 Sector Weights
Relative performance over time:
Consumer Staples (blue line) vs. S&P 500 (red line)
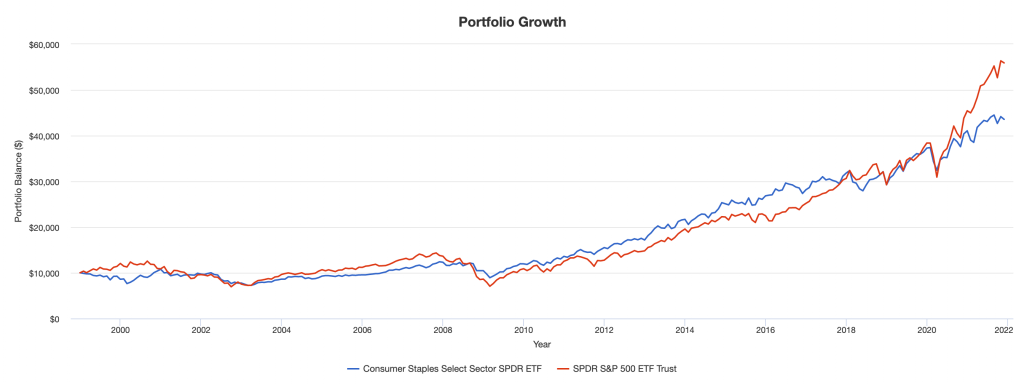
Here we can see year-by-year returns of each.
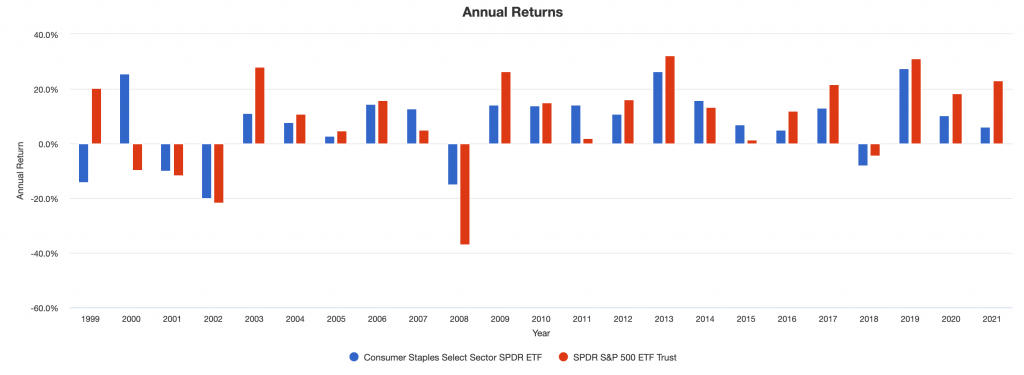
Portfolio Returns
| Ticker | Initial Bal | Final Bal | CAGR | Stdev | Best Yr | Worst Yr | Max Draw | Sharpe | Sortino | Correl |
|---|---|---|---|---|---|---|---|---|---|---|
| XLP | $10K | $43,561 | 6.6% | 12.2% | 27.4% | -20.1% | -32.6% | 0.45 | 0.64 | 0.59 |
| SPY | $10K | $55,908 | 7.8% | 14.9% | 32.3% | -36.8% | -50.8% | 0.47 | 0.68 | 0.99 |
- Initial Bal = initial balance
- Final Bal = final balance
- CAGR = annualized return
- Stdev = standard deviation in returns (annual)
- Max Draw = maximum drawdown
- Sharpe = Sharpe ratio
- Sortino = Sortino ratio
- Correl = correlation to US stock market
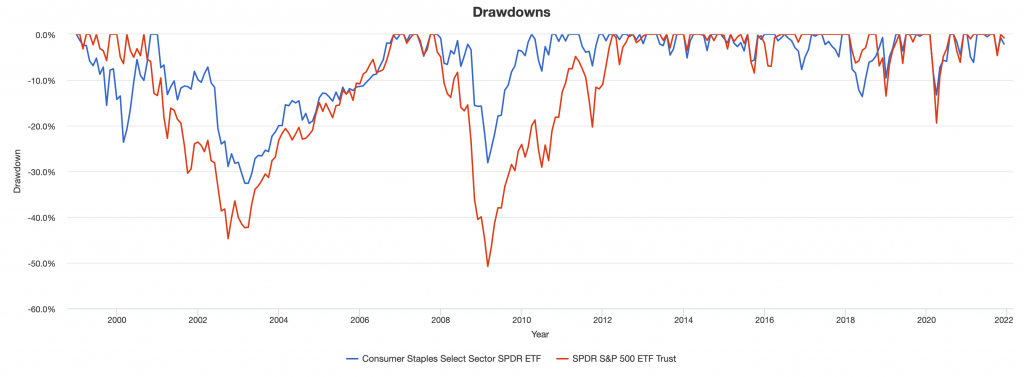
Drawdowns
Here we’ll look at drawdowns.
Consumer staples have the shallower drops during bear markets.
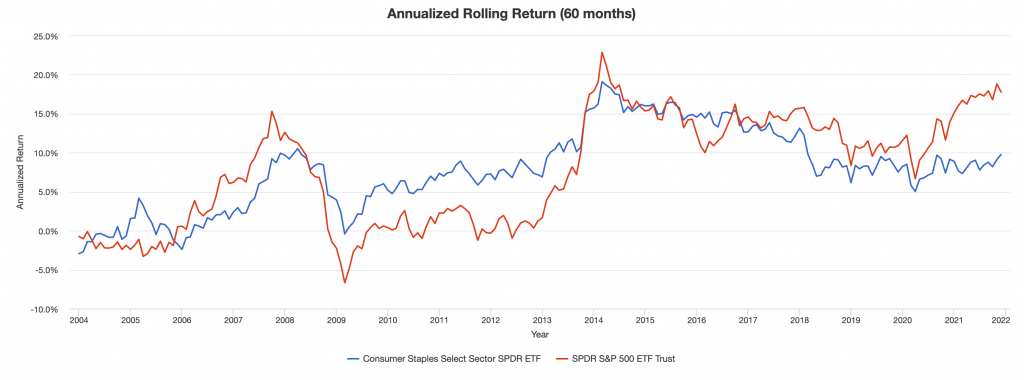
Rolling returns
Rolling returns also give an idea of their relative performance.
Consumer staples don’t have the big ups and downs, as shown in the graph.
Drawdowns for Historical Market Stress Periods
Here we can look at how each did during key market stress periods, such as the dotcom crash and 2008 financial crisis.
| Stress Period | Start | End | Consumer Staples | S&P 500 |
|---|---|---|---|---|
| Dotcom Crash | Mar 2000 | Oct 2002 | -28.94% | -44.71% |
| Subprime Crisis | Nov 2007 | Mar 2009 | -28.12% | -50.80% |
Drawdowns for Consumer Staples Select Sector SPDR ETF
The top-10 drawdowns for each, when they occurred, their length, recovery period, and total underwater time.
| 1 | Jan 2001 | Feb 2003 | 2 years 2 months | Dec 2006 | 3 years 10 months | 6 years | -32.61% |
| 2 | Dec 2007 | Feb 2009 | 1 year 3 months | Mar 2010 | 1 year 1 month | 2 years 4 months | -28.12% |
| 3 | Jan 1999 | Feb 2000 | 1 year 2 months | Oct 2000 | 8 months | 1 year 10 months | -23.62% |
| 4 | Feb 2018 | May 2018 | 4 months | Mar 2019 | 10 months | 1 year 2 months | -13.63% |
| 5 | Feb 2020 | Mar 2020 | 2 months | Jul 2020 | 4 months | 6 months | -13.28% |
| 6 | Apr 2010 | Jun 2010 | 3 months | Sep 2010 | 3 months | 6 months | -8.04% |
| 7 | Jul 2016 | Nov 2016 | 5 months | Feb 2017 | 3 months | 8 months | -7.72% |
| 8 | Jun 2011 | Sep 2011 | 4 months | Nov 2011 | 2 months | 6 months | -6.91% |
| 9 | Jan 2021 | Feb 2021 | 2 months | Mar 2021 | 1 month | 3 months | -6.15% |
| 10 | Aug 2015 | Aug 2015 | 1 month | Dec 2015 | 4 months | 5 months | -5.96% |
Drawdowns for SPDR S&P 500 ETF Trust
| 1 | Nov 2007 | Feb 2009 | 1 year 4 months | Mar 2012 | 3 years 1 month | 4 years 5 months | -50.80% |
| 2 | Sep 2000 | Sep 2002 | 2 years 1 month | Nov 2006 | 4 years 2 months | 6 years 3 months | -44.71% |
| 3 | Jan 2020 | Mar 2020 | 3 months | Jul 2020 | 4 months | 7 months | -19.43% |
| 4 | Oct 2018 | Dec 2018 | 3 months | Apr 2019 | 4 months | 7 months | -13.52% |
| 5 | Aug 2015 | Sep 2015 | 2 months | May 2016 | 8 months | 10 months | -8.48% |
| 6 | Apr 2012 | May 2012 | 2 months | Aug 2012 | 3 months | 5 months | -6.63% |
| 7 | Jan 2000 | Feb 2000 | 2 months | Mar 2000 | 1 month | 3 months | -6.43% |
| 8 | May 2019 | May 2019 | 1 month | Jun 2019 | 1 month | 2 months | -6.38% |
| 9 | Feb 2018 | Mar 2018 | 2 months | Jul 2018 | 4 months | 6 months | -6.28% |
| 10 | Sep 2020 | Oct 2020 | 2 months | Nov 2020 | 1 month | 3 months | -6.14% |
Summary statistics
| Arithmetic Mean (monthly) | 0.60% | 0.72% |
|---|---|---|
| Arithmetic Mean (annualized) | 7.43% | 9.01% |
| Geometric Mean (monthly) | 0.54% | 0.63% |
| Geometric Mean (annualized) | 6.63% | 7.80% |
| Standard Deviation (monthly) | 3.52% | 4.31% |
| Standard Deviation (annualized) | 12.20% | 14.92% |
| Downside Deviation (monthly) | 2.41% | 2.89% |
| Max. Drawdown | -32.61% | -50.80% |
| US Market Correlation | 0.59 | 0.99 |
| Beta(*) | 0.47 | 0.96 |
| Alpha (annualized) | 2.92% | -0.09% |
| R2 | 34.88% | 97.86% |
| Sharpe Ratio | 0.45 | 0.47 |
| Sortino Ratio | 0.64 | 0.68 |
| Treynor Ratio (%) | 11.84 | 7.31 |
| Calmar Ratio | 0.81 | 1.05 |
| Active Return | -1.61% | -0.44% |
| Tracking Error | 12.83% | 2.29% |
| Information Ratio | -0.13 | -0.19 |
| Skewness | -0.71 | -0.50 |
| Excess Kurtosis | 1.14 | 1.04 |
| Historical Value-at-Risk (5%) | -5.78% | -7.40% |
| Analytical Value-at-Risk (5%) | -5.19% | -6.37% |
| Conditional Value-at-Risk (5%) | -8.44% | -9.57% |
| Upside Capture Ratio (%) | 49.93 | 94.22 |
| Downside Capture Ratio (%) | 42.45 | 95.40 |
| Safe Withdrawal Rate | 5.04% | 5.05% |
| Perpetual Withdrawal Rate | 4.20% | 5.28% |
| Positive Periods | 164 out of 275 (59.64%) | 173 out of 275 (62.91%) |
| Gain/Loss Ratio | 1.04 | 0.90 |
| * US stock market is used as the benchmark for calculations. Value-at-risk metrics are based on monthly values. | ||
Conclusion
The consumer staples sector is a good place to potentially find investments that sell quality consumer products that are always valued and in demand by virtually all consumers because their necessity does not change throughout economic cycles.
Accordingly, consumer staples are potentially an area to find a quality combination of yield and relative safety.
It’s especially a concern when interest rates are low and traders and investors want to look for assets that can help replace bonds in their portfolios.
With that said, consumer staples will not outperform the overall stock market.
They have done so over periods. But when liquidity is looser than normal, the overall stock market will tend to outperform because safety doesn’t traditionally do as well in these environments.
So you still want to be diversified across a number of stocks within the consumer staples sector and other types of stocks as well.
But consumer staples might be a quality to tilt toward in a stock portfolio, especially later in business cycles when liquidity starts tightening.
It can also be an alternative bond replacement strategy in certain environments where interest rates are low to help enhance yield in a portfolio in a relatively safe way relative to taking on extra exposure to riskier equities.
As a whole, consumer staples might not be the most exciting sector, but owning various types of assets whose cash flows closely mirror consumer spending patterns can be a good strategy to bring more stability to a stock portfolio.
As a whole, they’ll probably be more reliable than the average stock overall, even if they don’t necessarily outperform on net.
Frequently Asked Questions (FAQ)
Is it better to put money in a select few consumer staples stocks or buy an ETF?
Generally speaking, the more diversified you are, the less likely you are to have big ups and downs.
Even if you buy an ETF, that will move around quite a bit given the nature of stocks. That volatility will be enhanced by buying a smaller selection of individual stocks.
Individual security selection also assumes that you can do better than a representative index. Most traders and investors won’t be able to do this over time and active management is a more hands-on type of trading or investing style.
What’s in an ETF of consumer staples stocks?
It depends on the ETF, but the most popular two are XLP and VDC.
They’re very similar to each other in terms of their holdings.
Here are XLP’s top-15 holdings and approximate weights (which shift around over time based on performance and changes in what’s held in what amount):
| PG | Procter & Gamble Company | 16.79% |
| COST | Costco Wholesale Corporation | 10.60% |
| PEP | PepsiCo, Inc. | 10.11% |
| KO | Coca-Cola Company | 9.68% |
| PM | Philip Morris International Inc. | 4.53% |
| MDLZ | Mondelez International, Inc. Class A | 4.53% |
| WMT | Walmart Inc. | 4.37% |
| MO | Altria Group Inc | 4.26% |
| EL | Estee Lauder Companies Inc. Class A | 4.20% |
| CL | Colgate-Palmolive Company | 3.50% |
| KMB | Kimberly-Clark Corporation | 2.33% |
| STZ | Constellation Brands, Inc. Class A | 2.01% |
| GIS | General Mills, Inc. | 1.99% |
| SYY | Sysco Corporation | 1.96% |
| ADM | Archer-Daniels-Midland Company | 1.84% |
Here are VDC’s top-15 holdings:
| PG | Procter & Gamble Company | 13.38% |
| COST | Costco Wholesale Corporation | 8.60% |
| PEP | PepsiCo, Inc. | 7.96% |
| WMT | Walmart Inc. | 7.78% |
| KO | Coca-Cola Company | 7.77% |
| PM | Philip Morris International Inc. | 4.35% |
| MDLZ | Mondelez International, Inc. Class A | 3.63% |
| MO | Altria Group Inc | 3.34% |
| EL | Estee Lauder Companies Inc. Class A | 3.27% |
| CL | Colgate-Palmolive Company | 2.67% |
| KMB | Kimberly-Clark Corporation | 1.99% |
| STZ | Constellation Brands, Inc. Class A | 1.66% |
| GIS | General Mills, Inc. | 1.64% |
| ADM | Archer-Daniels-Midland Company | 1.59% |
| SYY | Sysco Corporation | 1.57% |
As you can see in each case, the top-5 holdings make up around 50 percent of the ETF’s total weight and the top-10 holdings make up around 70 percent of the total allocation.
What is the best consumer staples ETF?
The main two candidates are XLP and VDC.
VDC generally has a slightly lower expense ratio. This is generally true for most of Vanguard’s ETFs relative to SPDR’s.
But XLP has been around longer and is more liquid, with a higher AUM. XLP’s options markets tend to be more liquid as well for those interested in trading options.