How to Trade the Credit Impulse


The credit impulse has been given a lot more attention over the past several years as a potential variable to include as part of a tactical asset allocation strategy.
Traders have long known that credit creation is a big factor in what determines prices. The price of anything is the amount of money and credit spend on it divided by the quantity.
The entity with the biggest lever on credit creation within any given country or jurisdiction is the central bank. There are three basic forms of policy that they engage in (interest rates, asset buying, and coordination with fiscal policy).
When credit conditions are loosening, it generally causes the market to push prices higher. When credit is tightening, it typically does the opposite and pulls prices lower.
No matter if the credit impulse is weakening or strengthening, we’ll go through how to position yourself based on what the credit impulse is doing.
Credit impulse basics
The credit impulse is the change in credit divided by GDP.
The credit impulse measures how much credit growth deviates from trend, i.e., from a constant credit-GDP ratio that would apply if credit were growing at its average rate over the business cycle.
For instance, the ECB’s credit impulse data denotes the 1-year change in outstanding euro credit to non-financial borrowers via quarterly data on loans to households and corporations.
As a second derivative variable, credit impulses need not always coincide with the credit cycle. Credit can be growing, but the credit impulse can be falling because the rate of change of credit growth is dropping.
A positive credit impulse means that credit is growing faster than trend, and vice versa for a negative credit impulse.
The credit impulse does not capture other aspects of credit supply conditions such as lending standards. But it has been found to be a useful early indicator for recessions, which we go through the dynamics of in this article.
In forecasting models, the historical relationship between recessions and credit impulses can be used to make forecasts about future economic activity without knowing where we are in the business cycle exactly.
Credit impulse in tactical asset allocation
The credit impulse variable has picked up in popularity in trading circles as a global asset allocation variable due to the reasonably strong correlation to cross-asset moves seen since 2011.
As mentioned, credit impulse is a second derivative metric. So even if credit creation is still improving, a declining rate of change of credit growth means the credit impulse is weakening and could even cause credit creation itself to go negative if the trend persists.
There was a voluntary drawdown on the revolving facilities that were widely utilized during the second and third quarters of 2020.
So, credit growth slowed markedly as:
a) liquidity facilities were not as needed, and
b) the impulse from the fiscal and monetary support weakened in year-over-year terms.
The question for traders is whether a weakening credit impulse of this sorts means anything for their portfolios or how they should make decisions.
G3 credit impulse
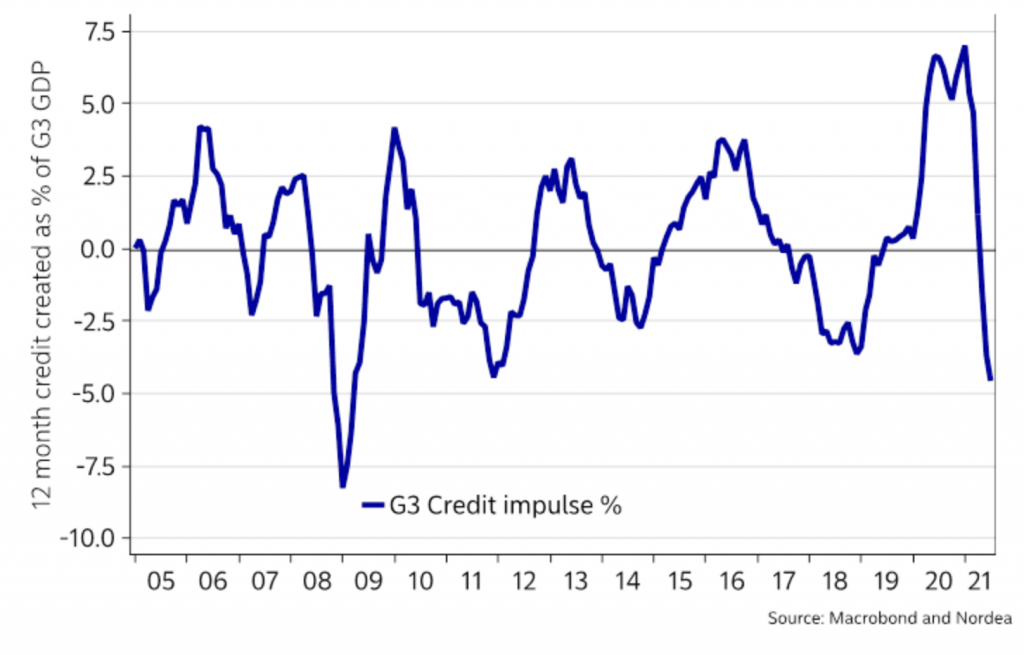
Why does the credit impulse matter from an asset allocation point of view?
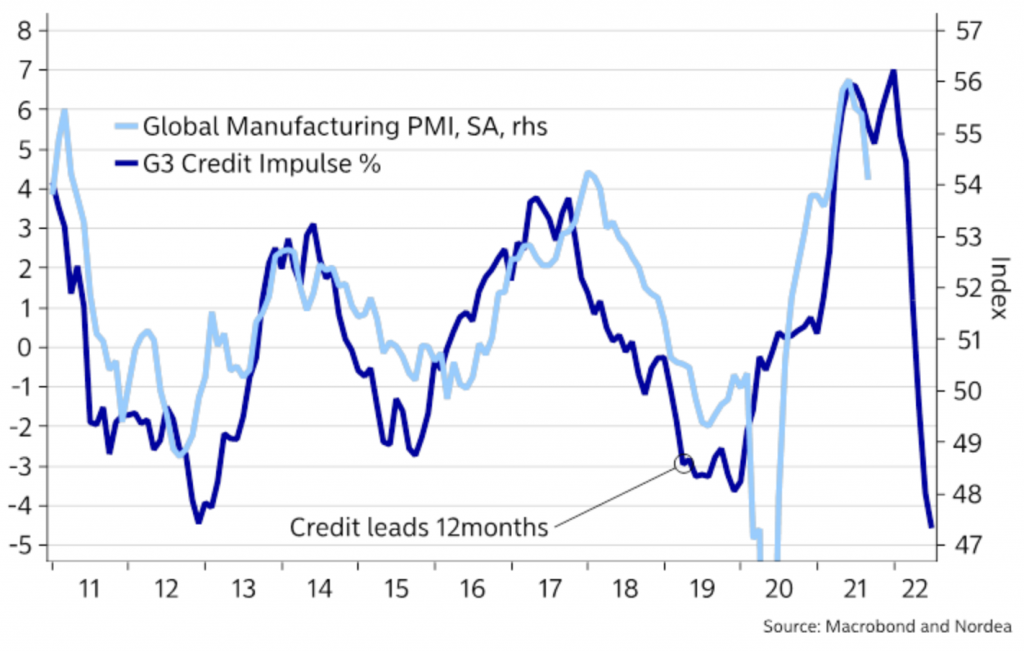
The credit impulse has been the best leading indicator of the Global Manufacturing PMI since 2008. It’s often used as a growth momentum indicator.
Manufacturing, of course, is a highly cyclical industry.
And the cyclical elements of the economy are driven very heavily by credit growth. Accordingly, one should care about the credit impulse as an allocation variable for those who make those types of tactical decisions in their portfolios.
Global manufacturing cycle vs. the credit impulse
Distributional impacts of the credit impulse
Credit impulse has the largest impact on credit-sensitive sectors like Consumer Discretionary and Energy. Companies in these sectors are more credit-dependent than others.
When credit slows down, it takes away this momentum which often leads to underperformance relative to other sectors.
Credit impulsive companies tend to outperform during these periods because growing credit trends represent investment that turns into higher cash flows for the business.
Early in a credit expansion cycle, credit growth is often “good” because the cash flows exceed the cost of credit.
But this eventually turns late in the cycle when credit becomes more expensive (central banks raise interest rates, typically to cool down inflation). Unsustainable growth trends become extrapolated. As a result, the credit costs eventually swamp the cash flows, causing the credit growth to be a negative influence.
When the credit impulse weakens
When the credit impulse weakens while central banks continue to ease, it’s not necessarily a bad scenario for risk assets.
The true risk lies in when the most important central banks globally (notably, the Fed, ECB, and BOJ) tighten monetary policy into a trend of decelerating credit creation.
This was the scenario in Q4 2018, where global equities declined around 20 percent. (There were also ‘trade war’ tensions during this period between the two largest economics – the US and China – but monetary policy predominated.)
Policy tightening into a falling credit impulse
The move to tighten monetary policy into a falling credit impulse caused more traders and investors to move into cash as interest rates rose relative to the yields on risk assets.
Stocks and credit fell markedly during the Q4 2018 period.
Policy easing into a falling credit impulse
A credit deceleration that is paired with continued easing of monetary policy is more likely to create more orderly asset allocation shifts.
The most notable is from value back to growth stocks. Value stocks are prized for the cash flows they provide in the present and they typically have dividends and are more mature companies. Growth stocks typically have cash flows discounted to come further out in the future.
Moves out of emerging markets and highly cyclical commodities and stocks are also common during periods of policy easing into a falling credit impulse.
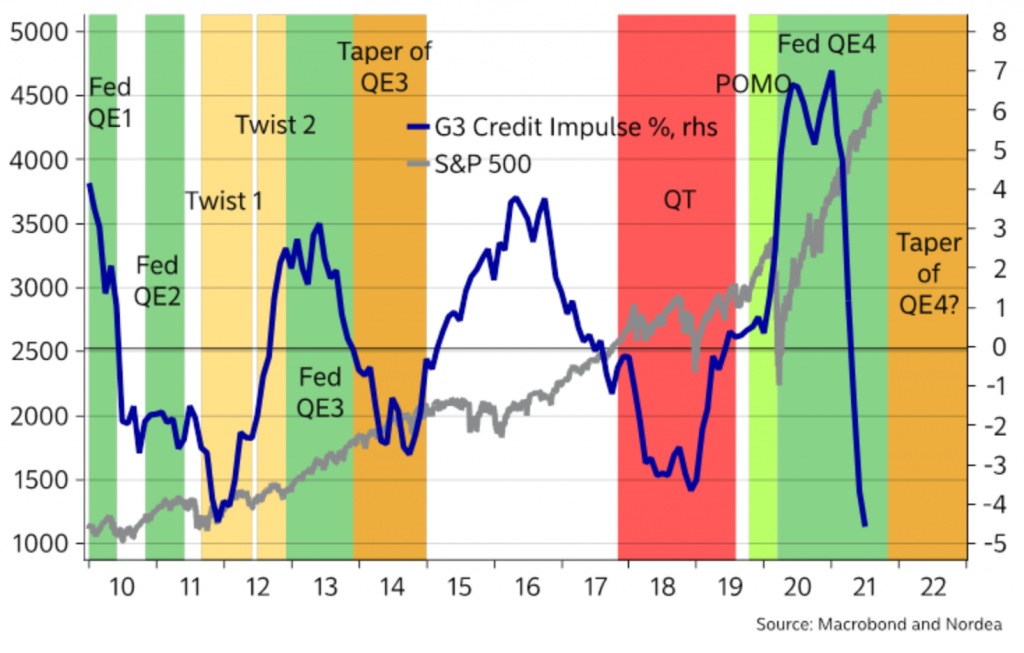
What recent history shows
Let’s look at how various assets have performed in periods of a falling credit impulse combined with continued monetary easing.
Also note that this is simple credit impulse analysis. There are other variables that impact movements of asset prices and there may be reasons why things turn out differently if the analysis is overly one-dimensional.
A declining credit impulse paired with monetary tightening (red area) is bad for risk assets, while it’s clearly not as bad when it’s paired with continued QE (green and orange areas)
Playbook takeaways: Falling credit impulse
Monetary easing + Falling credit impulse
Overall, a dropping credit impulse in the context of monetary easing tells you to:
- Overweight defensive stocks versus cyclicals and/or growth against value
- Have some amount of duration exposure in fixed income space and
- Be long USD versus other currencies, including EM FX (and, by extension, long US credit versus global peers)
Monetary tightening + Falling credit impulse
A dropping credit impulse in the context of monetary tightening tells you to:
- Sell risk assets, or at least rotate into defensives with strong cash flows and strong balance sheets over other types of equities
- Own more cash
- Be long USD against EM FX
Will a fading credit impulse lead to improved bond performance?
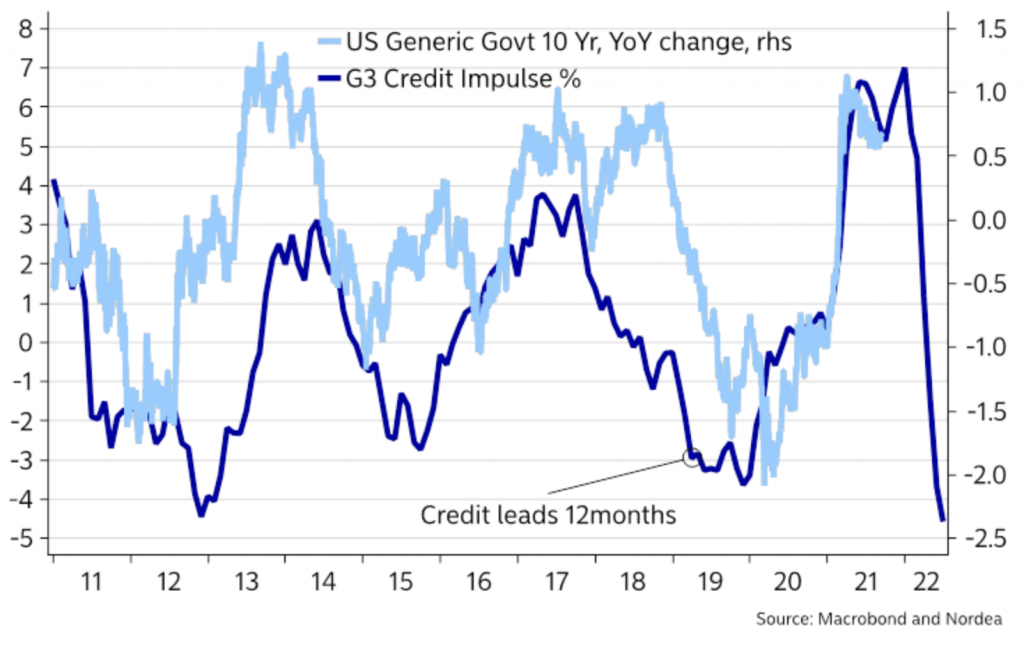
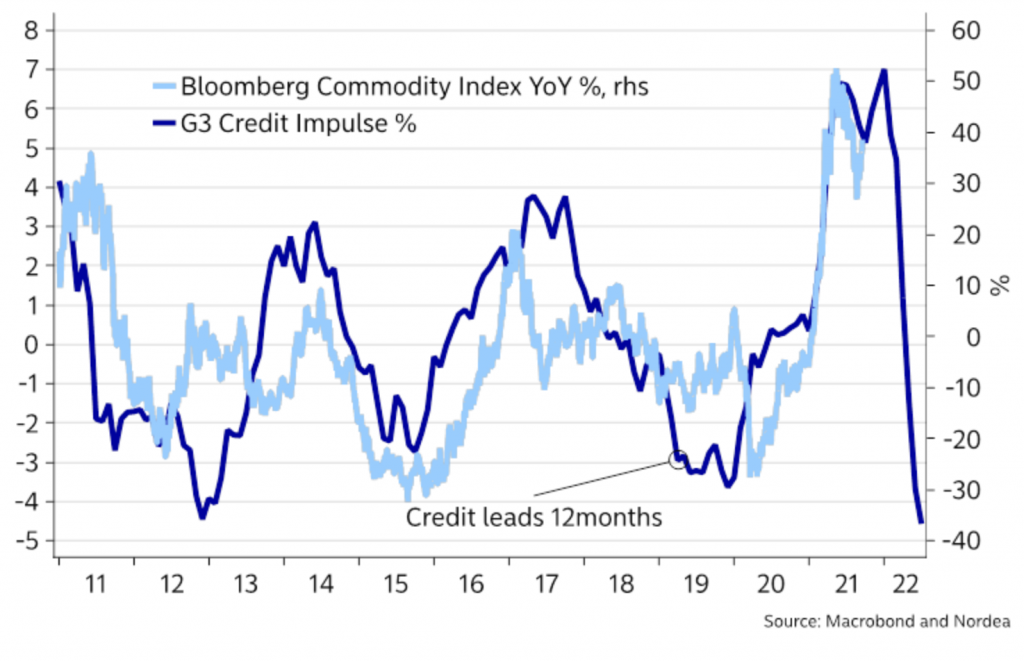
Cyclical assets like commodities (industrials) and energy and financial stocks tend to underperform a while after a weakening credit impulse.
This is because the credit impulse is the big driver of the economy’s cyclical elements.
Weaker credit impulse tends to signal lower commodities
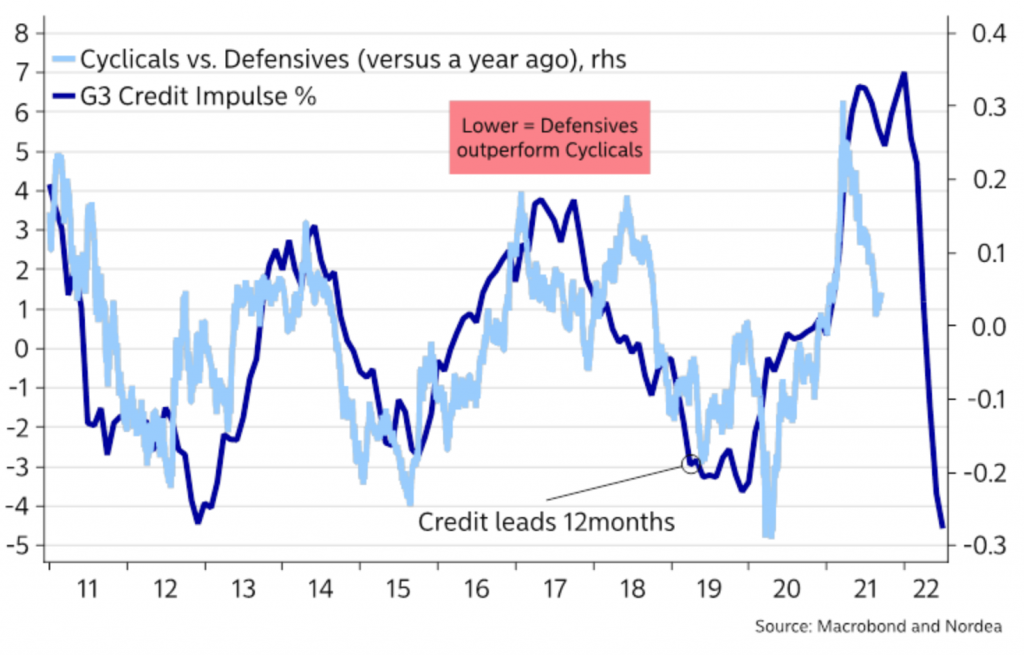
Weaker credit impulse tends to favor overweighting defensive stocks versus cyclicals
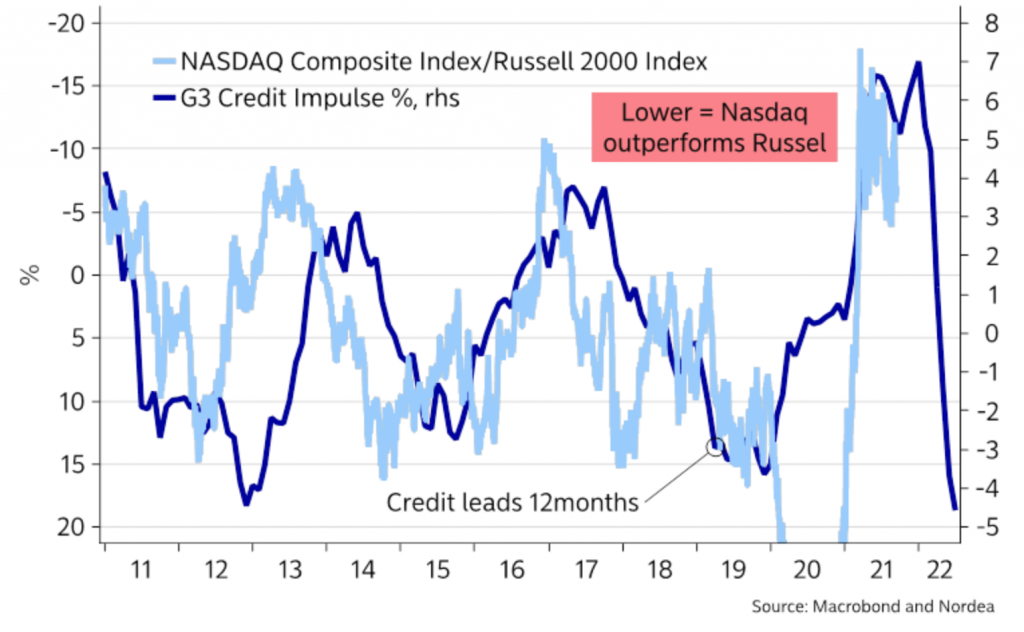
A weaker credit impulse also tends to disfavor smaller cap stocks versus their large cap peers. This is generally good for tech vs. the more mature parts of the economy.
NASDAQ tends to outperform the Russell 2000.
Russell 2000 underperforms versus NASDAQ when the credit impulse falls
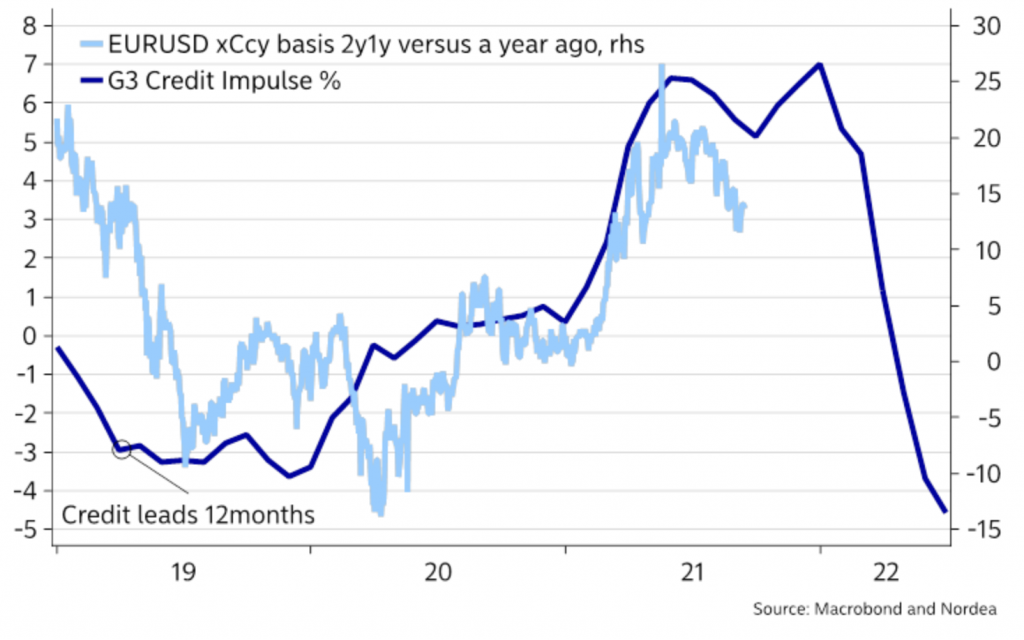
Weaker credit impulse usually leads to a lower EUR/USD
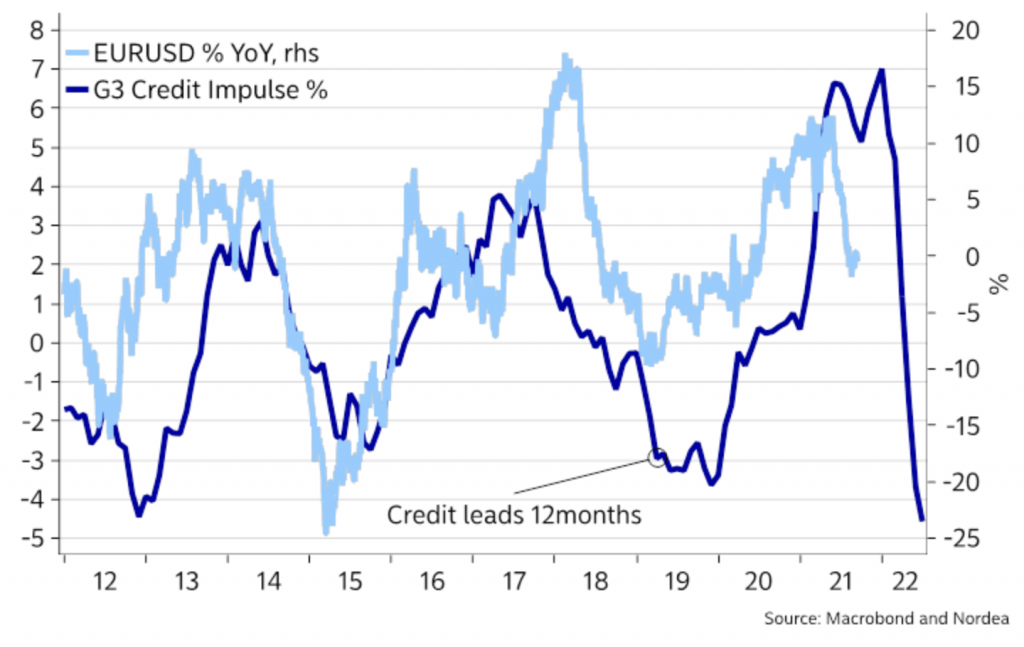
The US dollar also tends to get more expensive in the cross-currency basis market when the credit impulse weakens.
This is because the falling credit impulse increases the risk of a dash for dollar cash. So the market needs to reprice the risk of potential USD liquidity scarcity via the FX basis.
A falling credit impulse tends to make the USD more expensive via the FX basis
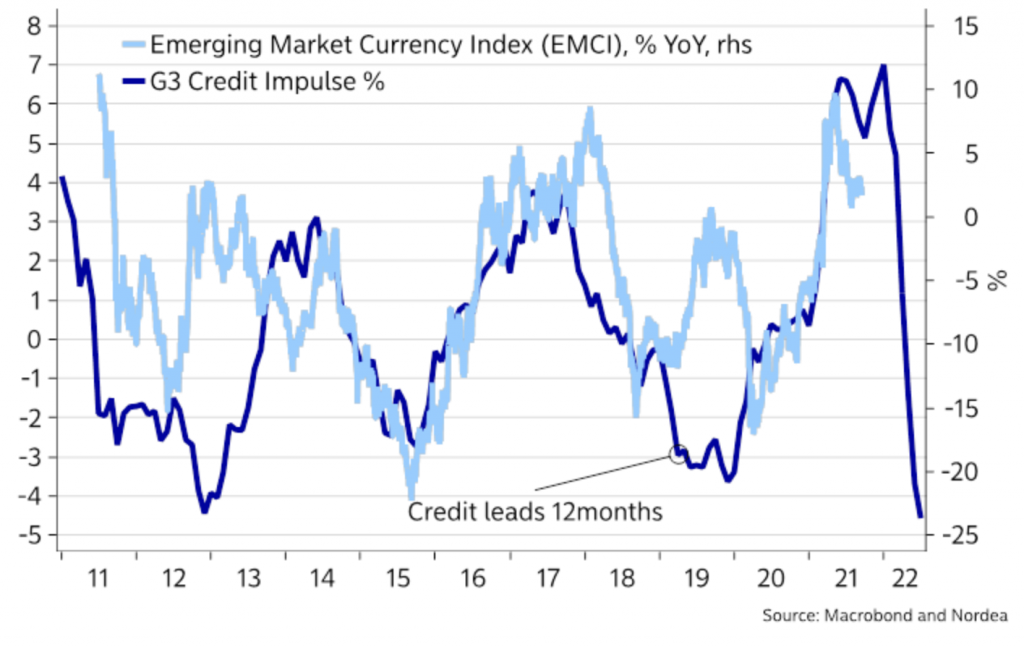
Emerging markets are also, on aggregate, likely to underperform into slowing credit creation as the USD gets more expensive and liquidity premia on the USD in the FX basis rises.
Playbook takeaways: Rising credit impulse
When the credit impulse is rising, this generally receives less attention because the nature of it isn’t bearish for risk assets.
So the playbook is basically reversed.
Monetary easing + Rising credit impulse
Overall, a rising credit impulse in the context of monetary easing tells you to:
- Overweight cyclical and growth/long-duration stocks versus defensives
- Lower your duration exposure in fixed Income space (bonds tend to be out of favor when the economy improves) and
- Be short USD versus other currencies, including EM FX
In general, it is the best environment for risk assets.
Monetary tightening + Rising credit impulse
This is a rare scenario.
Monetary tightening generally happens when the second derivative of credit creation relative to output falls.
But it did happen to some extent in 2013 and in early-2017. It’s a more mixed environment because you have monetary tightening on one hand but a rising impulse on the other.
When monetary policy is tightening, it generally means that the credit impulse will eventually turn over and drop.
A rising credit impulse in the context of monetary tightening tells you to:
- Maintain long equities exposure, but start to trend in favor of adding defensives with strong cash flows and strong balance sheets against cyclicals to prepare for a less favorable environment for cyclicals
- Add more cash and bond exposure as yields climb
- No strong FX bias