11 Tail Trades for 2021: Finding What’s Underpriced

2020 brought a lot of excitement to the markets and was full of tail events and corresponding tail trades that would have profited in a big way.
We commented in previous articles on how strategies long tail events made incredible returns during the year. In some cases that meant gaining 30x to 40x the value of the portfolio just by owning deep OTM options. 2020 was one of those rare years.
In this article, we’ll take a look at some ideas for tail trades looking ahead over the next year or more.
First, we should describe specifically what a tail trade is.
A tail trade refers to something that attempts to position for – and potentially capture the returns associated with – an out-of-consensus viewpoint.
It’s about looking to profit from a part of the returns distribution that is priced cheaply because few expect it to happen.
So they should reflect economic and market scenarios that truly could happen, but are only marginally discounted in financial markets.
Most of these will deal with macroeconomic themes but will include some idiosyncratic stories as well.
What is consensus?
Consensus should first be defined.
Consensus should not be taken as the forecasts of sell-side economists and market strategists. Instead it should be viewed as what’s discounted into markets directly – essentially traders’ and investors’ views that they’re directly betting on.
In the case of discounted expectations, there is actual money riding on the outcomes. Sell-side projections are simply forecasts that are distributed as part of the standard marketing materials and general communications to their clients.
When investment banks put a price target on a company, for example, it is generally not representative of an independent, objective view. The companies they are “analyzing” are often clients or clients they’d like to have for the various types of services that investment banks provide (e.g., capital raising, lending, M&A advisory, and so on).
Sometimes predictions and forecasts and what you actually see in the real world (i.e., the markets) are out of whack.
For example, in the macro space, one prediction you know you’ll practically always see each year is a higher 10-year US bond yield. It’s a popular prediction from banking strategists because higher bond yields go with a higher nominal growth rate.
It’s popular to be bullish on economic growth and that’s essentially what higher bond yields typically signal.
But that doesn’t mean that’s priced into markets.
For example, as this is being written, the US 10-year is at just under a one percent yield and priced to increase by just 20bps (0.2 percent) in one year’s time.
The common prediction of a US 10-year above 1.5 percent in a year is actually an out-of-consensus bet, even if it’s a popular opinion in printed words only.
Consensus bets in the markets
Let’s look at what actually is priced in:
– Effective vaccines and unified fiscal and monetary stimulus will help growth recover in 2021 and into 2022.
– Q1 2021 is priced as a growth slump for the US and Europe.
– US inflation will remain low and Europe inflation will remain close to zero.
– Global reflation supports a higher EUR/USD (US no longer has an interest rate advantage now also being at zero, and the 2018 fiscal stimulus has fully washed out, leaving no remaining structural growth advantage).
– Equity markets price in a very bullish growth outlook and credit spreads are expected to remain very tight.
– “There is no alternative” (TINA) is back as the overarching theme in broader capital allocation decisions. When cash and bonds don’t yield anything in all the major reserve currency markets (US, developed Europe, Japan), more of that money will head into stocks and speculative assets.
– There is practically no expectation that short-term interest rates will be changed for many years going forward.
– QE programs are not expected to be tapered, with central banks committed to keeping yields low on the long-end of the rates curve.
Tail trades
All of the tail trades represented here will be in the form of long options trades.
Options and derivatives give you the potential large upside while limiting your downside. Options essentially enable you to structure your trades to capture the specific distribution of returns you’re looking for.
For tail trades, this enables you to capture as much or as little of the tail of the distribution as wanted.
Some will form trades in terms of spreads to bet on an out-of-consensus view.
This enables them to capture a bigger part of the distribution while limiting costs – e.g., buy an ATM or slightly OTM put and sell an OTM put. The ATM/slightly OTM put enables them to express a view in a limited risk way while also limiting costs by selling an OTM put (in exchange for capping their upside).
The best trades ideally are those where the cost of being wrong is negligible while providing a lot if you’re right. Namely, they provide convexity.
#1: Tesla (TSLA) bubble deflation (or implosion)?
Tesla’s a car manufacturer with less than one percent global market share, but has managed an astronomical valuation.
Part of it is narrative. Many expect it to be more of a distributor of technology rather than a car company. General Motors (GM) produces millions of cars profitably per year (Tesla does around 3 percent of their total), but is priced at less than one-tenth that of Tesla.
Tesla’s autonomous vehicle technology lags way behind incumbents, not just Google’s Waymo but traditional car manufacturers (e.g., Audi).
It was recently added to the S&P 500, which provided plenty of passive flows.
That cash and bonds don’t provide any returns (and negative real returns) certainly helps.
That it’s a long-duration asset – i.e., its projected cash flows are projected to come many years out – has helped given the sensitivity of these types of assets to low rates and liquidity.
Yet shorting the stock is risky. After the announcement that it would be added to the S&P 500 until its inclusion, it rallied 70 percent.
By comparison, a straight delta-one stock short can only yield you 100 percent.
While it may be alluring to short something that many think is heavily overvalued, the risk/reward doesn’t make a lot of sense when you can lose multiples of your upside.
So, not many want to short the stock either given the danger and having been burned previously. The chart below shows short interest as a percentage of outstanding shares.
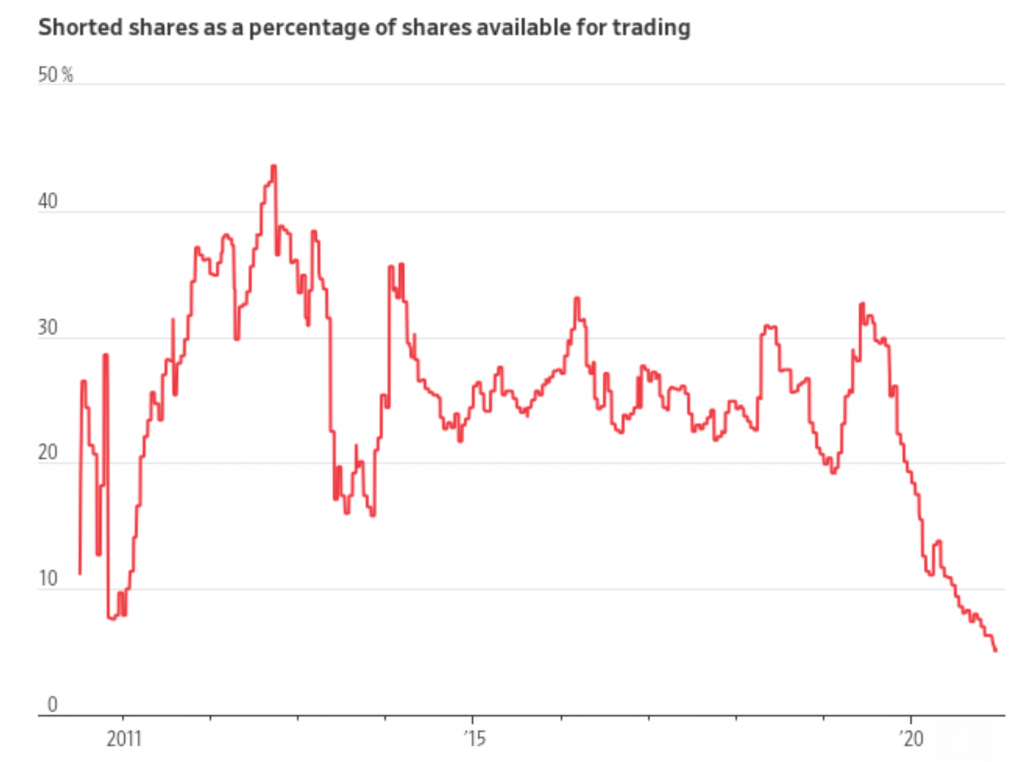
(Source: IHS Markit)
But that doesn’t change the fact that many want the same exposure, viewing the valuation as unsustainable.
This is where the options market comes in. You can bet on shorting it in a limited risk way.
So, they pile into the options market and bid up the prices there.
A 100 strike put option dated out about one year, over 80 percent out-of-the-money (OTM), costs about $2.60 per share.
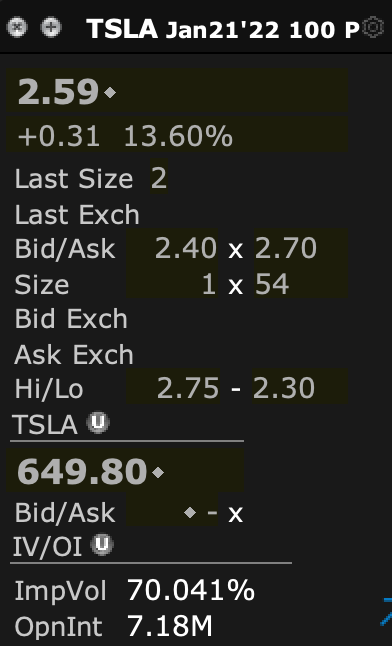
In other words, you get $100 of upside for $2.60 in premium. Your maximum potential return is about 38x.
The 38x upside sounds nice, but that involves an extreme event happening – the bubble popping in a big way. It means the stock has to fall over 80 percent just to get the option in-the-money (ITM). Of course, you can make profit on the way down if the positive delta (price) and vega (volatility) effects are in excess of the theta (time).
Bearish single-stock options bets can also be a type of hedge against a bullish overall equities portfolio. But naturally, of course, single-stock wagers are idiosyncratic and imperfect as hedges against broader themes in a portfolio.
#2: Gold below $1,500
When cash and bonds don’t yield anything (and negative in inflation-adjusted terms), people look for alternatives to holding fiat-based stores of wealth.
Loose fiscal and monetary policy is a game of currency debasement over time.
That’s turned gold into a crowded trade.
In the GLD options market (gold ETF), we get this type of distribution, with the yellow line marking the spot price.
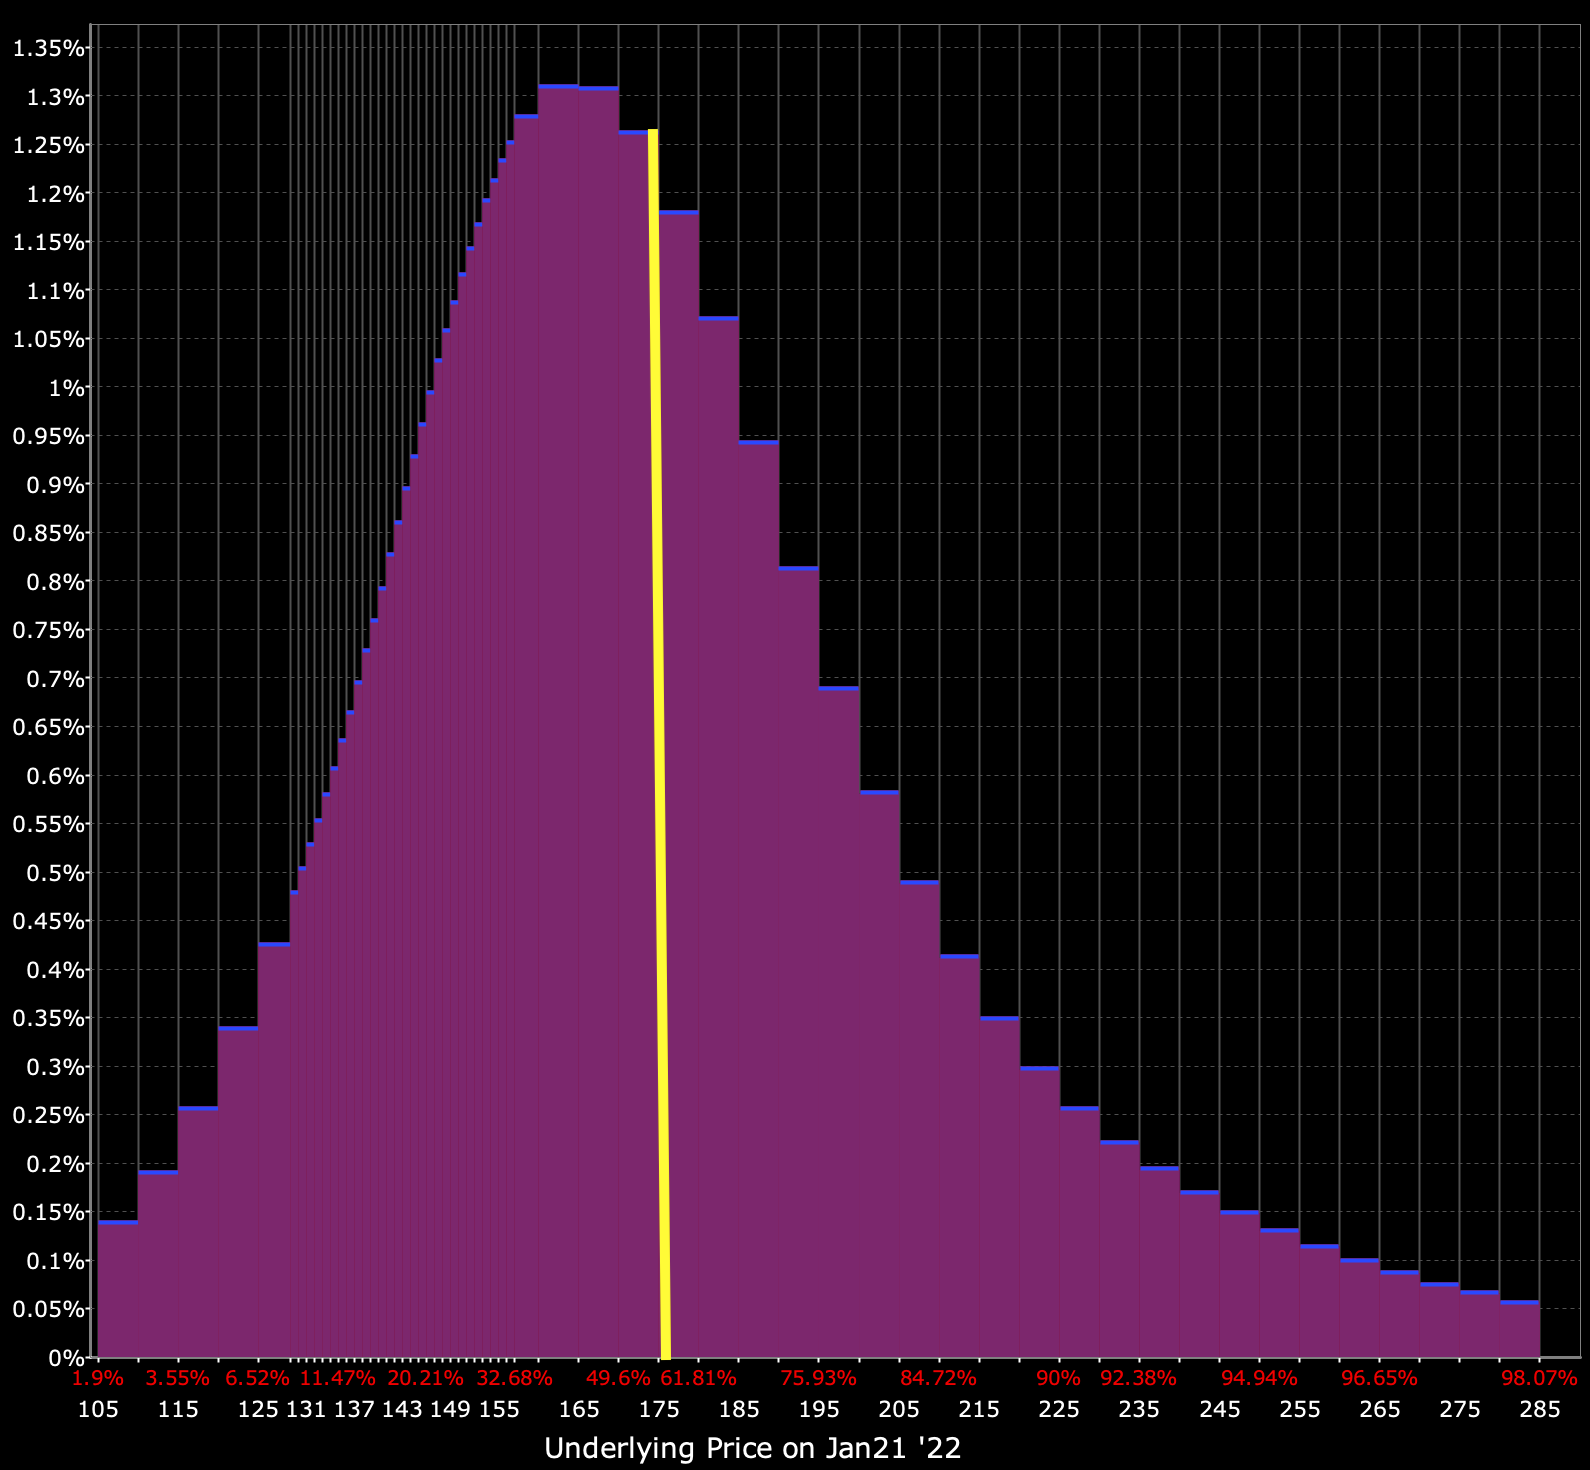
(Source: Interactive Brokers ‘Probability Lab’ feature)
You get a decent amount of options activity out on the right tail of the distribution.
But what if real rates increase next year?
Real rates are nominal interest rates minus inflation. We know that nominal rates are very likely to be anchored next year by central banks, so real rates are largely dependent on movements in inflation.
Despite the aggressive and coordinated monetary and fiscal policy that could push up inflation, we still have a huge number of deflationary influences:
- High debt relative to income (i.e., if debt has to be paid it moves capital away from spending on goods and services)
- Aging demographics (higher dependency ratios, increasing obligations relative to revenue)
- Offshoring production of various forms to more cost-efficient places, which is a drag on the wages of common labor
- Technological developments to increase economy-wide pricing transparency and reduce reliance on expensive labor
- A lower role for organized labor
- A lot of lost spending and income remaining from the pandemic, which could remain bad if it lingers, including confidence-related effects
With the deflationary forces being what they are combined with aggressive fiscal and monetary policy, the distribution in expected returns in inflation is very wide.
This means the volatility in real interest rates is higher than normal.
That presents risk for domestic bond buyers (who care about their real return) and also for investment assets that are highly dependent on the movements in real rates. Gold is one of them.
If inflation falls, real rates increase. Namely, your spending power is improved if prices don’t rise as fast.
If real rates increase, fiat stores of wealth look more attractive by comparison because their purchasing power increases over time.
This is why the gold price tends to rise as real rates decline. It’s not just correlation when matching the two on a graph, but a function of what motivations traders have when they want to own gold.
Gold vs. inverse of real interest rates (US 10-year)
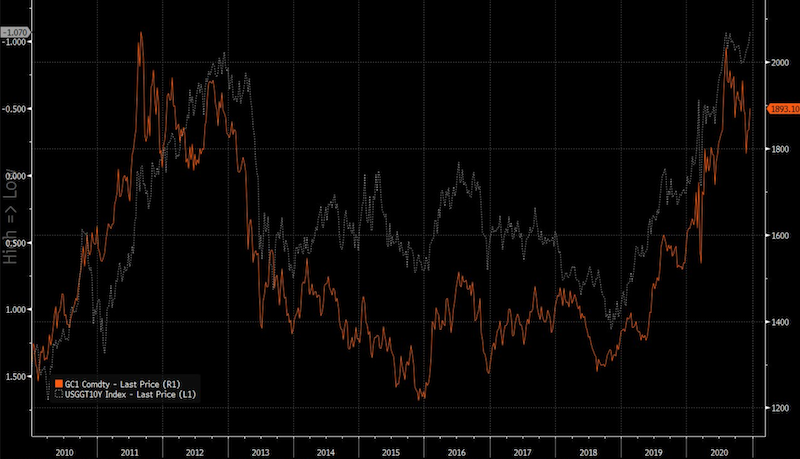
They don’t want their purchasing power to erode holding cash and bonds if it yields less than the rate of inflation, so they’re going to be less inclined to hold that. That forces flows into gold, stocks, and commodities.
And vice versa if real rates increase as inflation falls.
If the disinflationary trend continues with all the deflationary forces swamping the inflationary ones (notably money printing and debt monetization), you could get a rise in real rates and reduce demand for gold and other store of wealth commodities.
#3: Dollar Index above 100
This follows the same theme as above.
If real rates rise, you could get the dollar index back above 100, as it was briefly in March 2020.
This was caused due to a large reduction in global trade. Most global trade is done in USD, as the world’s top reserve currency. Without global trade, a big source of dollar liquidity dried up.
The lack of dollar supply drove the currency higher. This is why the dollar generally rises in a recession, at least temporarily.
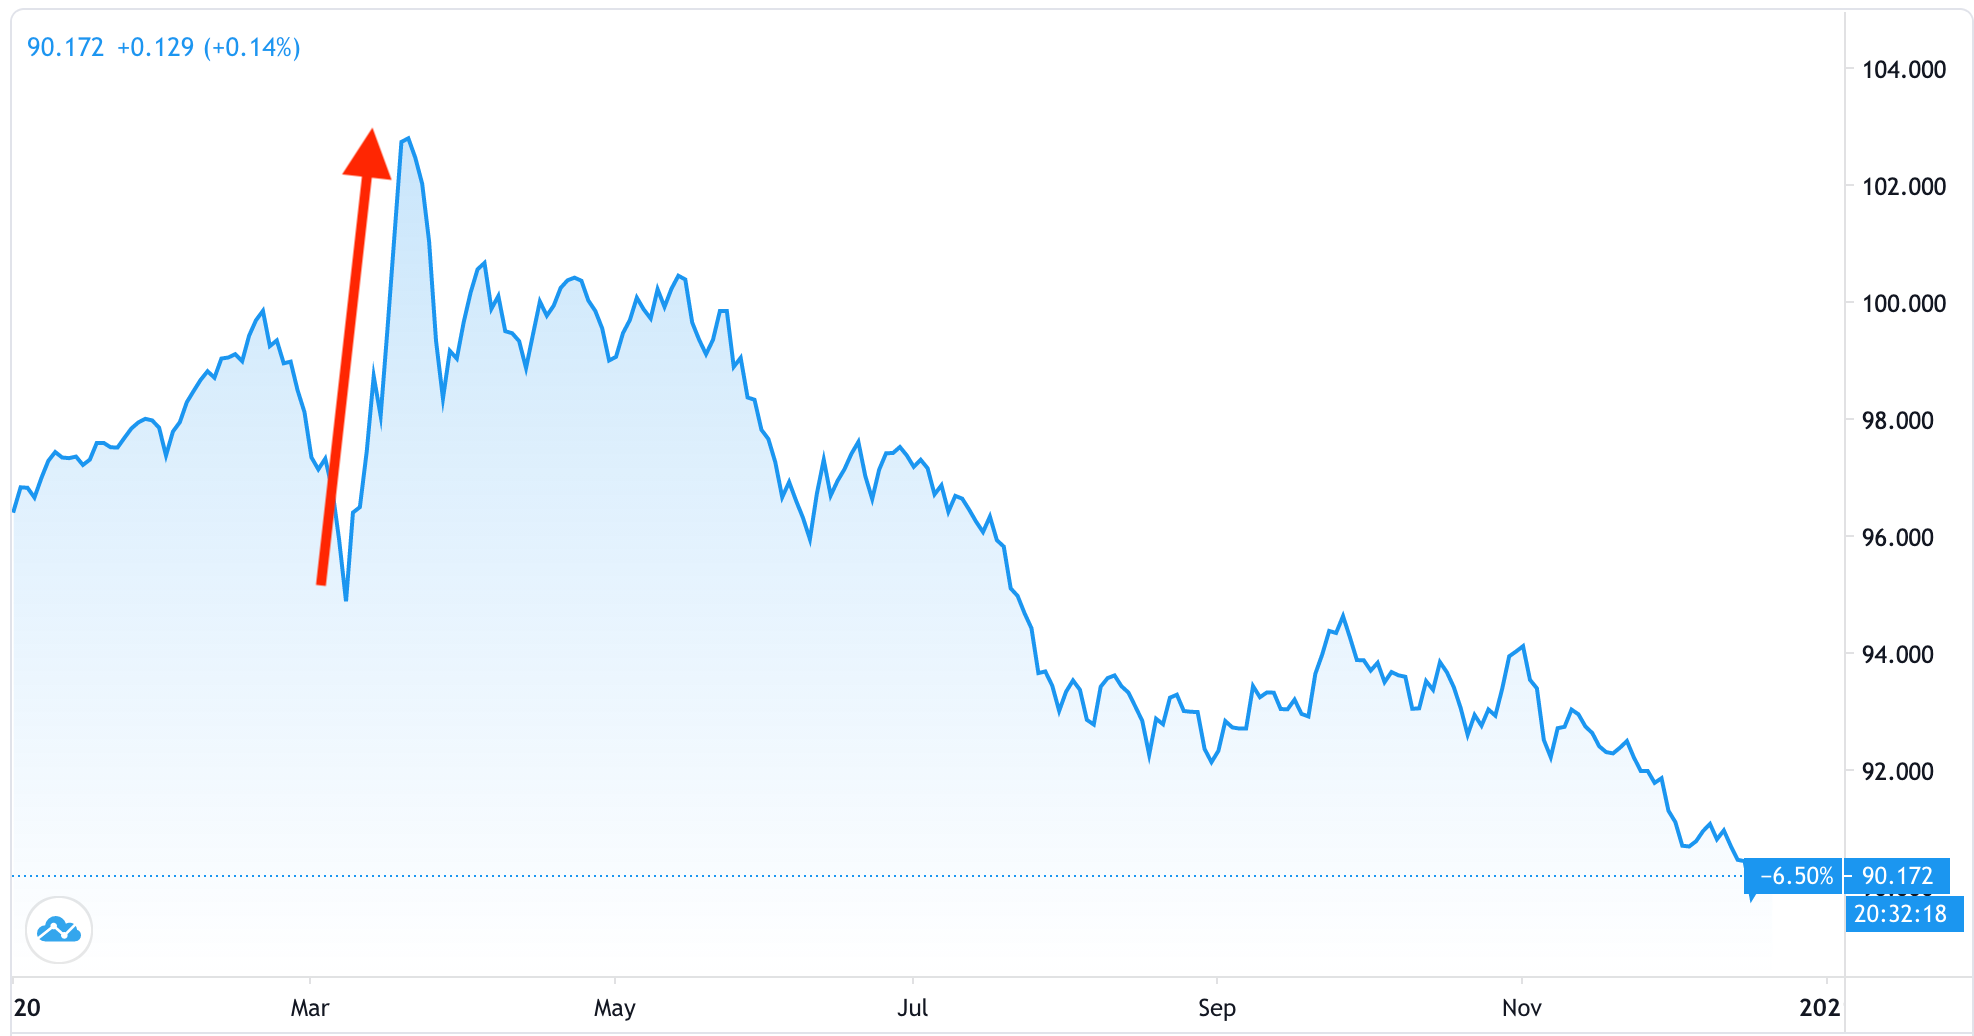
It faded once the Fed began “printing” and establishing swap lines with other central banks to get dollars to where they needed to go.
100 DX call options currently sell for around $190 each. A 15 percent rise in the dollar by expiration would generate around a 20x return.
A rise in the dollar can also be thought of as a risk-off hedge. A weaker dollar is generally good for a US trader’s portfolio in terms of the stimulatory impact on asset prices. Namely, the value of money falls in asset price terms and assets rise in money terms.
#4: Gold above $3,000
Now we have the opposite type of trade from the previous theme.
Rates are anchored at zero throughout the reserve currencies. And the fiscal and monetary policy unification that we see can help bring about inflation if that’s pushed hard enough.
One potential analogous period to now is the late-60s entering the 70s.
Inflation was low, rates were low, and fiscal deficits were high due to growing social programs and a war overseas.
Fiscal policy was loose and monetary policy went that way when the US unilaterally pulled out of the Bretton Woods system in August 1971. Back then, gold was money and USD could be exchanged for a fixed amount of the yellow metal at $35 per ounce.
Too many claims on gold relative to the amount available meant either the convertibility factor had to be changed (i.e., an amount greater than $35 per ounce) or the link had to be broken altogether.
The US government decided to break the link entirely and gold went on a huge run over the next decade, hitting nearly $700 per ounce by the end of 1979 (not adjusted for inflation), a return of nearly 20x.
Some see an analogous period in some way currently. They view ~$2,000 gold as cheap relative to the amount of money printing and currency debasement being done and what will need to be done.
The big difference between then and now is that we don’t have the fixed exchange rate regimes that we had back then.
We’re largely in a free-floating exchange rate world.
So, we shouldn’t expect to see big devaluations of the dollar or other major currencies like we saw in 1971, and in 1933 before that (which can be observed in the large drops in the blue line below; namely the value of the USD relative to gold).
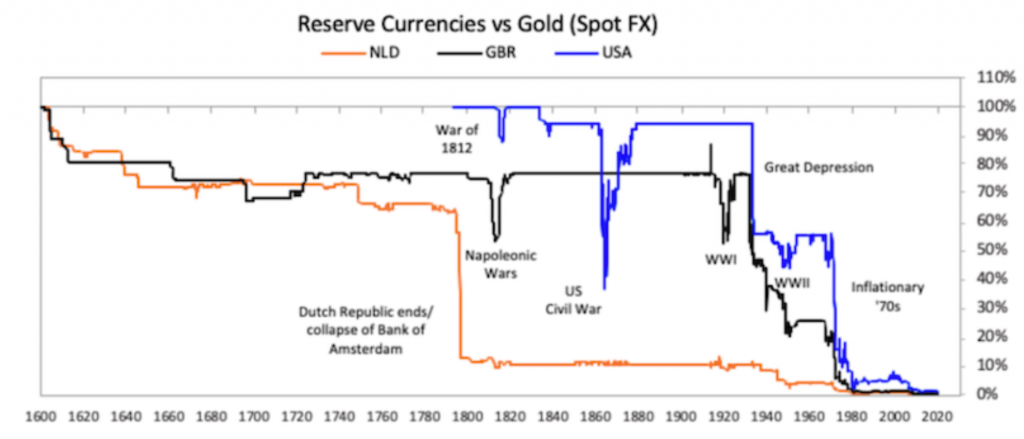
When central banks want to devalue their currencies to create relief from the pile of debt their countries have, that’s good for stocks, commodities, and gold. It’s not good for bonds and other nominal rate fiat flows.
Essentially, when the bubble is in the risk-free asset underpinning the entire financial system (e.g., US Treasuries in the US), the price of every other asset class will go up in conjunction.
That includes stocks, gold, commodities, and other equity assets (real estate, private equity).
Gold had 35 percent annualized returns in the 1970s as its price was artificially kept low in dollar terms. Under a free-floating system getting those types of returns is highly unlikely over any multi-year period.
Yet gold has various secular tailwinds behind it with all the money creation that will persist in all major markets.
Gold $3,000 calls (GC futures) are about $1,400 apiece as of publishing, or a breakeven price of $3,014 per ounce by expiration.
#5: Fed funds futures (ZQ) 99.75 Put
Almost nobody expects the Fed to hike interest rates even 25bps in 2021.
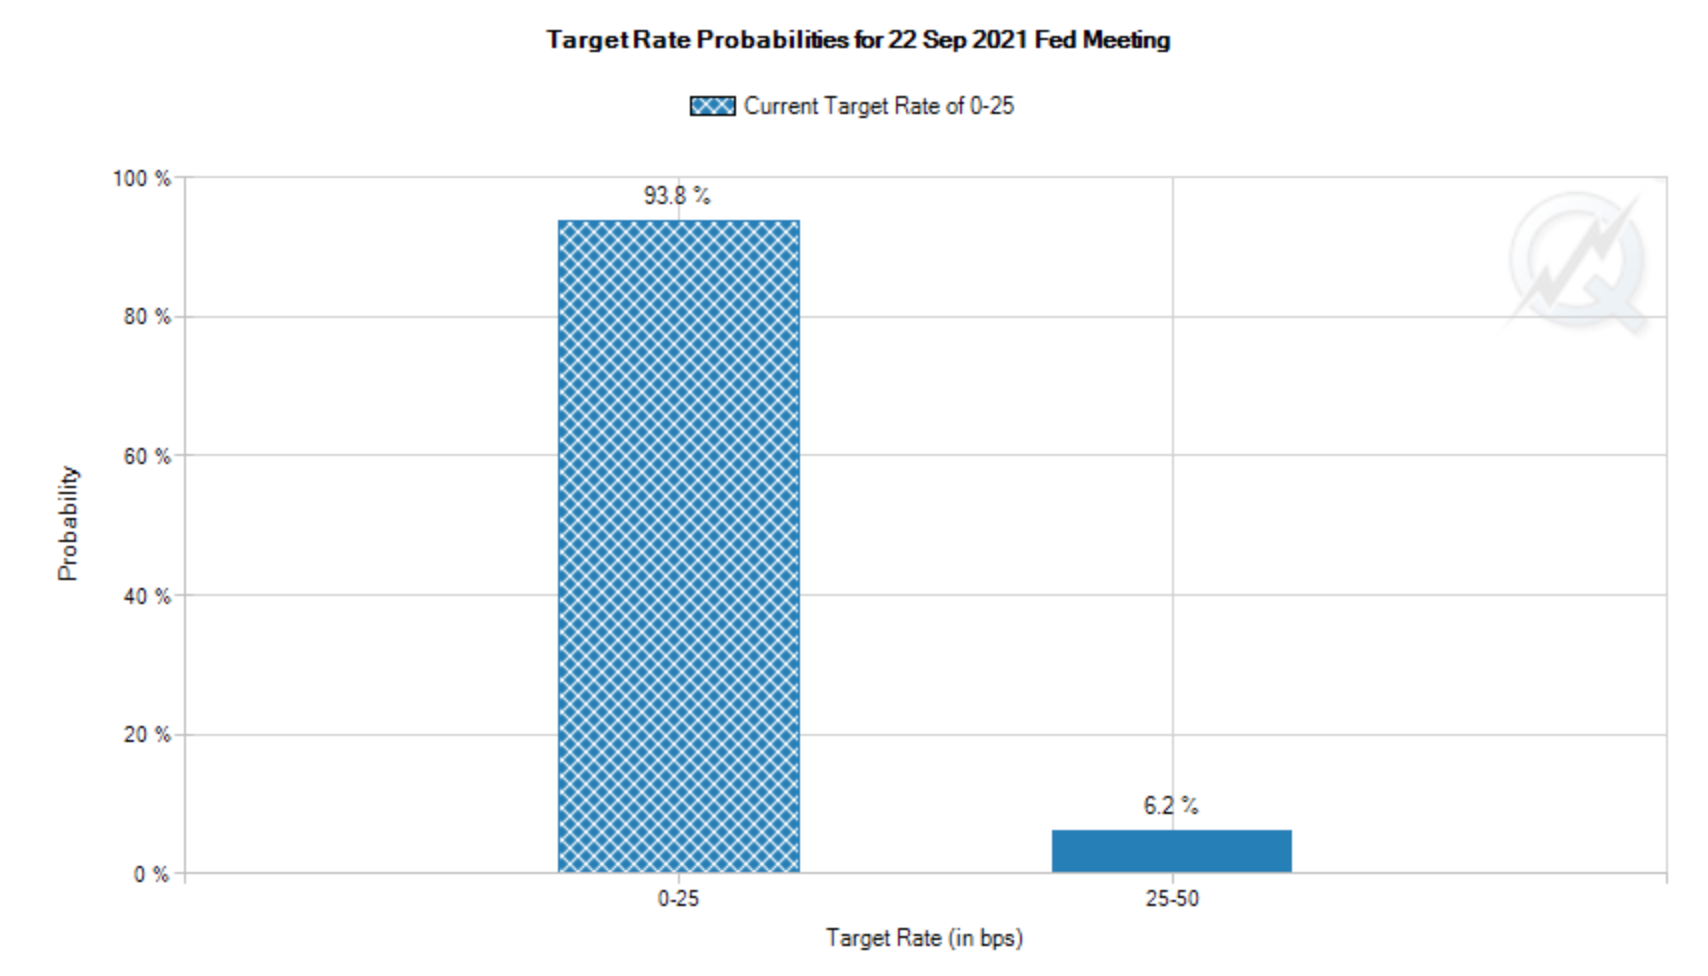
(Source: CME Group)
Even an unexpected uptick in inflation to (say) 4 percent might not be enough to hike even once during the year.
That said, it’s all about how it’s priced, not that it’s necessarily likely.
US front-end interest rates can be expressed through either fed funds futures (ZQ futures) or eurodollar futures (GE futures). (Traditionally, interest rate futures are institutional products, but Interactive Brokers offers them as well, for example.)
Eurodollars are priced as 100 minus the fed funds rate plus some credit risk, and expressed as a monthly average.
Fed funds futures are simply 100 minus the fed funds rate, averaged over the calendar month.
The Fed holds the fed funds rate within a 25-bp band. This is currently 0-25bps. A hike would put it in the 25-50bps range.
Following the formula, to bet on at least one rate hike, you know fed funds futures will be priced under 99.75 (100 – 0.25) should it transpire.
Currently, these 99.75 puts on fed funds futures are priced around $100 each.
That means if 2021 were to see one rate hike during the year, and the rate settled in the middle of the band (where the Fed prefers), fed funds futures would equal:
100 – 0.375 = 99.625
For a 99.75 put, it would be ITM by 0.125. At $4,167 per one-point move, the total value of the moneyness would equal:
$4,167 * 0.125 = $521
This would represent a payoff of a little over 5x given a $100 premium.
#6: Short China? Long USD/CNH 6.90 Call Option
The Chinese renminbi (also known as the yuan) appreciated against the USD in 2020. This is a secular expectation as Chinese incomes grow relative to US incomes.
Moreover, China can benefit from a stronger currency. It’s in its stage of development where it’s transitioning from an export economic model to a consumption-based economic model. This generally occurs when a country becomes wealthier.
A stronger currency means consumers’ money can go further, primarily by making imports cheaper.
The idea that China wants a weaker currency really hasn’t been true for more than a decade now. This was back when it was still focused on its export economic model as one of the world’s cheapest manufacturing hubs.
Typically countries move from subsistence lifestyles to selling value-additive goods to other countries.
Then, as they become wealthier they are more interested in selling services (and today increasingly digital technologies).
The incomes they derive from this higher productivity eventually flip into them becoming net importers with their stronger currency as a result of these higher capital flows chasing productive investment opportunities.
Today China will only weaken its currency in cases where there is a catalyst driving it higher in order to stabilize its value.
Stability in a currency provides credibility. The US dollar is traditionally the world’s least volatile national currency. When something is stable, its value as a store of wealth increases.
Friendlier terms with the US?
People expect Joe Biden to be easier on China than Donald Trump. Any easing up on trade restrictions would help Chinese incomes, boosting the renminbi relative to the dollar.
For example, let’s say there’s a rollback of 10 percent tariffs on $300 billion worth of goods.
That’s $30 billion, multiplying the two together in terms of the change in national accounting.
The US imports about $500 billion from China each year. Dividing the two amounts – $500 billion by $30 billion – that comes to a currency adjustment of around 6 percent in favor of the renminbi relative to the dollar.
Some of this is baked in.
But what if it doesn’t turn out like this and US-China relations don’t improve under the Biden administration?
Considering the various forms of competition and complaints the US have against China – e.g., intellectual property theft, forced technology transfer, government subsidies, market access, market competition, global spheres of influence, cyberespionage, and many others – these won’t go away if they’re being ignored.
A move back toward 6.90 on the USD/CNH (CNH is offshore renminbi that’s typically traded by foreigners; CNY is onshore) is not something that many are pricing in for a reason.
But US-China relations are naturally rocky as the latter is a growing superpower that’s coming up to challenge an existing one. These commonly end up in clashes on trade, capital, and become geopolitically charged in most other ways.
Of course, all of these issues would ideally be calmly resolved to the best extent possible. But clashes are inevitable when each country is vying to improve its circumstances in light of its own strengths and by exploiting the vulnerabilities of competitors.
#7: USD and EUR curve steepener
If nominal growth goes up, the long end of the yield curve is likely to go up unless central banks intervene to keep longer term yields low.
While higher growth is expected in 2021, higher rates to go along with it is not priced in along with it for this reason.
While there is such a thing as steepener trade structures, betting on this theme doesn’t have to be fancy.
Buying a ZB futures put is an easy way to bet on long-end bond prices falling and yields increasing.
A ZB 160 put currently goes for $875 apiece. A 10 percent drop in price in the middle to long end of the curve (i.e., that ZB represents) would increase the value of this contract by about 5x.
#8: A stronger or weaker EUR/USD?
When the world is in synchronized growth, the dollar generally falls. During a global slowdown the dollar generally rises, as people seek safety and liquidity in assets denominated in the world’s primary reserve currency.
If you’re long equities like most portfolios, being long EUR/USD is typically a correlated bet.
Selling a 1.30 EUR/USD put to fund buying a 1.15 EUR/USD call could work as a natural hedge against risk asset exposure.
European policymakers don’t want a euro that’s too strong and will increasingly want to intervene the higher it goes. (That’s not to say that there’s a “ceiling”.)
A stronger currency disadvantages countries in the European periphery, in particular, even if a stronger currency would be warranted in stronger eurozone economies like Germany.
A strong euro would be a drag on European asset prices, inflation (where deflation is still a risk in many parts of the bloc), and create social conflict in the region with greater resultant divergences in growth and economic outcomes.
#9: A (much) stronger stock market?
Higher growth and low rates give many an optimistic perspective on the stock market going forward.
When cash and bonds are stuck at about zero, and stocks typically have about a three percent risk premium over bonds, that means 3 percent forward yields for stocks isn’t out of the question. (They can yield even less if competing assets, in turn, yield less as well.)
If earnings on the S&P 500 get back close to Q4 2019 levels (about 170) and stocks are priced to yield about 3 percent over safe bonds, the inverse of that is the earnings multiple (about 33x).
170 multiplied by 33 is 5,610 on the S&P 500, which would mean upside of more than 50 percent from current levels.
5,000 calls on SPY (the most liquid S&P 500 ETF) out about one year are trading at around $0.90 per share. If the S&P reached 5,600 by expiration, that’s a $60 per share profit, or around a 66x return.
#10: Hedge against a stock market drop for free?
As of publication, a 350 SPY put option costs twice as much as a 300 SPY put.
If you buy one 350 SPY put and sell two 300 SPY puts, you have a structure you are protected from any fall in the S&P 500 from 3,500 to 3,000.
After that, one of the 300 puts covers the 350 put. Your upside is now capped.
What the second 300 put effectively does is mandate that you buy the S&P 500 at 3,000 (300 in terms of the S&P 500 ETF, SPY).
Your payoff diagram looks like this:
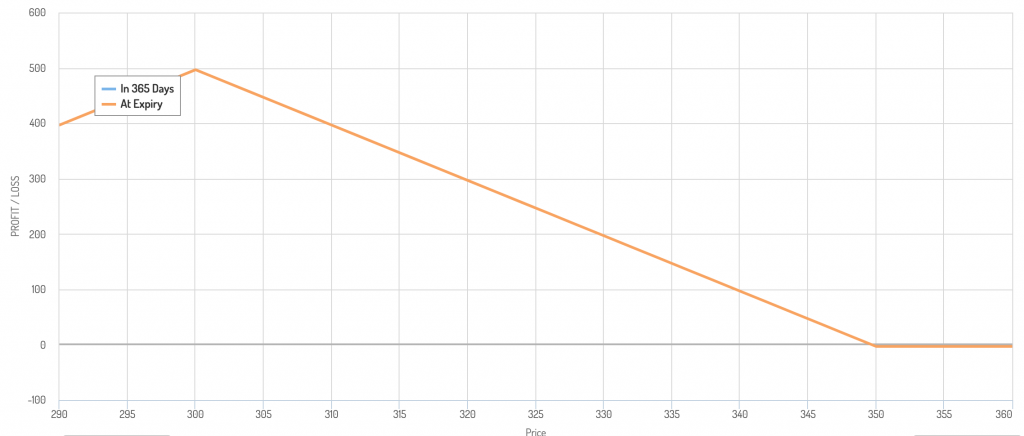
This shows that if the S&P 500 stays above your strike price, you don’t make or lose anything. The value of your hedge maxes out at 3,000 on the S&P (300 on SPY).
After that (i.e., S&P 500 falling under 3,000), the value of your hedge declines because you are obligated to buy SPY at 300. You are effectively long the asset at that point and any drop under will accrue losses.
This accomplishes two things:
i) Hedges existing risk asset exposure in your portfolio, or express a bearish opinion up to a point, at which you’d agree to buy the index.
ii) Enables you to buy the market at a potential discount.
If this is an appropriate trade structure (and how much of it to have) is obviously up to each individual trader.
But it acts as a “free” hedge up to a point while enabling you to buy the market when it “goes on sale” (about 20 percent cheaper as this is being written).
A trader will have to ask whether it’s in their interest to have that liability open if the market were to fall under 3,000, especially if they’re already quite long risk assets in their existing allocation.
If, for risk management purposes, the second 300 SPY put (short) was not in their interest, it could be kept as a basic bear spread. This would mean being long the 350 put and short the 300 put.
This would act as a hedge on a fall in the index while also limiting the cost of it.
#11: Zero percent US 10-Year?
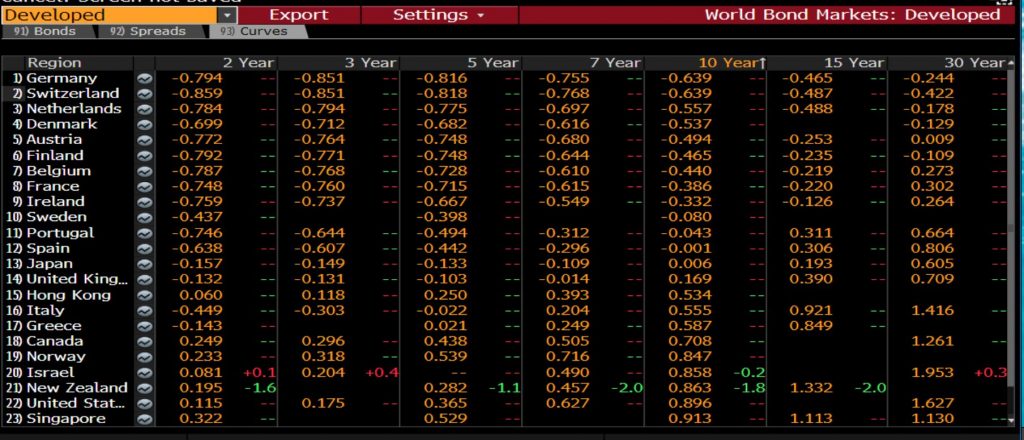
Twelve countries have negative 10-year yields. Japan pegs its 10-year right around zero as part of its yield curve control (YCC) program. The UK is near the zero yield mark as well.
Many countries have negative 30-year yields, in addition. This essentially puts their entire (or nearly their entire) yield curve at negative yields. The government gets paid to borrow and buyers of their bonds effectively have to pay to own them while bearing inflation risk.
The US 10-year is hovering in the 50-100bp range in the post-Covid crash period.
But all it would take to get the yield below 50bps and toward zero is another major risk-off event that will get people seeking safety and liquidity again.
Betting on lower rates is not a popular trade given a “normalization” consensus with effective vaccines and the economic catch-up that needs to be done post-pandemic.
This provides an opportunity for anyone who wants to bet on it in a low-risk way.
Traders can usually bet on US Treasury futures options up to six months out.
Betting on a US 10-year heading below 50bps could mean taking a flyer on 185 ZB futures calls.
(ZB is the NYMEX symbol for the “30-year” bond. But the actual maturity equivalent of ZB futures, based on “cheapest to deliver” (CTD) standards, is typically in the 16-17 year range.)
Betting on lower US yields in a cheap, convex way can also act as a natural hedge against one’s risk asset allocation.
Conclusion
In this article, we’ve taken a look at some cheap tail trades for the upcoming year with some argumentation behind them.
These are not necessarily chosen to be in line with forecasts. The idea is for them to be out-of-consensus picks that would fall in the tail of expected returns distributions.
They are fairly attractively priced either a) compared to a potential logical outcome and/or b) based on judgment of the potential distribution of outcomes.