How to Short Sell and Be Neutral on Short-Term Direction


Let’s say there’s a company whose fundamental valuation doesn’t support itself and likely will never support itself. In that case, you might want to short sell (“short”) the company’s stock.
However, given the “markets can remain irrational longer than you can stay solvent” this can be a painful process.
Stocks are the most popular asset class among the public, and the highest yielding over time.
In terms of the natural market equilibriums over time, equities must yield more than bonds and bonds must yield more than cash, and by the appropriate risk premiums.
But given the cash flows of equities are theoretically perpetual, their duration is longer than that of other assets.
The higher the duration, the greater the structural volatility of the asset.
Equities can remain too high or too low for long periods because of distorted perceptions of value. There’s also the momentum element.
One of the most common mistakes is that traders think that assets that have recently done well are good investments rather than more expensive, and that assets that have recently done poorly are bad investments rather than cheaper.
But every day’s price is simply a function of buying and selling. More important is the quantities of each that are bought and sold and the motivations of the buyers and sellers.
This is more effective at understanding what’s going on than the theoretical notion of what the equilibrium value should be.
Hertz (HTZ), a rental car company, filed for bankruptcy on May 26, 2020. Yet its stock price continued to go up by a factor of more than 10x in less than two weeks.
Based on equilibrium value, its equity was junior to $14 billion in vehicle debt and $6 billion in corporate debt. (In other words, the bondholders get paid first in any bankruptcy scenario, which Hertz has filed for.) Its net income was negative so paying those obligations off to provide a residual claim to ownership (i.e., stockholders) wasn’t very likely at all without a restructuring of the company.
While Hertz (HTZ) might be fundamentally worthless, people were still bidding up the stock price for no other reason than pure speculation. Holders of Hertz are not large institutional investors that tend to buy and hold over long periods. Hertz’s market cap is less than $300 million, which is too small for the big institutional investors to bother with. They’ve primarily fled, leaving mostly smaller institutions and retail investors.
Short sellers are not wrong in their analysis of what the stock is worth (nothing). But it’s part of the territory of investing in a highly speculative security. Borrowing costs went way up (to an interest rate of about 100 percent) and what should be happening isn’t lined up with what is happening. Even if your fundamental interpretation is correct, it still technically amounts to being wrong when the security flies in the other direction.
How to Short Sell While Remaining Agnostic Near-Term
There is a way you can remain agnostic about the short-term or even medium-term price if you have a fundamental (or simply longer-term) conviction on a security that it’s overpriced.
General strategy
a) Short the underlying instrument
b) Short at-the-money (ATM) or slightly out-of-the-money (OTM) put options on the instrument
c) Go long OTM to deep OTM call options on the instrument
Example #1
Let’s say you believe Tesla (TSLA) is overvalued. At the same time, you are neutral on its short-term price movement.
To express a bearish bias, you would short the stock following the template above. Because options contracts come with 100 shares per contract, we need to short the stock in some type of volume to make this work.
If you are shorting options (i.e., selling volatility) and not covered, that can put you in a dangerous situation. The upside on selling options is the premium you receive from the contract.
The most you can lose on selling uncovered call options is infinity. In other words, a stock has no theoretical constraint on its upside.
The most you can lose on selling uncovered put options is limited to the price of the stock per share multiplied by 100 multiplied by the number of contracts sold short minus your premium.
If a stock is $40, you sold 10 put option contracts for $3.00 per share ($300 per contract when multiplying by 100, and $3,000 total when multiplying by the number of contracts), the most you can lose is $37,000 if the stock went to zero:
Loss = $40 per share * 100 shares per contract * 10 contracts – $3,000 = $40k – $3k = $37k
For other instruments, zero is not your lower bound on price. (For example, see oil.)
Example: Tesla short
__
Step one
Let’s say you wanted to short 500 shares. Tesla’s price as this is being written is about $987 per share. That would be a total cost of $493,500. (You can also do this with 100 shares, but you’d be limited to just one options contract.)
__
Step two
Short short-term ATM/OTM puts.
If we look at the weeklies at the end of the next week we have the following to potentially choose from:
Weekly put prices
950 put = $2,000 per contract
900 put = $900 per contract
850 put = $400 per contract
800 put = $200 per contract
750 put = $120 per contract
We’ll short one of each.
Total premium: $3,620 per week (about 0.7 percent of the total equity position)
We could, for example, get more premium by getting rid of the low-premium 800 and 750 puts, and short three 850s. This would raise the premium to $4,100.
At the same time, having a bearish bias, this would also limit any gains if the stock did indeed decline. In the above example, we’d bear some upside down to the $750 price point rather than just the $850 price point.
It also depends on the level you feel is good risk/reward to exit the trade. Some use covered call or covered put option structures as a take-profit type of mechanism. The risk/reward on shorting options is traditionally best when implied volatility is too high relative to likely realized volatility.
Derivatives are nonetheless highly versatile instruments that are used for a variety of reasons, such as for prudent risk management purposes, speculation, limited-risk trade strategies, and so on.
__
Step three
It’s also very important to protect against losses. This is a volatile stock and moving 10 percent or more in a week is relatively common.
At the same time, we don’t want to pay a ton for insurance and we want it to last. Longer-duration options are generally more economical taking into account the time element.
If you stick with the position over time and buy weekly insurance, it’s generally going to be relatively cheap if it’s reasonably out of the money. But you have to pay that 52 times per year. That can add up.
If you buy 1500 calls one year out, that’s about $12,500 per contract, or $62,500 for the entire position. That’s 12.7 percent of the total position and protects completely against a 52 percent upside move.
That means you could lose up to $256,500 on the position, plus the $62,500 for the call options premium for a total of $319k in potential loss, or about 65 percent of the total position.
That sounds bad relative to the size of your short position. But on the other side of the ledger, you have the weekly puts generating you revenue and the upside on the stock potentially falling.
If you are getting about $3,600 per week in income from the short puts, that would add up to around $187k per year in revenue. Some weeks the stock is likely to fall, cover part or all of your position and you’d have to re-establish the short again. The upside on the stock falling would be dependent on how you manage your put options over time.
In the example above, you’d average about a 14 percent gain on the stock if it fell beyond your lowest expiry (i.e., effectively covering your entire position), or about a $69k gain on the stock’s movement.
Payoff Diagram
Options payoff diagrams show profit/loss possibilities. But they do not show the associated probabilities of each possibility. For that reason, they don’t give an accurate picture about the actual expected value of any given trade structure.
Nonetheless, they do show a set of possibilities even if the linear aspect of the diagram is misleading when the outcome set would best be modeled as a distribution. They also show how good and bad things can get from a profit/loss perspective.
Showing payoffs is difficult when there’s a maturity mismatch. In our example, we’re using short-term put options for one side of the options trade and longer maturities for the other side.
Our diagram out over the next seven days looks like the following:
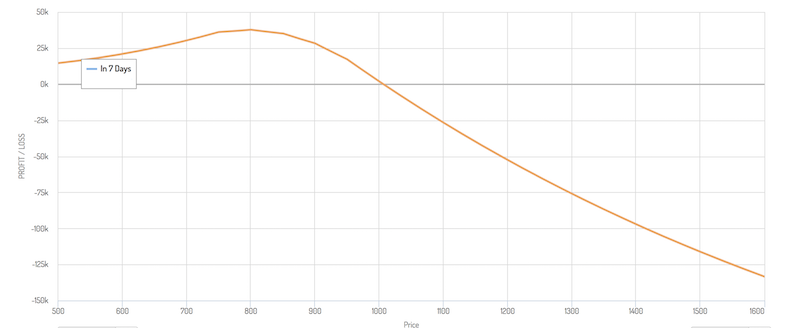
(Source: optioncreator.com)
You can see that profitability would cap out around the $800 price mark on the stock (about a 19 percent drop).
Then it would actually dip from there on out because:
a) the stock is almost fully covered (officially at the 750 strike), and
b) the loss in value of the call options, getting further away from the 1500 strike, starts to reduce profit
Keeping the maturity constant
The duration mismatch in the options strategy adds a layer of complexity and necessitates more active management of the trade.
We can also do the same keeping the maturities constant.
Let’s say now you’re short the common stock, and you’re short put options and long call options all of the same strike prices one year out.
Now we have the following prices on the put options:
950 put = $23,390 per contract
900 put = $20,460 per contract
850 put = $17,700 per contract
800 put = $15,100 per contract
750 put = $12,690 per contract
Total premium: $89,340 per year (about 18.1 percent of total equity position of $493,500)
The call option position is the same – buying 1500 calls one year out, roughly $12,500 per contract, or $62,500 for the entire position. That’s 12.7 percent of the total position and would protect against a 52 percent upside move.
The puts are closer to ITM than the calls, so we get more in premium from the puts than we do from the calls.
Puts also tend to be more in demand than calls and have higher premiums (though this isn’t always true). This is called volatility skew. This is associated with the fact that investors are naturally bullish on the stock market as prosperity is expected to rise over time. This means there is relatively more demand for put options to protect wealth than their is for call options.
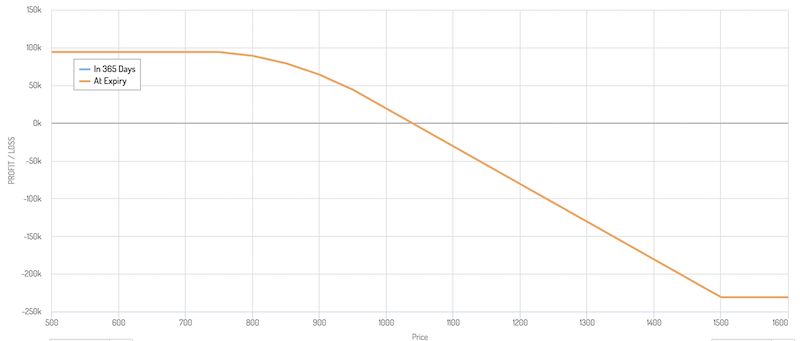
Here’s our payoff diagram when keeping the maturity at one year out on all options contracts:
Advantages
We have a few advantages with this trade structure:
a) We can make money on this trade even if it goes against us. We make money on put options, which can help offset capital losses to a point. In this case, the breakeven point is $1,035, or a 5 percent upward move.
b) We can make money if the stock price declines, with a maximum profit of about $94k. This comes to a 19 percent gain.
If price didn’t go anywhere for the year, the profit would be about $25k (about 5 percent)
c) Risk is capped. The trade can’t lose more than about $230k (about 46.5 percent). That sounds bad, but the nature of having a short book is that your risk on vanilla short bets has infinite downside. Sometimes you want to protect against that.
If price rises from $25 to $500 on a stock you were short, that’s a loss of 20x or 2,000 percent of your original position. If that short position was just one percent of your account, that small short position has now ballooned to 20 percent of your account, and puts your account down by that amount as well.
Because of this “risk of ruin” element, some investors never short, not wanting the potential downside. If you’re long, stocks can only go down to zero. Some investors view it differently and are just as willing to go short as long to avoid the systematic biases that can lead to large drawdowns (e.g., 2008, 2020).
d) You get to be short, but with more limited risk and less sensitivity to price movements.
Disadvantages
We have a few disadvantages with this setup:
a) You have limited upside. If you’re right you make around 19 percent.
b) Options spreads are wider than the spreads on equities and other liquid asset classes, which increases transactions costs.
c) These trades are more complicated and require more active management. Options trades that have maturity mismatches are more complex and can be harder to manage than those that match maturities.
All trades have pros and cons associated with them. Overall, the best trading and investing decisions will be those with more pros than cons, not those that don’t have any cons at all. Some trades that can make great sense for some investors will not make sense for others.
Conclusion
Options offer a variety of advantages. For example, they allow for strategic alternatives, the ability to limit risk, enhance yield, and the potential to deliver higher percentage gains on your investment.
Instead of having pure linear positions by buying or short selling the underlying instrument, options can provide the ability to more specifically express what you’re trying to do strategically. They can be employed in a variety of different ways. But they can also be dangerous if not traded prudently.
In this case, we provided an example trade structure that could be employed in scenarios where you want to short sell a security while also limiting your risk and staying neutral to semi-neutral on its near-term to medium-term price movement.