How to Trade a Late-Cycle Economy


A late-cycle economy is characterized by higher inflation, low unemployment, speculation, and eventually rising market volatility.
Late-cycle economies have different market behavior than in other parts of the cycle.
The labor market follows the business cycle – usually with a lag. And central bankers, who have the biggest lever on liquidity in an economy (in addition to fiscal policymakers), use it as part of their reaction function.
So it’s a key factor for traders and investors looking at making tactical moves.
So, as a trader, if you can recognize when the late cycle is occurring you can make decisions that can improve your trading results.
Basic overview
When there is lots of labor market slack – also known as high unemployment – policymakers will have big incentives to get everything going again.
This characterizes an early-stage economy.
So they will stimulate the economy with lower interest rates and typically alongside with other monetary and fiscal easing measures.
Fiscally, it could mean big spending bills that increase deficits. Monetarily, it could mean alongside programs like QE, which is a type of asset buying.
All this stimulation generally produces a strong period for asset prices, especially risk asset prices.
Within the stock market, tech and longer-duration forms of equities will tend to outperform safer, defensive flavors like consumer staples and utilities.
The economy is still weak late in a recession and the early stages of the expansion. However, the stock market is typically back in a bull market.
The financial economy leads the real economy.
Once you get to the late cycle and there’s little labor market slack, then policymakers will begin to remove stimulus to avoid excessive inflationary pressure.
They not only begin to fear inflation but also financial instability, such as that associated with asset bubbles and too much credit creation. Another concern, though less frequently, is the way all that stimulation can devalue money and credit and create unsustainably large deficits.
So excessive currency devaluation can be a concern. It’s often been a concern throughout history. If you look through 500 years of financial history, we see it over and over again, though it occurs infrequently over the course of a lifetime.
So they begin to take away policy support to rein in inflation, bubbles, and currency weakness. Anywhere from 1-3 of those can be an issue.
Bubbles can be an issue because most people are in good shape financially. And markets are in good shape. So they become more confident in putting their money to work.
Some even become euphoric and believe an asset class rising in price quickly is becoming a better investment rather than a more expensive one.
As the saying goes: “They look cheaper as they go up and look more expensive as they go down.”
And while we’re on the topic of market cliches, when there’s “blood in the streets” it can be intimidating to buy because of the often extreme volatility and fact that assets have just gone down a lot.
This contributes to the psychology of buying high and selling low that plagues many in the markets.
So while the real economy tends to be quite good during the late cycle, it starts to be a bumpier period for stocks and other risk assets.
Eventually, policymakers will go too far in tightening financial conditions because it’s hard to get the balance right between inflation and output. Those trade-offs tend to be more acute the longer the cycle goes on.
It can also depend on a country’s balance of payments situation.
When capital is flowing into the country on net, this trade-off becomes easier to manage.
When there’s a balance of payments deficit, the trade-off becomes increasingly hard to manage as less growth is achieved per each unit of inflation.
When policymakers tighten too far, there’s a drop in the stock market followed by a fall in the real economy.
This is the sequence because it’s the financial economy that provides the money and credit that go into real goods and services output.
When there’s a drop in financial wealth, this eventually feeds through into the real economy with a lag.
Falling output means there’s less work to do. Less work to do means the labor supply has to be cut back, so you get more unemployment.
This reverses when interest rates are cut and/or other monetary and fiscal easing measures are added to rectify the imbalance to stimulate the economy, which stimulates hiring.
So, from this dynamic, low (cheap) stocks mean lots of labor market slack and high (expensive) stocks mean low levels of labor market slack.
Accordingly, we can say that labor market health is a type of contra-indicator on when it’s best to buy stocks.
So, when there’s high unemployment you can typically feel pretty good about the forward direction of stocks assuming policymakers are skilled and have the necessary power to make the moves required to provide support to the economy.
On the flip side, when there’s low unemployment, it’s a better idea be more cautious about stocks as policymakers begin withdrawing support.
During late-cycle economies, traders and investors are likely to rotate away from tech and longer duration forms of equities to safer varieties like consumer staples, utilities, and some forms of healthcare.
Graphically
If we look at previous business cycles in the US, each instance the U-3 unemployment rate gets down to around 4 percent, the forward returns of stocks have suffered.
And US business cycles tend to be coordinated with those of other countries.
In the chart below, we have lines that mark roughly the point at which U-3 unemployment fell to about 4 percent.
This is when policymakers become more concerned about inflationary pressure.
Demand for labor is a big part of the inflation equation. When the demand for something exceeds its supply, it causes the price to go up.
Higher wages are great when they reflect productivity gains. However, when they’re not, then these gains transmit to prices for goods and services and produce more inflation, which can become too onerous past a point.
How to trade a late-cycle economy
Step one is that you want to have a balanced portfolio.
You can reduce your risks without reducing your returns if you have the appropriate balance, so it’s a process strongly worth considering.
We have separate articles on this topic, so we won’t delve into it too much here.
- How to Build A Balanced Portfolio
- Balanced Beta: How to Efficiently Balance Risk, Not Capital
- How to Build A Balanced Portfolio with Options
Wealth isn’t destroyed so much as it moves around.
When an asset class falls in value, that doesn’t mean the money just disappeared. Very little of it was actually destroyed (i.e., credit destruction, where one party reneges on a promise to its creditor).
It just shifted somewhere else.
So if you’re balanced well, you’ll efficiently capture risk premiums in the market while avoiding significant drawdowns.
So having a balanced allocation between…
- different assets
- different asset classes
- different countries
- different currencies
- different financial and non-financial stores of value…
…is a good starting point.
That’s your first layer of convexity (improving returns relative to risk).
The second layer is trade structuring.
This article is dedicated to trading a late-cycle economy, so that’s what we’ll focus on here.
Example of a Late-Cycle Trade Structure
This trade structure applies to risk asset markets.
In a late-cycle economy, stocks are riskier as policymakers start to withdraw support.
And sometimes they’ll do it faster than what’s discounted into market pricing. So if you’re long, you’ll lose money during these episodes.
But by structuring your trades differently, you don’t necessarily have to lose money during these times.
The basic strategy
The basic idea is to eliminate – or at least severely mitigate – your left-tail risk and position yourself for more mild gains.
There’s always risk, so it doesn’t go away. It’s just transferred elsewhere.
By using options, you can capture the distribution of anything you like.
So if you don’t want left-tail risk and you want your maximum profitability to be in scenarios where gains are mild (to mirror the risk/reward characteristics of a late-cycle economy), then your risk is going to be concentrated on a big move higher in the market.
We’ll also cover how to mitigate this risk.
The setup
Here’s an example basic setup. This is geared toward more of a weekly trade:
- Short 2 units of the underlying
- Long 1 unit of a 1% OTM put
- Short 3 units of a 1% ITM put
- Long 2 units of a 1% OTM call
- Short 4 units of a 1%-2% OTM call
- Long 3-4 units of a 2% OTM call
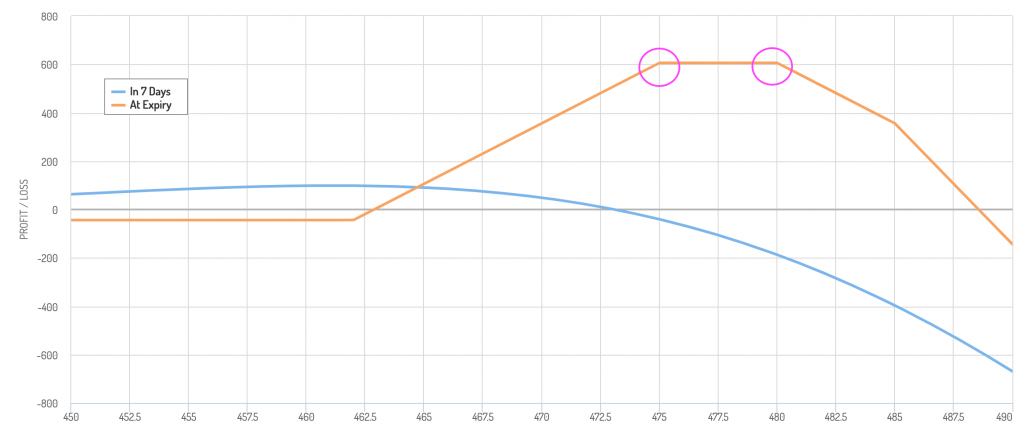
This is what it looks like plotted out on an options diagram (if you’re long 4 units of the last part). The pink line is where price is currently.
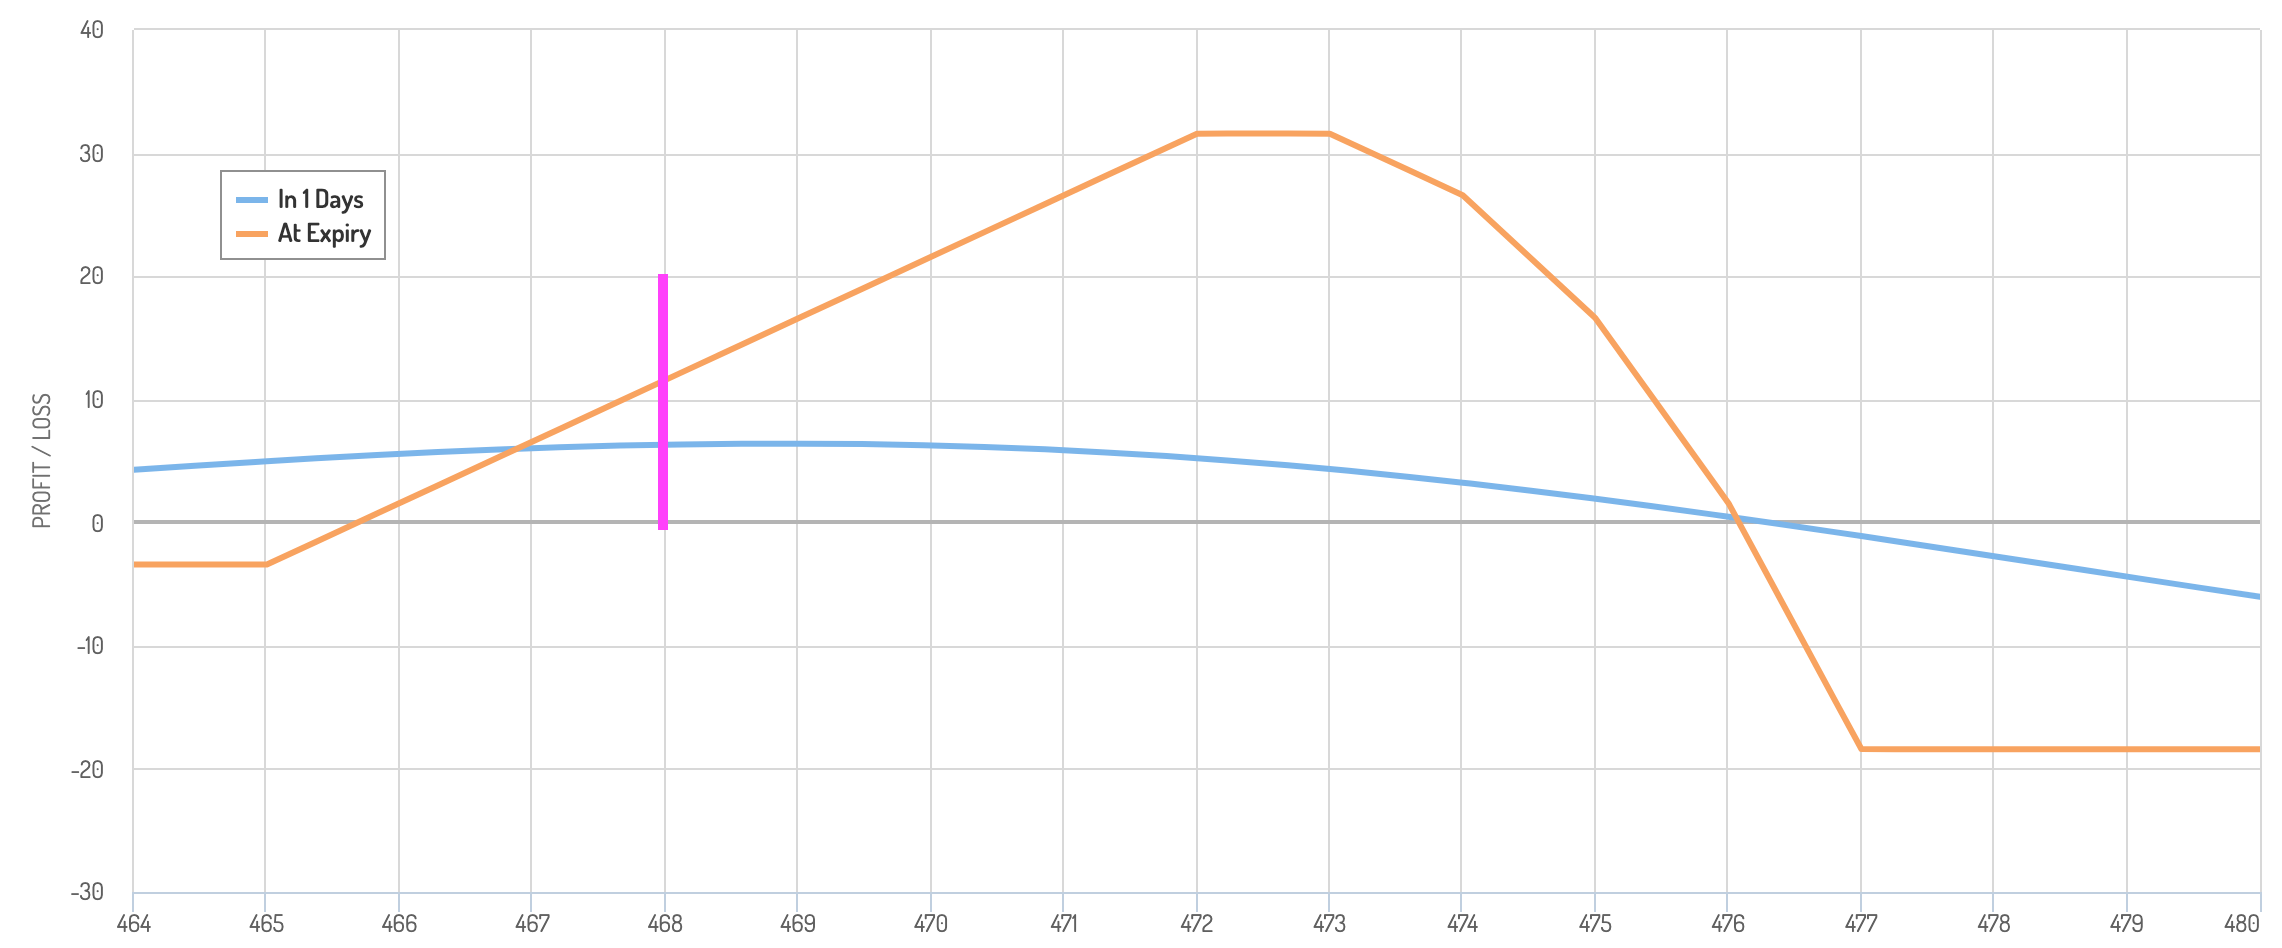
The blue line is an estimation of your P/L over the short run.
Here you can see that your left-tail risk is small. So if the market goes down a bit or a lot, you don’t lose much.
It’s also what you call a “closed” structure.
What’s a closed structure?
It’s a trade structure that doesn’t leave open any downside tails.
In other words, if you were to wake up the next morning and the market moved 10 percent either way, that would be very bad if you had on what’s essentially a short volatility position with open tails.
This type of move would basically be ruinous if you didn’t have any hedges on your tails.
If you’re long options on both your left-side and right-side tails, then you don’t have anything to worry about.
There is cost involved in hedging out your tail risk.
But it’s also relatively cheap and can save you a lot of money in case you do get a big move. And big moves are more common and likely than they otherwise seem. It’s only going to cost you a little bit, so you might as well do it.
Going back to our example, if you only go long 3 units of the OTM call, your structure looks like this:
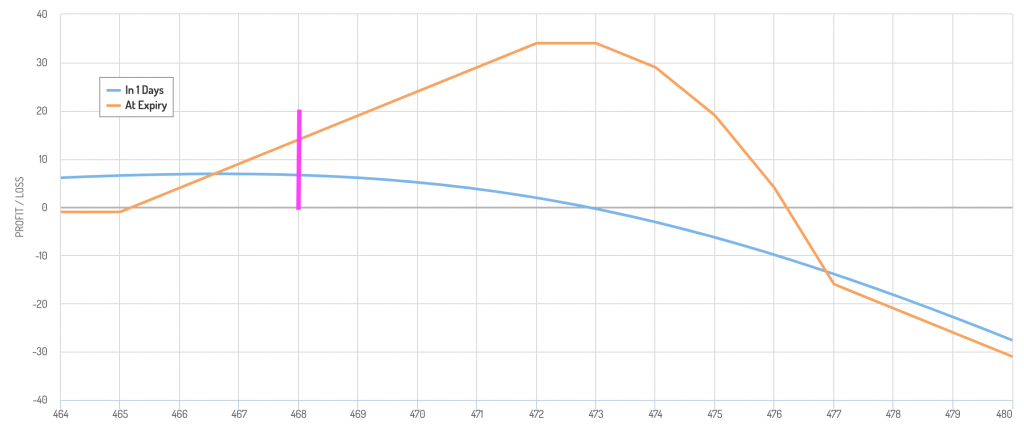
You have more risk if price increases a lot, but it can save you money by not doing the extra hedging. You have even less potential left-tail loss.
Everything’s about trade-offs.
There are also ways to manage the scenarios that can transpire when price does increase a lot.
How do you do this?
How to hedge your right tail
You have a few things you can do:
- Dynamically hedge (buy the underlying when price hits certain levels)
- Buy short-term options
- Buy options with the same maturities as the ones you’re short
Dynamic hedging
Dynamic hedging means you buy the underlying asset at points on your diagram when you would begin to lose money, thinking in terms of P/L at expiration (which is what an options payoff diagram looks like).
What’s good in the long-term (your orange line, representing the payoff diagram) isn’t necessarily the best in the short-term (your blue line).
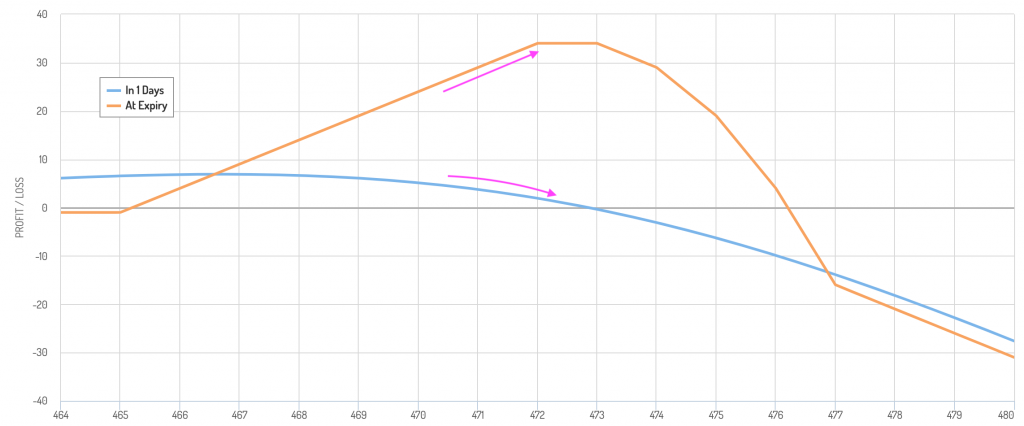
Traders often use options payoff diagrams to gauge how their P/L should go.
For example, if you start on the left side of the graph and price goes up and you move further on the right side of the graph, you might think you should be making money.
But your P/L can actually go down because the calls you’re short are increasing in value (bad for you) faster than your other stuff is benefiting your P/L.
Short-term options
To hedge this risk, you can buy shorter-term options.
For example, for products like e-mini S&P 500 futures (ES) or SPY, you have Monday, Wednesday, and Friday expiries.
So if the options you’re short expire at the end of next week (Friday), you can do your hedging with the Monday or Wednesday expiry. They’re cheaper.
Then you can let the market break wherever it goes and make tactical adjustments as needed.
Match option maturities throughout the trade structure
Or you can just buy options with the same maturities. This is safest. But they’re the most expensive so it can also eat into your potential gains.
Can you do this for monthly or quarterly expiries?
Yes, you can do it for any length of time.
Here’s an example of a monthly trade.
- Short 1 unit of the underlying
- Short 2 units of 3%-4% ITM puts
- Long 2 units of 3%-4% OTM calls
- Short 1 unit of 1%-2% OTM calls
- Short 1 unit of 2%-3% OTM calls
- Short 1 unit of 3%-4% OTM calls
- Long 1 unit of 1%-2% OTM put
The options payoff diagram (pink line is where the market would be currently):
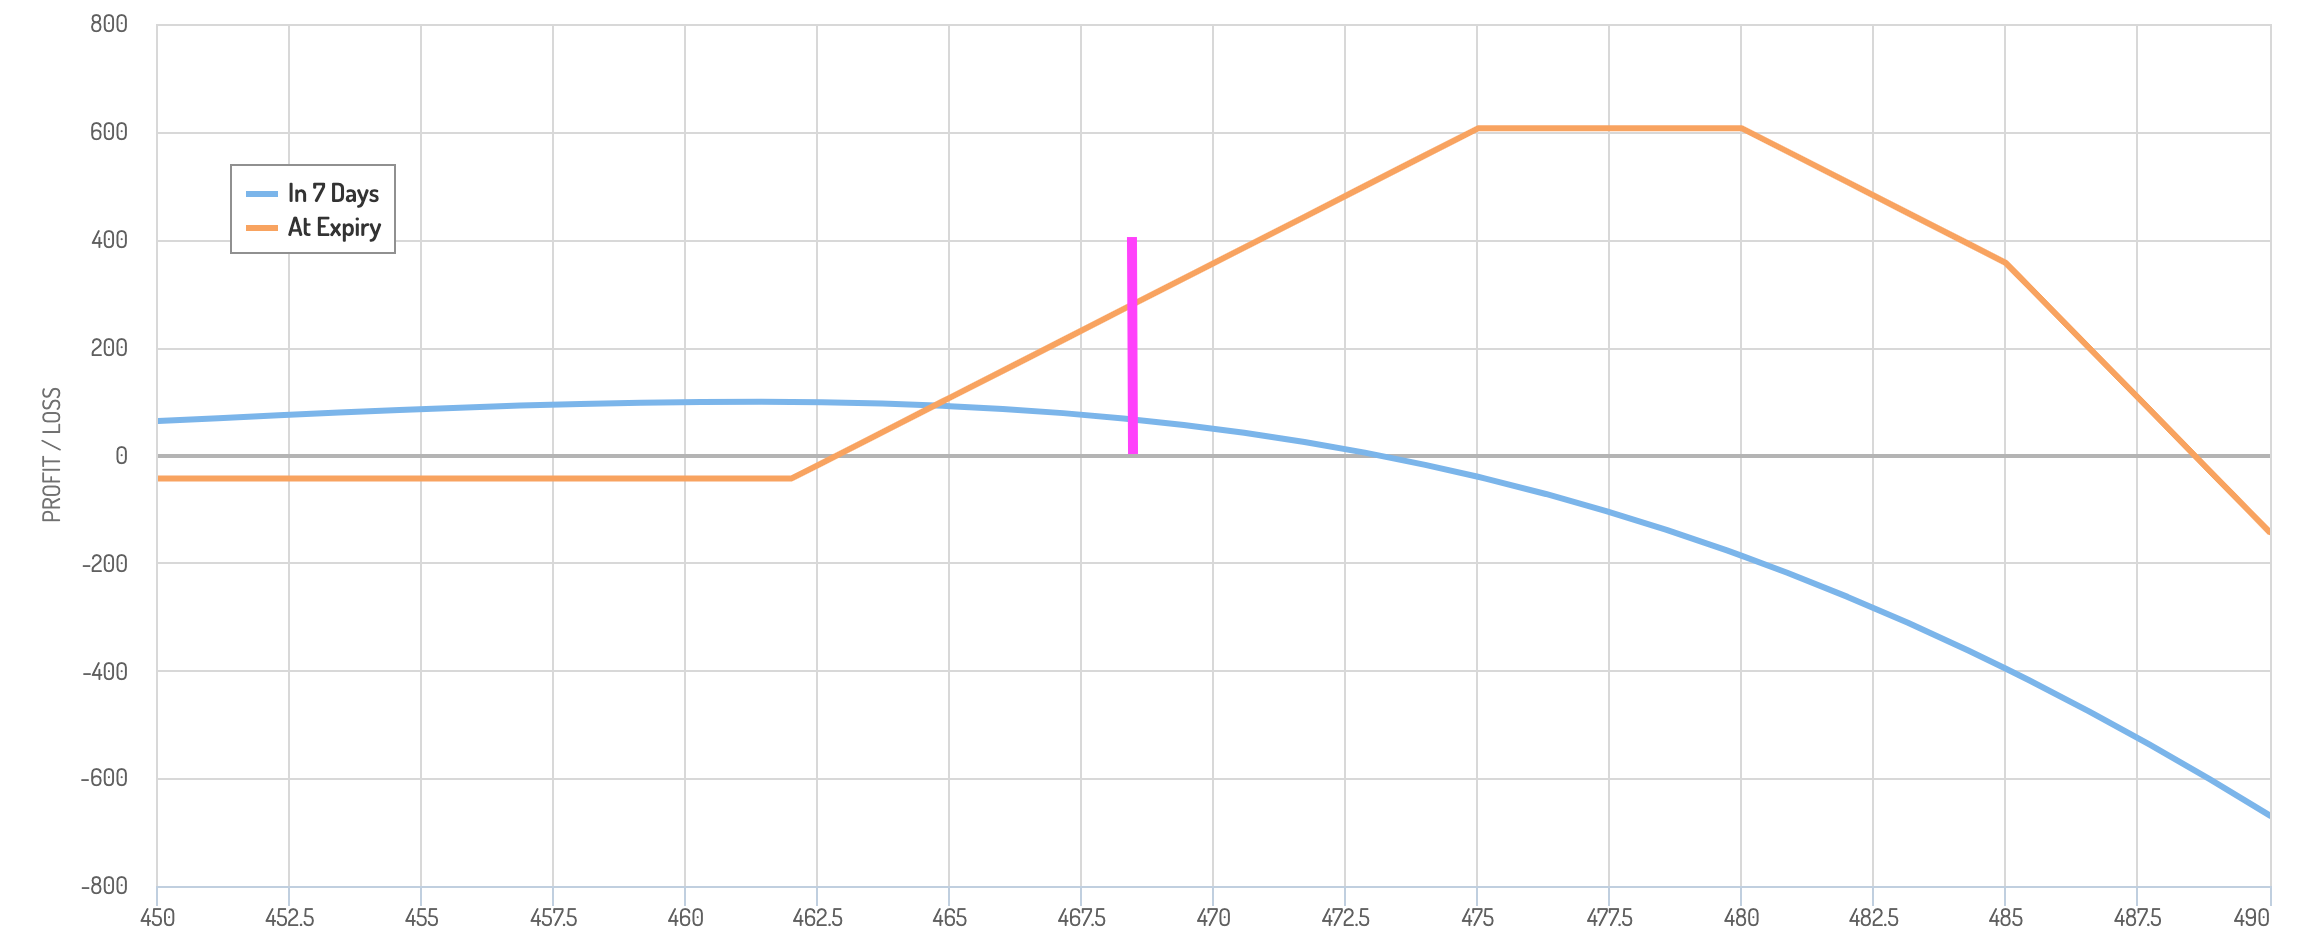
In this case, you might want to use options or dynamic hedging in case you get a big move up in the market.
Notice how ugly your short-term P/L (blue line) can get in a hurry. Your P/L line can fall significantly even if the price going up would favor you in the long run.
So being long some cheaper short-term options can be a lifesaver.
Accordingly, if you don’t dynamically hedge or have short-term call options, then you could end up losing a lot of money.
Dynamically hedge or use options?
Dynamic hedging (buying the underlying) involves no outlay of premium, so it’s cheaper.
However, if you dynamically hedge – basically a type of delta or gamma hedging – price can fall again, so you can lose money.
Using short-term options can be a cheaper way to hedge and can dictate whether you need to hedge or not.
In the trade structure we introduced above, you need to go long 2 units of call options.
So, for example, if your “unit” means 1,000 shares, then you’d need 2,000 shares worth of options, which is 20 contracts, given 100 shares per options contract.
You could do one unit at each point (i.e., use that as the strike price) to prevent short-term losses.
Other asset classes
You can do this with other asset classes as well.
An environment with lots of stimulation is good for the following asset classes:
- stocks
- gold
- commodities
- cryptocurrencies and other risk assets
It’s bad for bonds (so the same thing can be applied to shorting bonds, as bond yields tend to rise in a late-cycle economy).
As a result, you might expect these asset classes to either have more limited gains or be prone to price falls in a late-cycle economy.
Gold example
For example, here’s an example gold trade on a 1-month time horizon:
- Short 1 unit of the underlying
- Short 1 unit of 1% ITM put
- Long 3 units of 1% OTM call
- Short 5 units of 2%-4% OTM calls
- Long 2 units of 5%-6% OTM calls
This produces the following options payoff diagram:
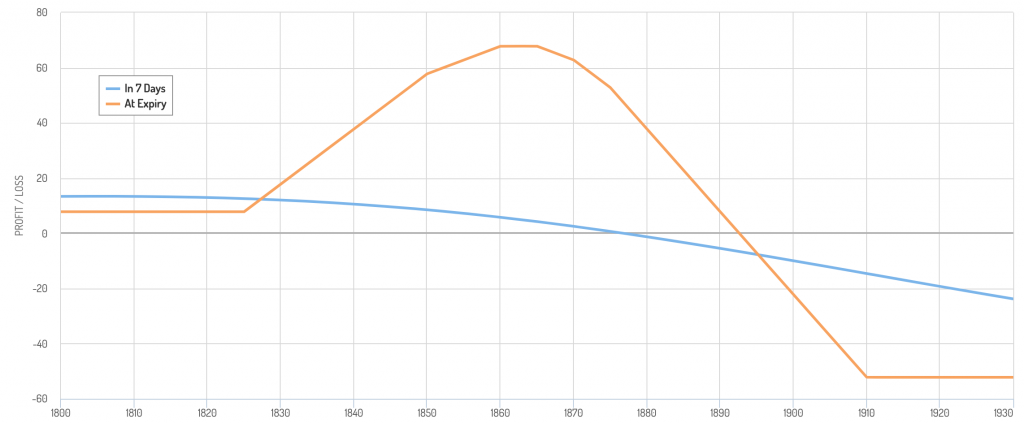
Gold is a fickle market because it’s a lot smaller than stocks (generally about three percent of the overall size of global equity markets).
So it’s prone to big drops.
So if you do get a drop, you can actually make a slight profit despite having a “bullish” overall structure.
Your 2 units of 5%-6% OTM calls can either be short-term or long-term (i.e., same maturities as the others).
This will help “close” your trade structure so you have defined losses – the straight lines you see at the edges of the payoff diagrams – if you do get a big price move either way.
How to improve your odds in a late-cycle economy
Portfolio tilts in a late-cycle economy
For traders and investment managers with a long bias to their portfolios (or those considering what to own on the long side), they are certain sector tilts they might pursue.
These tilts can help you trade a late-cycle economy.
For example, within the equities market, you might want to trim exposure to riskier, longer-duration stocks like high-P/E tech companies and consumer discretionary and up your exposure to things like consumer staples and utility stocks.
What will always have demand?
People will always need to buy food, basic medicine, electricity, gas, and water.
Moving into quality companies that sell products and services that are always going to be in demand will tend to be a bit safer.
What companies have strong balance sheets?
Then consider what companies have strong balance sheets.
This means they have plenty of assets and not a lot of debt and long-term liabilities.
Debt eats equity.
This means that debtholders will always get paid before stockholders.
Cutting a dividend is easy. During bad periods, a dividend to shareholders is an easy thing to pull back on.
The repercussions will be a damaged stock price, but the repercussions of not paying on debt will result in default.
So companies that have “clean” balance sheets are much more likely to get to the other side of a crisis without blowing up their stock price.
If they sell things that have stable demand, then their earnings should keep up reasonably well.
And if they don’t have a lot of debt or a messy balance sheet, then the impact of higher interest rates in a late-cycle economy will also be less impactful.
The stock prices of these companies are still likely to get hit in a downturn.
This is because:
a) Stock market liquidity is heavily tied together. Selling market-wide can ripple into other areas.
b) There is always a discount rate.
The discount rate is tied to the government borrowing rates. It works to calculate the present value of future cash flows. So if that goes up, it lowers their present values (i.e., prices), holding all else equal.
Factor investing
In terms of so-called factor investing, you might want to shift out of Momentum and move toward factors like Quality, Size, and Value.
For example, a company like Wal-Mart – large, diversified, and sells essential items – is probably going to hold up better than the stocks of companies that are smaller, less diversified, and sell more discretionary purchase items (or those commonly bought on credit, like cars and heavy machinery).
Switching more to call options or call spreads
An easy way to limit your downside is to hold less linear exposure to the market and move toward trade structures that limit your downside while giving you a lot of upside.
Things like call options and call spreads can be of value.
It also adds to the case to go long options when implied volatility is lower than normal because they’ll be cheaper.
Trimming riskier assets
The riskiest assets tend to be the first out the door when markets turn over.
This means things like:
- cryptocurrency
- unprofitable or very high-P/E stocks
- CCC credit and other near-default credit
Generally, it’s always risky to hold large concentrations of these assets (but it goes for any asset).
For example, it doesn’t take much of an allocation toward cryptocurrency to feel its effects.
Even a 1-2 percent allocation can be noticed on a day-to-day basis simply because it’s more volatile than just about everything else.
In a recession, people want to limit losses and they often need cash. When people need cash, they sell their assets.
So, the most speculative things are going to be the first ones that people want to sell.
Shorting in a late-cycle economy
You might also want to have a short book.
An easy way to reduce your exposure to the stock market is to short companies and short assets that you think are expensive or will do poorly in case the markets turn over.
Conclusion
A late-cycle economy is one characterized by low unemployment where policymakers begin to worry about:
- inflation
- asset bubbles, and
- currency depreciation
The types of trade structures introduced in this article are a type of active management strategy, and it requires experience to manage them well.
It’s never a good idea to dive into anything head-first, so it’s best to do things on a demo account or simulator, or use small monetary amounts so you get the feel for what you’re doing. It’s important to never risk more than you’re willing to lose.
In late-cycle economies, there are fewer attractive opportunities, but that doesn’t mean you have to be stuck with middling returns.
Options allow you to capture the distribution of anything and also do it in a risk-limited way if done well.
There’s an element of creativity in terms of how to structure trades to express your views. You don’t have to be locked into anything, such as always just being linearly exposed to the stock market.
They can protect your downside and offer you high returns depending on how the trade is structured.
If you have:
- a balanced portfolio to lower your risks without reducing your returns and
- can add an extra layer of convexity through the way you structure your trades, while
- keeping yourself within acceptable risk parameters…
…you can significantly improve your results.
Other strategies for trading a late-cycle economy include:
- portfolio tilts toward safer assets (stable earnings, strong balance sheets)
- shorting assets
- putting more of your portfolio in limited-risk trade structures (like call options and call spreads)
- trimming riskier asset exposure