How Exponents & Non-Linear Math Can Help You Build Wealth


Our brains do a poor job of processing exponentiation. But exponents and non-linearities are a big part of trading, investing, and financial markets.
As a trader, your job involves assessing reward relative to risk and getting the former as high as possible relative to the latter and risk as low as possible in an absolute sense.
We’ll go through a few examples of where exponents and non-linearities exist in the trading world (and beyond) and how to take advantage of them.
Building a balanced portfolio
In trading, it’s a natural instinct to go deep into something you think you have high confidence in. But you can’t have high confidence in the markets.
The price reflects everything that’s known.
The range of unknowns is high relative to the range of what can be known relative to what’s discounted in the price.
For example, are stocks a good investment right now? Are bonds? Is oil? Gold? The dollar?
You can’t bet significantly on anything without exposing yourself to material risk.
But you do know that different assets will act differently from each other, as they all have environmental biases. Balancing and mixing them well will keep the upside without exposing yourself to unacceptable downside.
If you have just four equal-returning, equal-risk income streams that are uncorrelated to each other, you improve your return relative to your risk by a factor of 2x.
If you have 10 of those, you’re improving your reward-to-risk by a factor of more than 3x.
If you have 15, your improvement is a factor of about 4x.
That’s a huge difference in the way that you can generate returns and build wealth.
This chart shows the relationship.
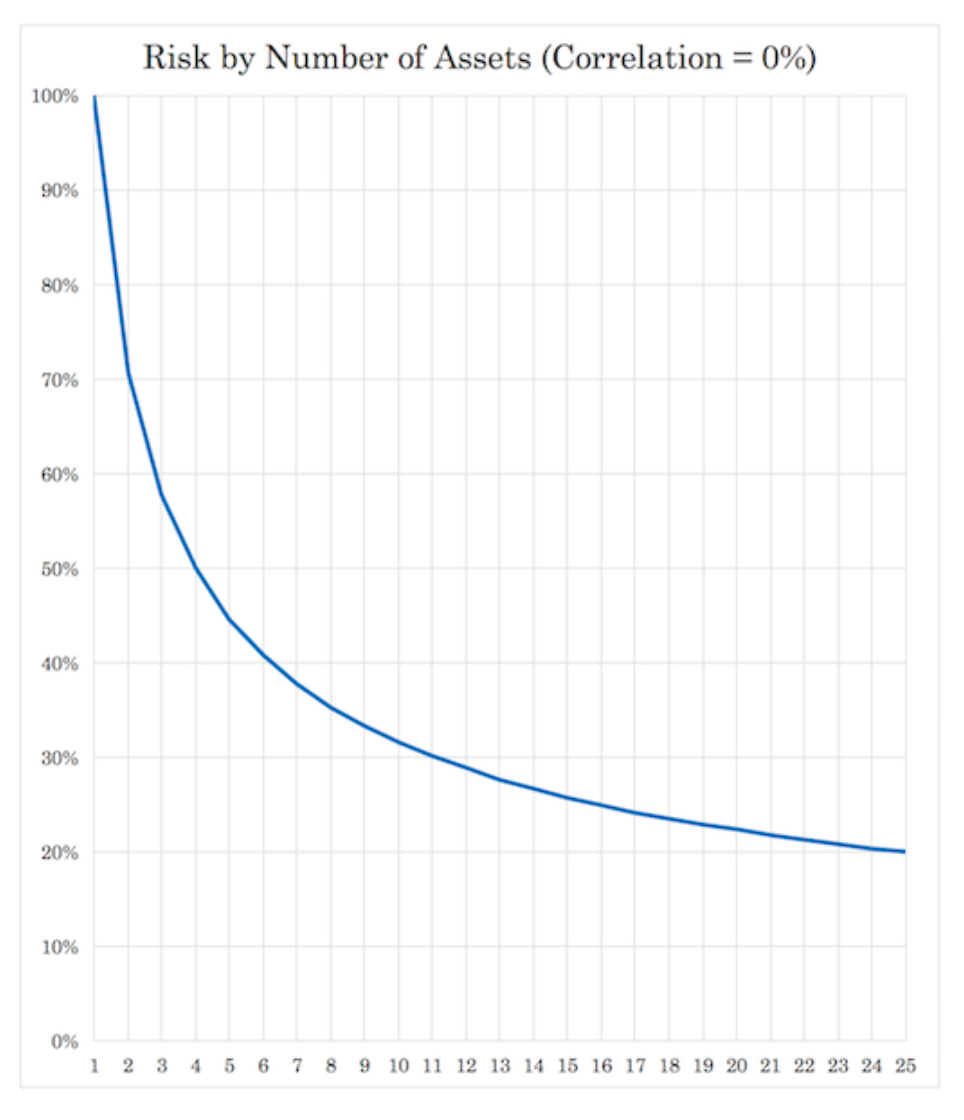
You can also see that there are diminishing returns.
For example, going from one to four returns streams (if equal in character in risk/reward terms and uncorrelated) cuts risk by 50 percent.
But adding another four returns streams beyond that doesn’t reduce risk by even another 15 percent. (Though it’s of course useful if you can do so.)
And what correlation means is a different story. While correlation typically signifies something that’s backward looking – e.g., “stocks and bonds are 20 percent correlated” – It’s about what fundamentally drives the returns streams that you have on.
Gold is sometimes positively or negatively correlated to stocks and bonds, for example, but what drives gold prices and other assets and trades you put on is key.
Once you up the correlation between returns streams, the diminishing returns become much more pronounced. Each additional return stream has less and less effective in terms of its diversification value.
At 25 percent correlation:
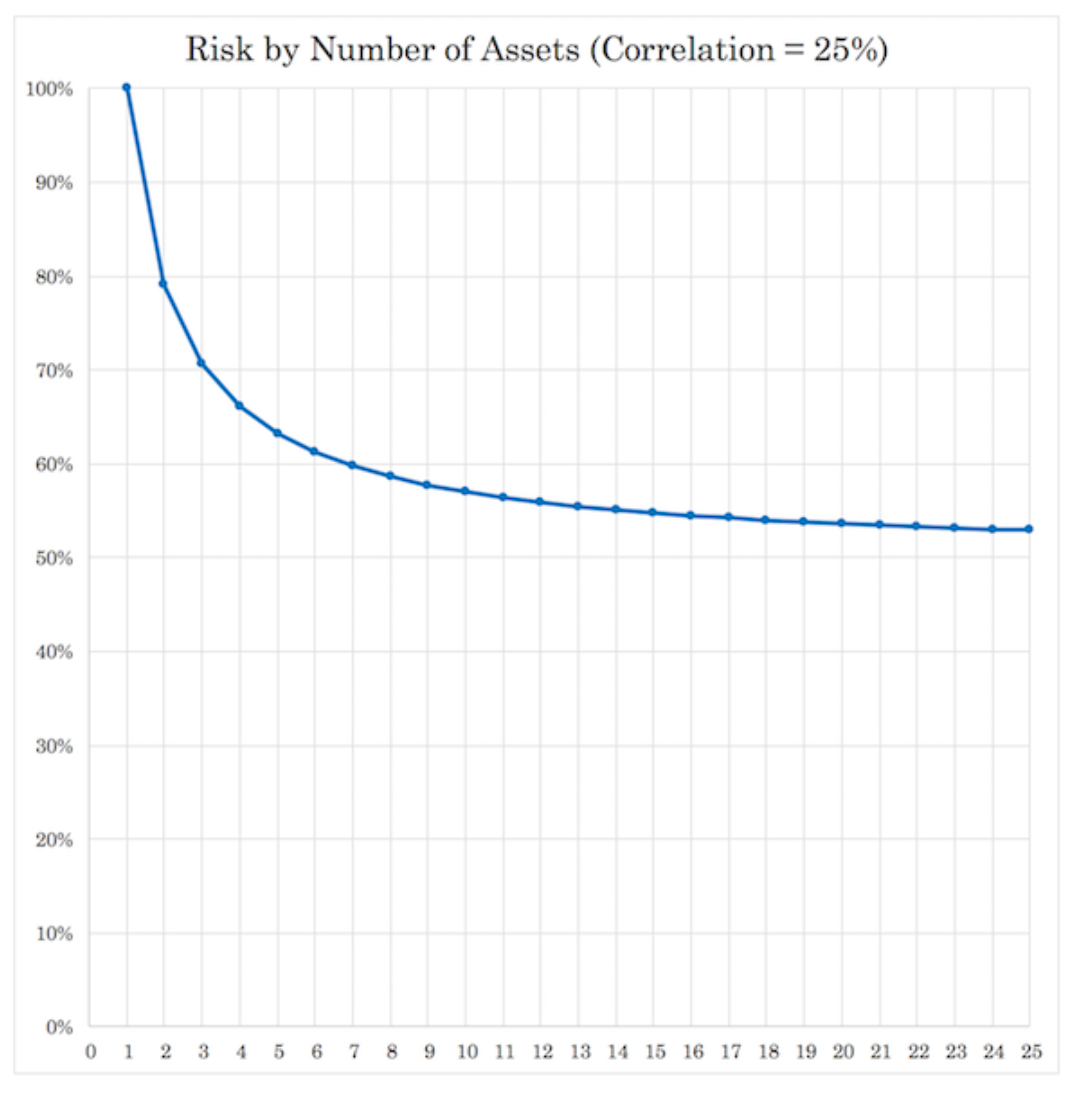
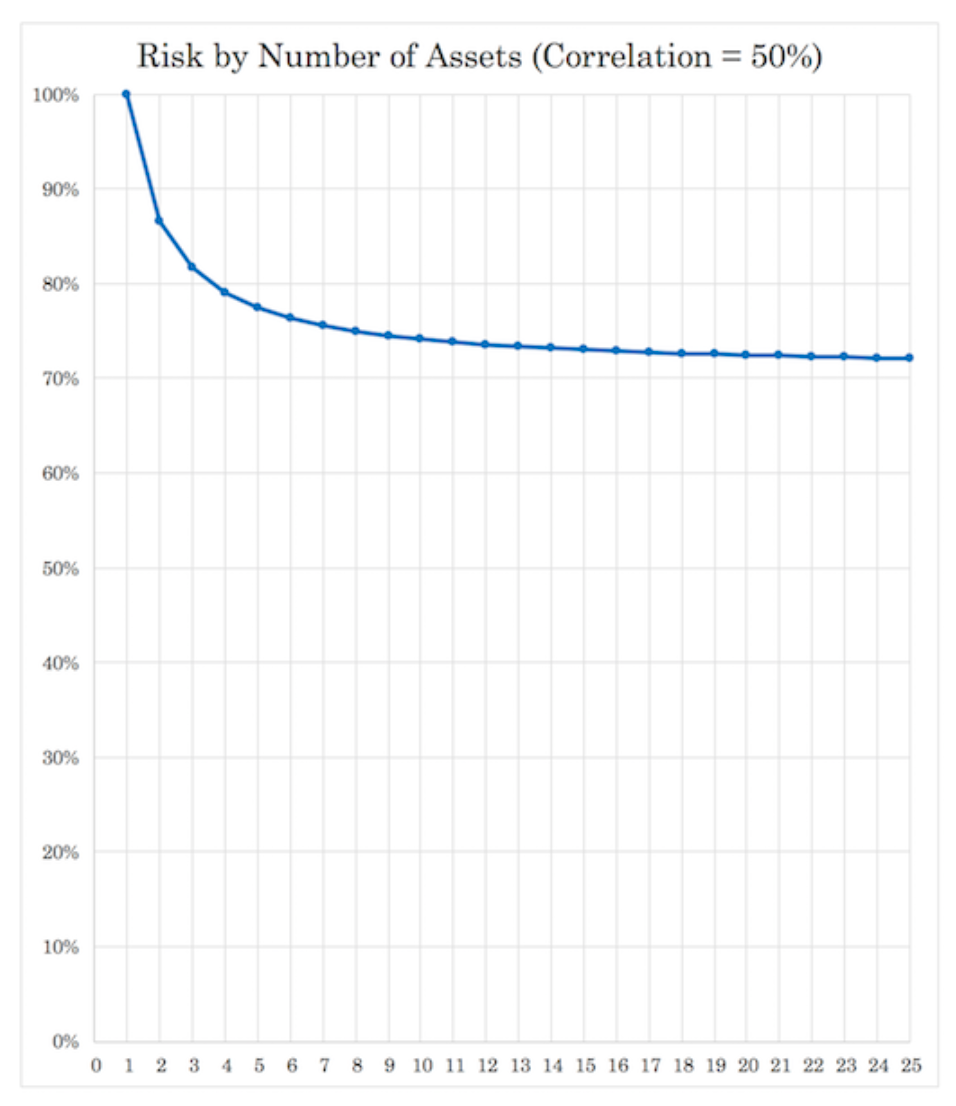
This gets even more pronounced as you go higher with the correlation until they become so alike there’s little marginal value beyond the first few.
50 percent:
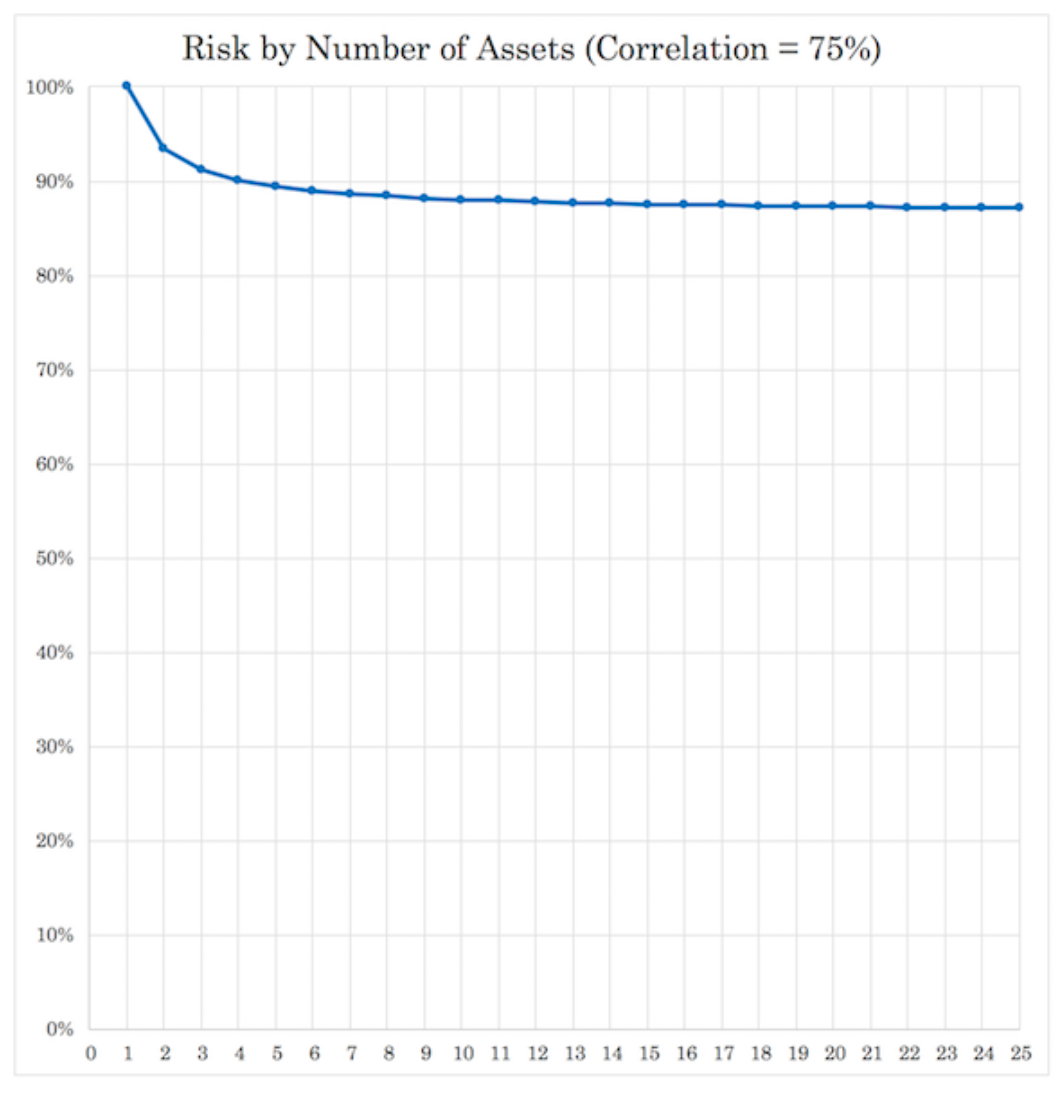
75 percent:
Takeaways from the exponentiation effect on diversification
If you can find about 15 quality, truly non-correlated returns streams, that each has about equal return and equal risk – all assets can be made competitive with each other through the use of leverage or by holding by cash against the more volatile returns streams – you can improve your return to risk ratio by about 4x.
Your marginal risk reduction from diversification are the most beneficial at first, then they become reduced from there. (They are large at the beginning if correlation is very low.)
If you go from just one to two non-correlated return streams, you cut your risk by 29 percent without reducing your return.
If you go from one to three non-correlated return streams, you cut your overall risk by 42 percent.
Four uncorrelated return streams will cut your risk in half.
If you go out to 10 return streams, risk is decreased by 68 percent.
Out to 15 returns streams, there’s about a 74 percent risk reduction, or a new reward-to-risk ratio of about 4x.
On the flip side, if you’re in a portfolio where you own 25 stocks that are about 75 percent correlated, you’re reducing your risk by only about 13 percent.
If you have one thousand stocks, you’re reducing your risk by about 15 percent. Even after 4-5 returns streams, your marginal benefit is less than one percent when adding each one.
The driver of the cash flow is different for many companies depending on what they sell, but they’re all essentially tied together by the same thing.
Equities tend to go up in unison when growth expectations are discounted above what they previously were and inflation expectations re-rate downward.
Diversifying will improve reward to risk better than practically anything else you will do
Most market participants are biased toward their own domestic stock market. This tends to leave them with a poorly diversified, concentrated portfolio subject to large drawdowns.
Most traders should think less in terms of what type of specific asset or thing can I invest in that’s going to be good.
Instead, more of the focus should be placed in terms of how can I structure my portfolio in a way that gives me an excellent asset allocation mix that doesn’t bias my portfolio to outperformance or underperformance in any given environment?
In the markets, what you don’t know is always going to be greater than whatever it is that you do know.
It also takes a certain level of self-awareness and humility to know what one doesn’t know. Paradoxically, the most inexperienced traders and investors tend to be the most confident in their activity because they’re simply unaware of what they don’t know.
The approach to diversification can also be simplified with basic portfolios.
Drawdowns
It’s easy to think of drawdowns as linear in nature.
For example, losing 20 percent seems twice as bad as losing 10 percent, and losing 40 percent is twice as bad as losing 20 percent.
And it is. But it’s the percentage gain needed to climb out of the hole that’s the problem.
It’s exponential.
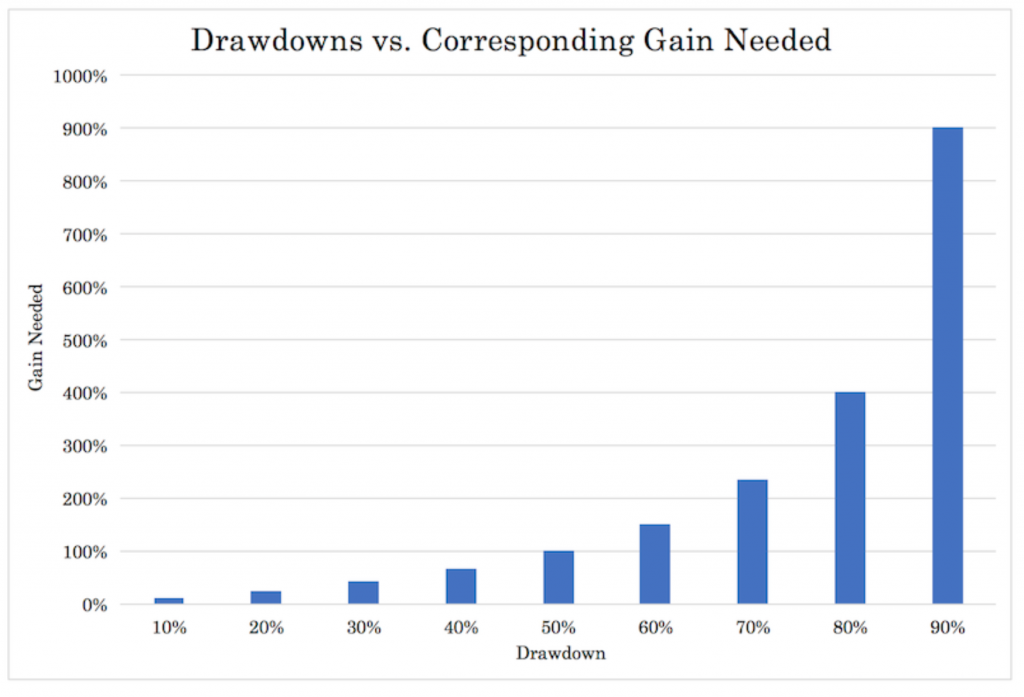
If you draw down by 10 percent (90 percent of your equity left), you need an 11 percent gain to get back to where you were (1/0.9).
If you draw down by 20 percent, you need a 25 percent gain to get back to breakeven (1/0.8).
Once you draw down by 50 percent, you need a 100 percent gain just to get back.
And if you’re dealing with extreme drawdowns like 80 and 90 percent, you need 5x and 10x gains, respectively, which can be extremely hard to recover from.
In other words, losses are not compensated by offsetting gains. Drawdowns of any material size need to be avoided at all costs.
Simple exercise
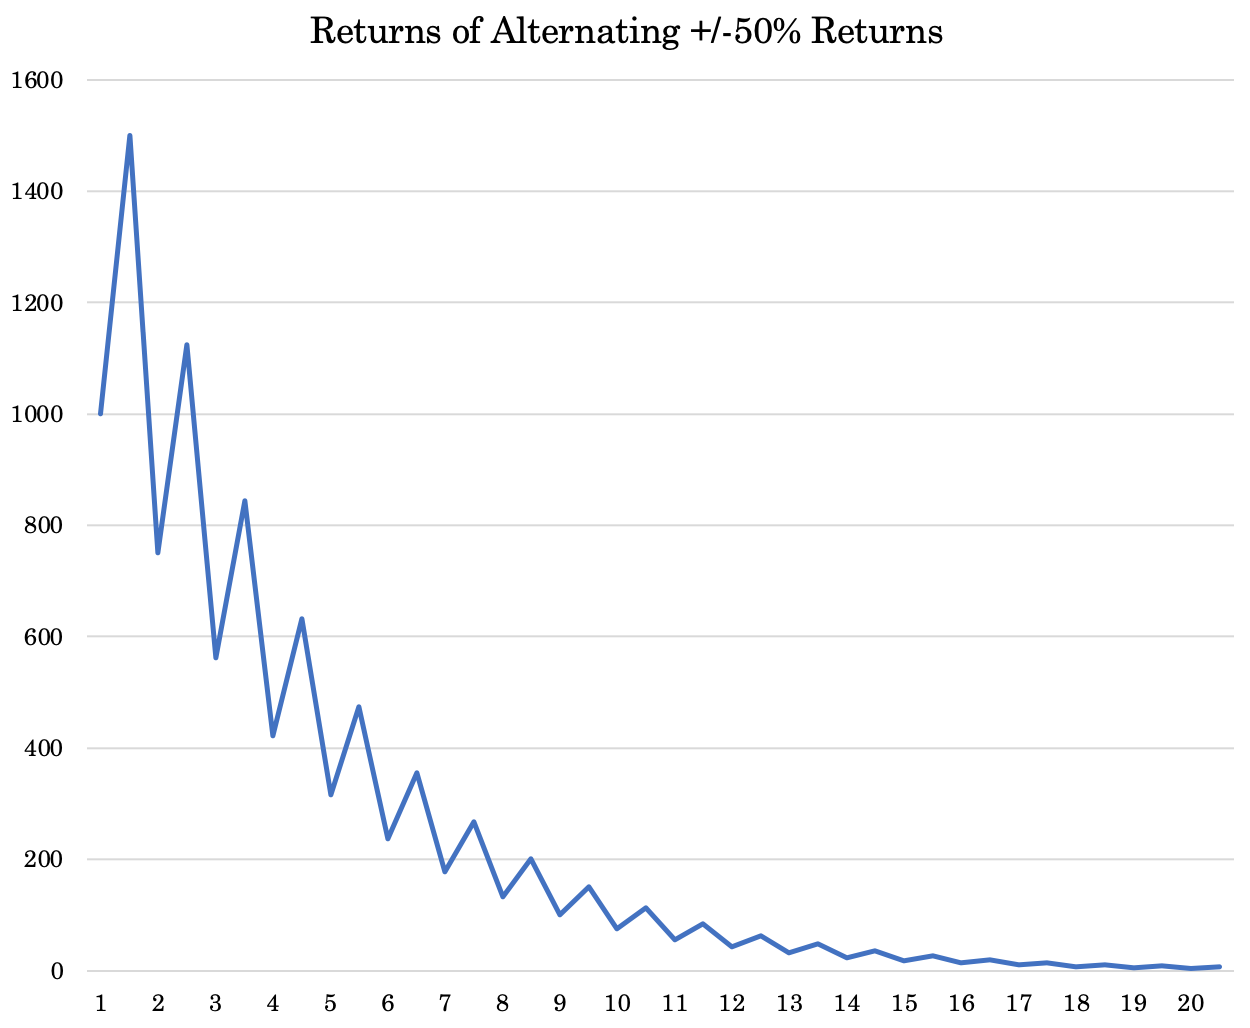
Let’s say you start playing a game with $1,000.
You alternate returns of gains and losses of 50 percent.
- In the first round you make 50 percent ($500, so $1,500 total), then lose 50 percent (down to $750).
- Then repeat the next round – $750 -> gain 50 percent -> $1,125 -> lose 50 percent -> $562.50
And so on and so forth.
As you can see just from two rounds, you’re already losing money at a fast pace.
In fact, after just 10 rounds you’d be down to just $56, or nearly 95 percent of the money will have been lost.
By the end of round 15 you’re down to just $13, nearly 99 percent lost.
And down to just $3 by the end of the 20th round.
Moral of the story – you have to have a keen eye for risk management. It’s the most important aspect of trading and of most business activities.
You have to keep your upside as high as possible while limiting your downside.
Options – owning convexity
Being long options – also known as being long gamma – is a way to improve reward relative to your risk.
Options have a fixed downside – the price of the premium. Being short options have the opposite effect – your upside is only the price of the premium – and your downside could be infinite.
When people wipe out in trading it’s usually because they were short options or due to injudicious use of leverage.
Convexity is a term often applied to owning options. You have a convex payout structure.
If you pay $1 per share to own a 50 strike call and the stock rises to 60 by expiration, you earn $10 per share.
The stock rose by 20 percent, but you earned 10x your money on that trade.
An options payoff diagram can show the general relationship:
Hypothetical options payoff diagram for owning a call option
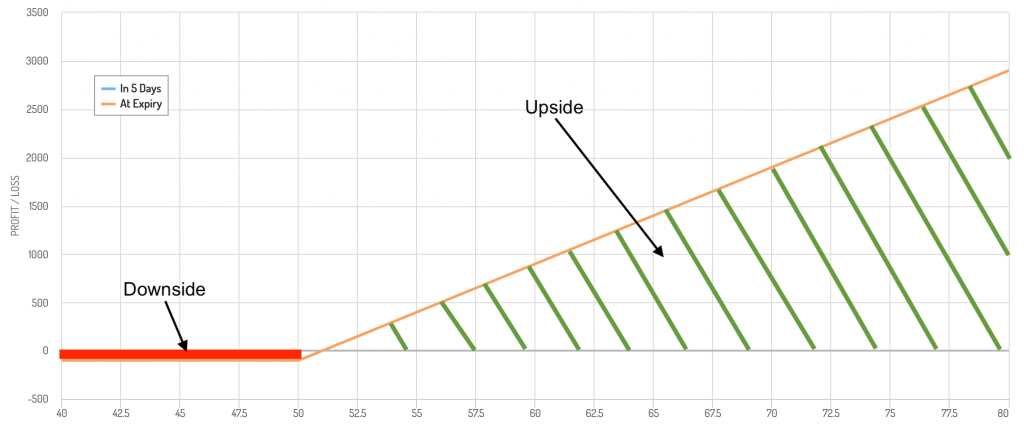
The downside is low relative to the theoretical upside.
Payoff diagrams are, however, misleading in that they don’t take into account the relative probabilities associated with each outcome.
For instance, if a stock is trading at $50, there’s a higher probability of the stock trading at $55 than at $80 within any reasonable timeframe. In the diagram, it’s represented as if the possibility of such is linear.
But there’s a general convexity associated with options that enables you to potentially generate large gains while capping your downside.
Options are, on average, expensive. So many traders will use other tactics to keep the large upside without bearing too high of a cost.
For example, they might buy call spreads, involving buying an option and shorting a further OTM option. Or they might stagger maturities and/or overweight the short side of the spread they’re long and dynamically hedge, if necessary.
Expected value
As a trader you need to understand expected value and how to make basic EV calculations.
In every trade there is:
a) a probability of being right and a reward for being right, and
b) a probability of being wrong and a penalty for being wrong
Example #1
For instance, if you have a 1 percent chance of being right and a reward of $10,000 for being right, and a 99 percent chance of being wrong and a penalty of $20 for being wrong is that a bet worth making?
Looking at it in expected value terms:
Expected value = .01 * $10,000 – .99 * $20 = $100 – $19.80 = +$80.20
You have a positive expected value. So assuming you can cover the (probable) loss of $20, that’s about a 4x reward to risk trade in EV terms.
Your probability of being wrong is very high (and odds of being right are very low), but that’s a bet that’s worth making if losing the $20 is something that doesn’t hurt you much.
Example #2
Now let’s say you have a 90 percent chance of being right and a reward of $100 for being right, and a 10 percent chance of being wrong and a $1,000 penalty for being wrong.
(This could be analogous to selling an OTM option. An option could have a 90 percent chance of expiring worthless – good for the seller – but have a 10 percent chance of going ITM where the tail of the distribution could suggest an average expected loss of $1,000.)
In expected value terms:
Expected value = .90 * $100 – .10 * $1,000 = $90 – $100 = ($10)
Even though you have a high probability of being right, the expected value calculation suggests that it’s not a bet worth making.
Once you know expected value, you know that it’s not always a good idea to simply bet on the things that have the greatest odds of working out.
Your win percentage is not as important as how much you win when you’re right and how much you lose when you’re wrong.
Having numerous positive expected value bets that are spread widely and ideally uncorrelated will go a long way toward helping you have consistently positive outcomes.
Reward to risk
Assessing reward to risk accurately is one of the abilities a trader has to become good at.
And it’s not easy. For example, those who were short Gamestop at $5 per share in 2020 and 2021 saw it was a fundamentally poor business that probably wasn’t worth anything. It went down a lot further on a percentage basis if the timing was good.
But almost no one could have predicted that in a few weeks it would be nearly $500 per share. It’s easy to get the reward/risk calculation (or perception) very wrong.
Hertz (HTZ) stock went up 10x after it declared bankruptcy.
Tesla (TSLA) was on the verge of running out of money in May 2019 at a market cap of $40 billion – then extremely high for an automotive manufacturer, especially one for little market share. Then it went up more than 20x over the next year-plus.
This is what makes shorting so difficult, in general. Short trades have only 100 percent upside, but you can lose many multiples of your principal.
Example
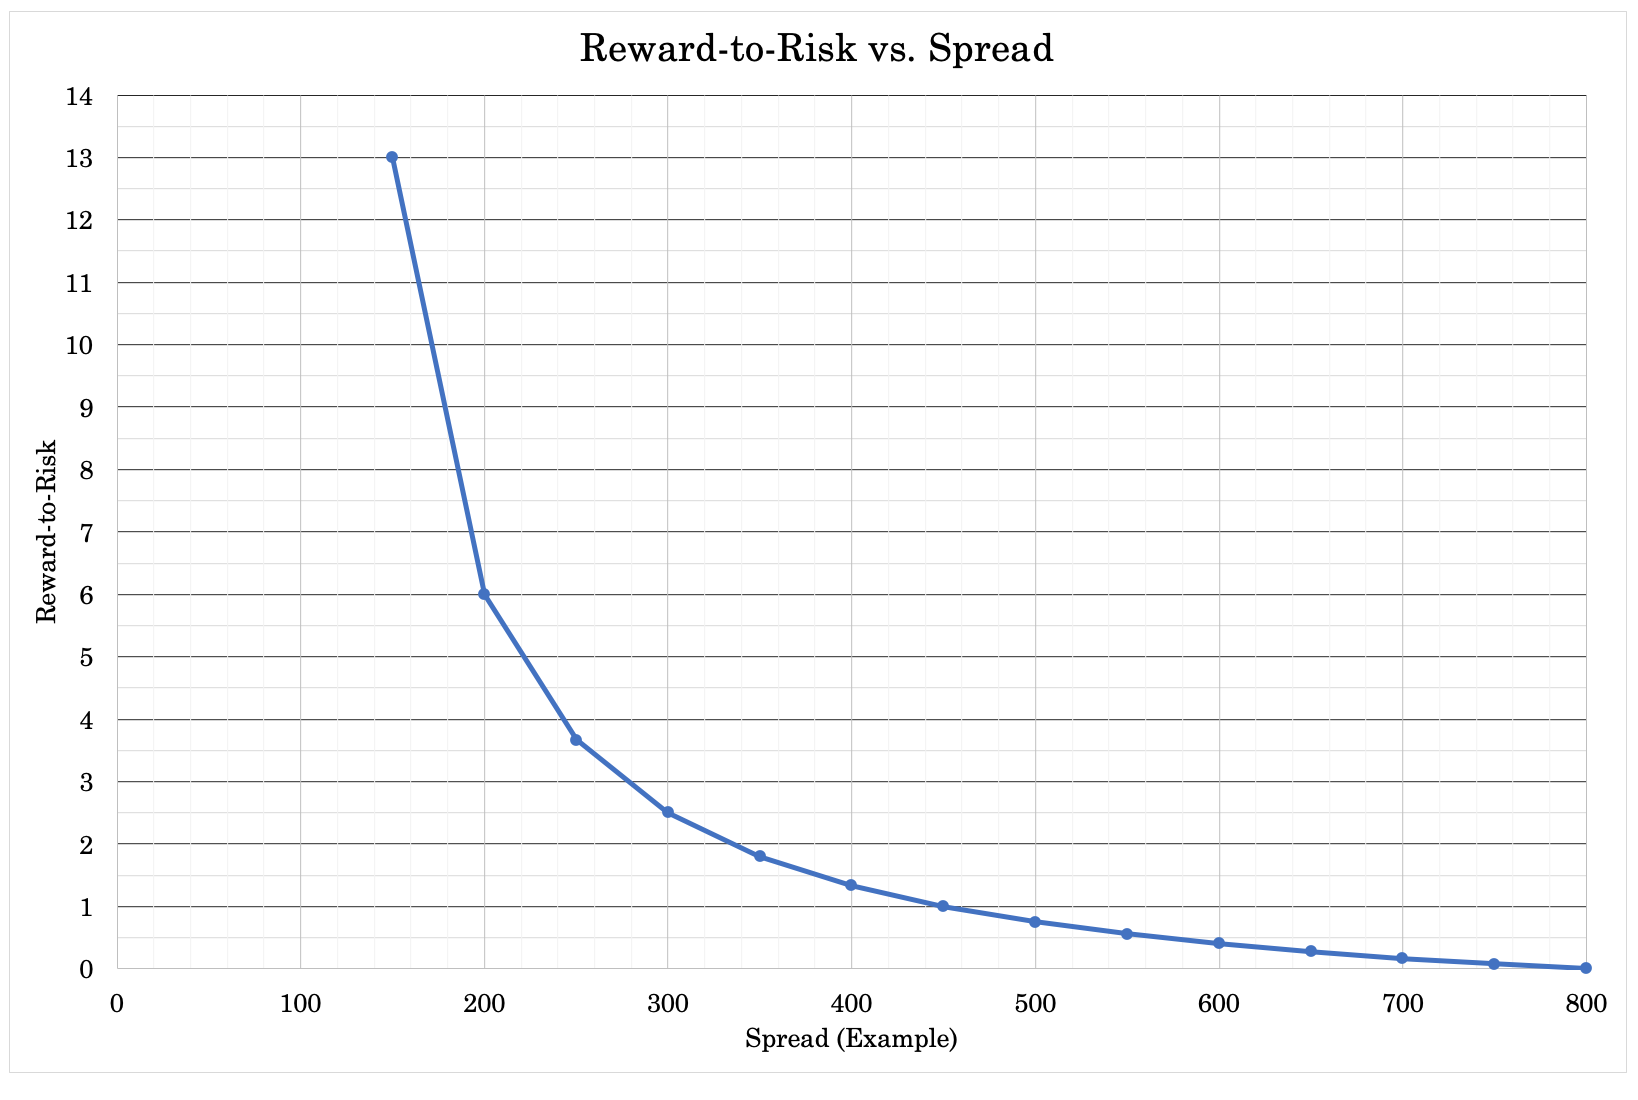
Let’s say a credit trader is working in a market (e.g., corporate credit of a certain quality) that typically has a spread of 50-800bps (0.5 to 8.0 percent) over similar duration Treasuries.
If the trader wanted to look at the hypothetical risk/reward of owning credit default swaps at various spreads, he could look at the current spread between Treasuries and the credit instrument and would it could potentially move out to (e.g., during a recession).
In theory, no US credit instrument should be more creditworthy than US Treasuries because the US government can print its own money.
If there’s a 100-bp spread between the instrument and Treasuries that essentially means that shorting the spread would cost 100bps per year.
If a risk-off event hit the market and the spread ballooned out to 800bps, the trader would make a profit from that event. If he had paid eight years worth of spread (at 100bps), it would be about a breakeven trade.
Some traders short CDS as a reasonably low-risk hedge against a risk asset portfolio and pay the spread as a matter of insurance.
The risk/reward in spread trades is often non-linear. The tighter the spread, then theoretically the lower the risk and higher the reward.
The chart below bears the potential relationship:
Bond and asset duration
An asset’s duration pertains to how long it would take a trader to get back his total principal in terms of the yield provided by the investment.
Duration most commonly applies to bonds but is pertinent to all financial assets. Investing fundamentally involves paying out a lump sum to get an income stream in return.
If an asset’s yield is 10 percent, the duration is the reciprocal – one divided by 10 percent (0.1) or 10 years.
If the yield is 5 percent, the duration is 20 years. If 2 percent, then 50 years. And so on.
The P/E ratio is a type of duration, showing how many years it might theoretically take to get your total investment back in earnings.
As the yield gets closer and closer to zero, the duration of an asset expands in a non-linear way.
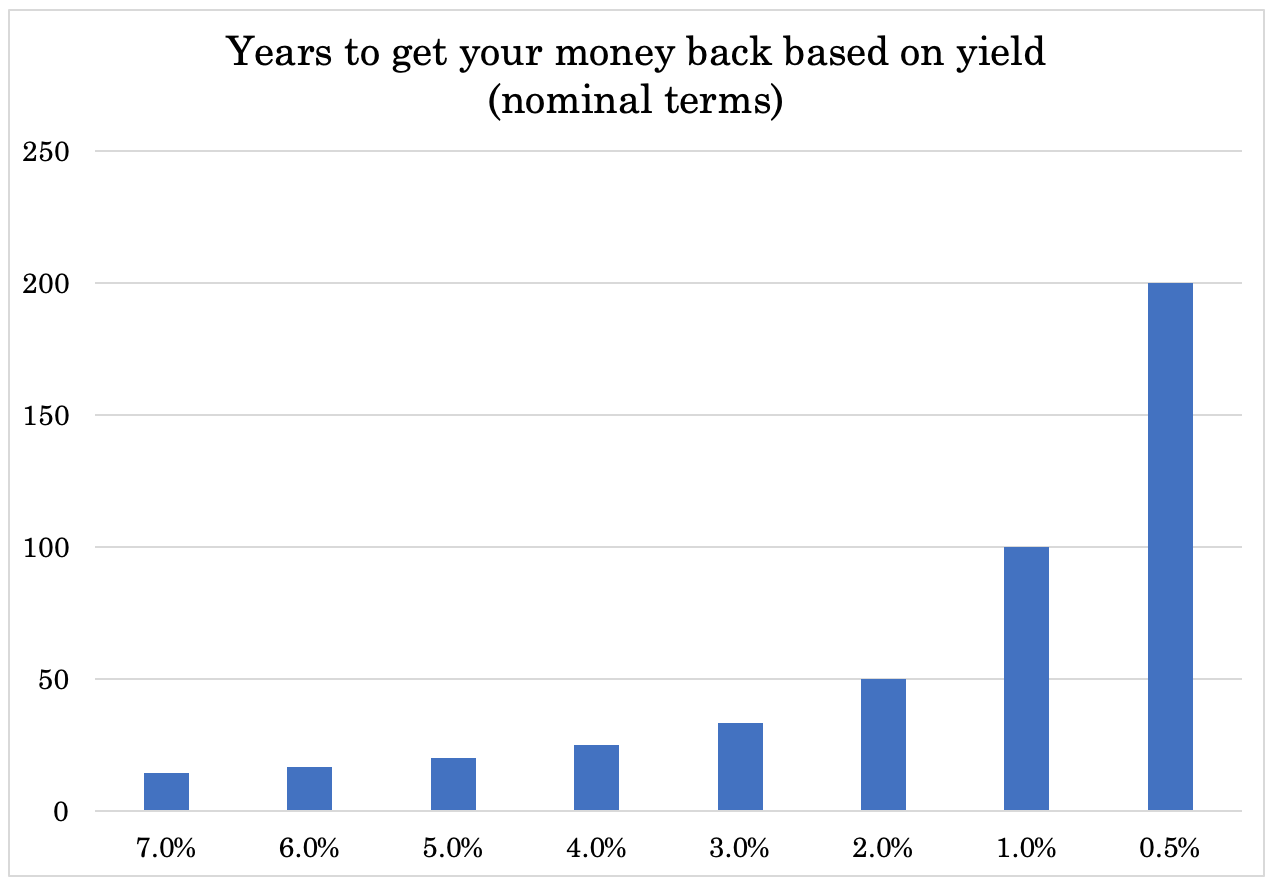
The implication of this – especially is a zero interest rate world – is that a small jump in yields can create outsized moves in asset markets.
If a perpetual duration financial asset produce $1 in earnings per year, at $100 per share, it yields 1 percent. If its yield goes down to half a percent it needs to double in price.
If yields, however, rise just 150bps and that feeds through into the yield of the asset (half a percent annual return to two percent annual return), its price will need to fall from $200 ($1/$200 = 0.5 percent yield) to $50 ($1/$50 = 2 percent yield).
In other words, it would lose 75 percent of its value.
As yields go down, the duration of financial asset lengthens, which makes them more vulnerable to unexpected rises in rates. This could be due to inflation expectations re-rating higher or the actions of central banks, as the two most prominent reasons.
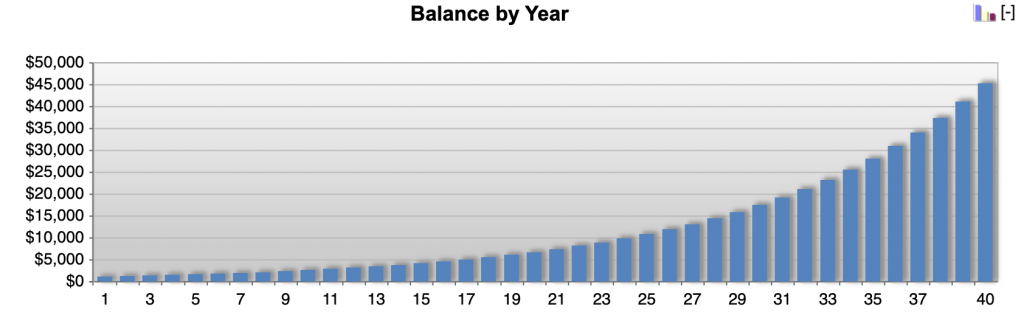
Compounding
Compounding is the most well-known example of exponents and non-linearities in trading and investing.
For example, if you invest $1,000 today and earn 10 percent on it over the next year, you earned an additional $100 ($1,100 total). After another year, you earned another $110, or $1,210 total.
It goes slowly at first, but if that’s done over 40 years, you’ll have $45,259.
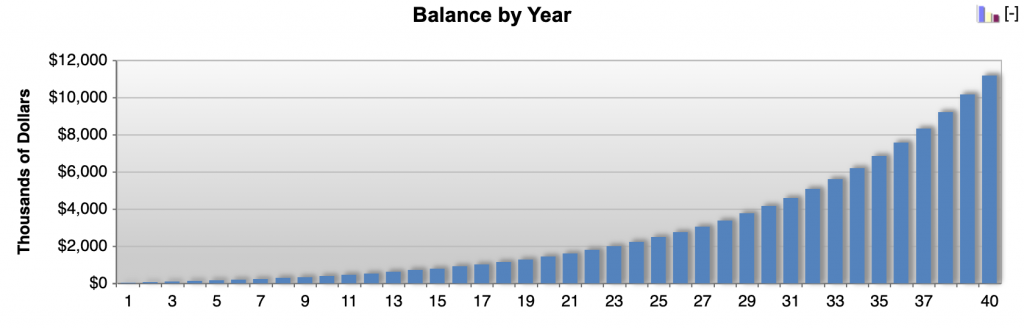
Let’s say someone started investing at 25 from a balance of $0, saved $2,000 per month, and earned 10 percent on it per year.
They’d have $11.2 million.
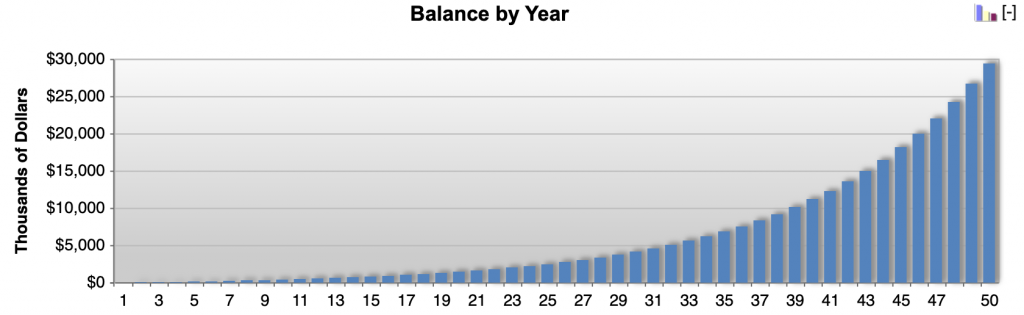
If they compounded it over another 10 years, it would be worth $29.4 million.
Compounding demonstrates that you don’t have to earn a lot of money to develop a large nest egg. You just need to save a respectable amount and earn a decent return.
The saving factor is more important than the overall return.
What’s better – saving $1,000 per month and earning 10 percent per year or saving $4,000 per month and earning 5 percent per year?
Saving $1,000 per month at 10 percent return per year would give you $5.6 million.
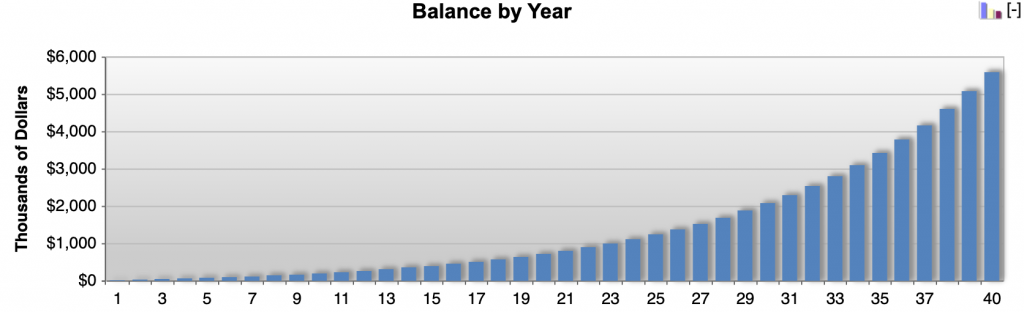
Saving $4,000 per month at 5 percent return per year would give you $6.0 million.
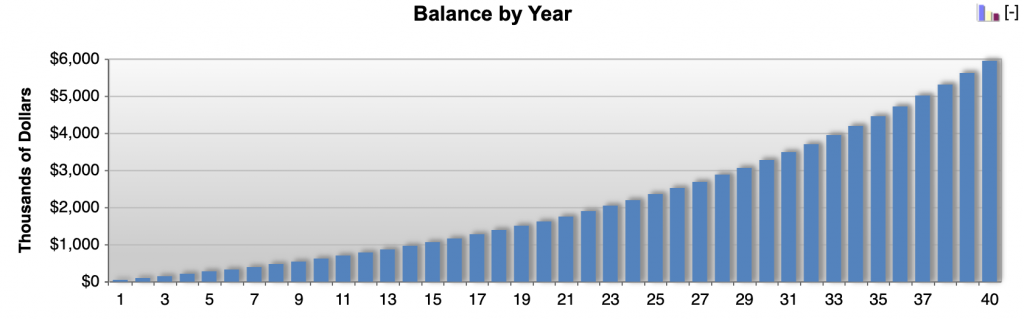
The “big saver” striving for just 5 percent yearly return will have an easier job and is likely to have lower drawdowns, lower left-tail risk, shorter underwater periods, and just overall less stress than the “decent saver” striving for 10 percent annual return.
Just for fun, if you started from nothing (zero dollars), earned 10 percent per year, compounded over 50 years, how much would you need to save per month to hit $1 billion?
You would need to save $68k per month. That’s just over $800k per year (after taxes).
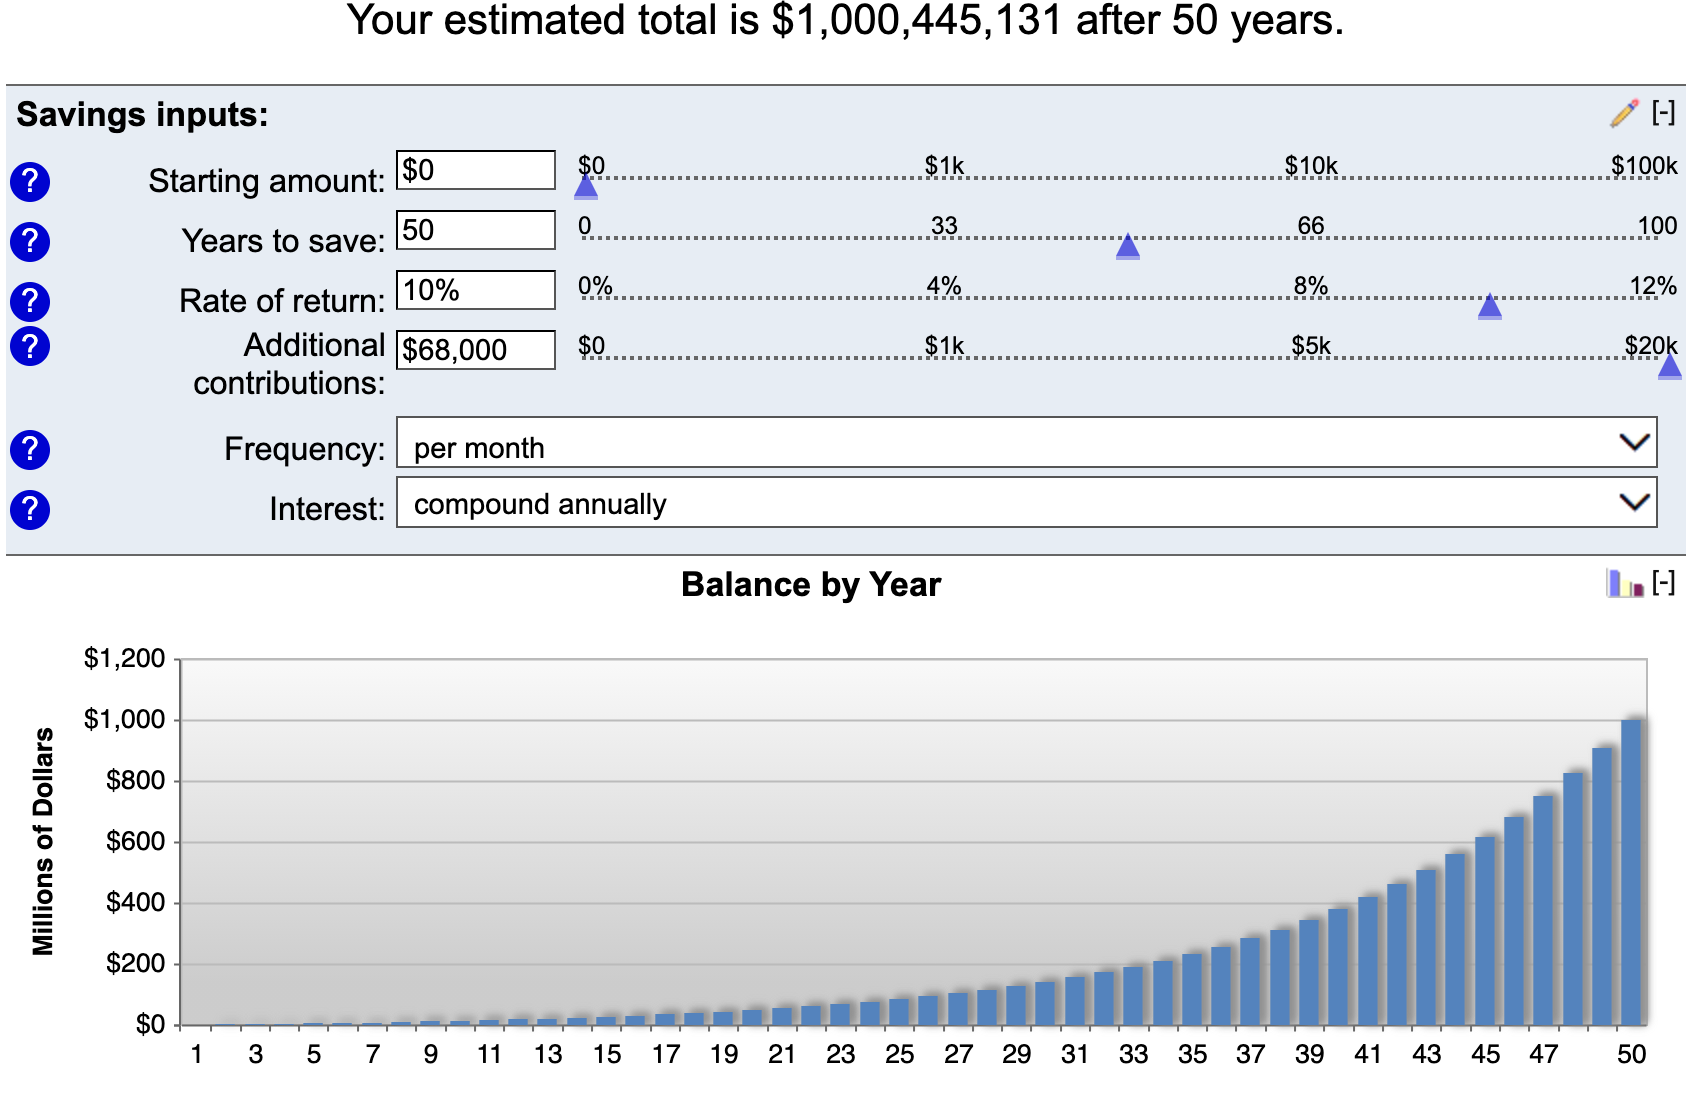
That’s a lot, but it also means that if you subtracted a zero off ($80k per year) it’s still possible to build a nine-figure nest egg with good returns over a long enough time horizon.
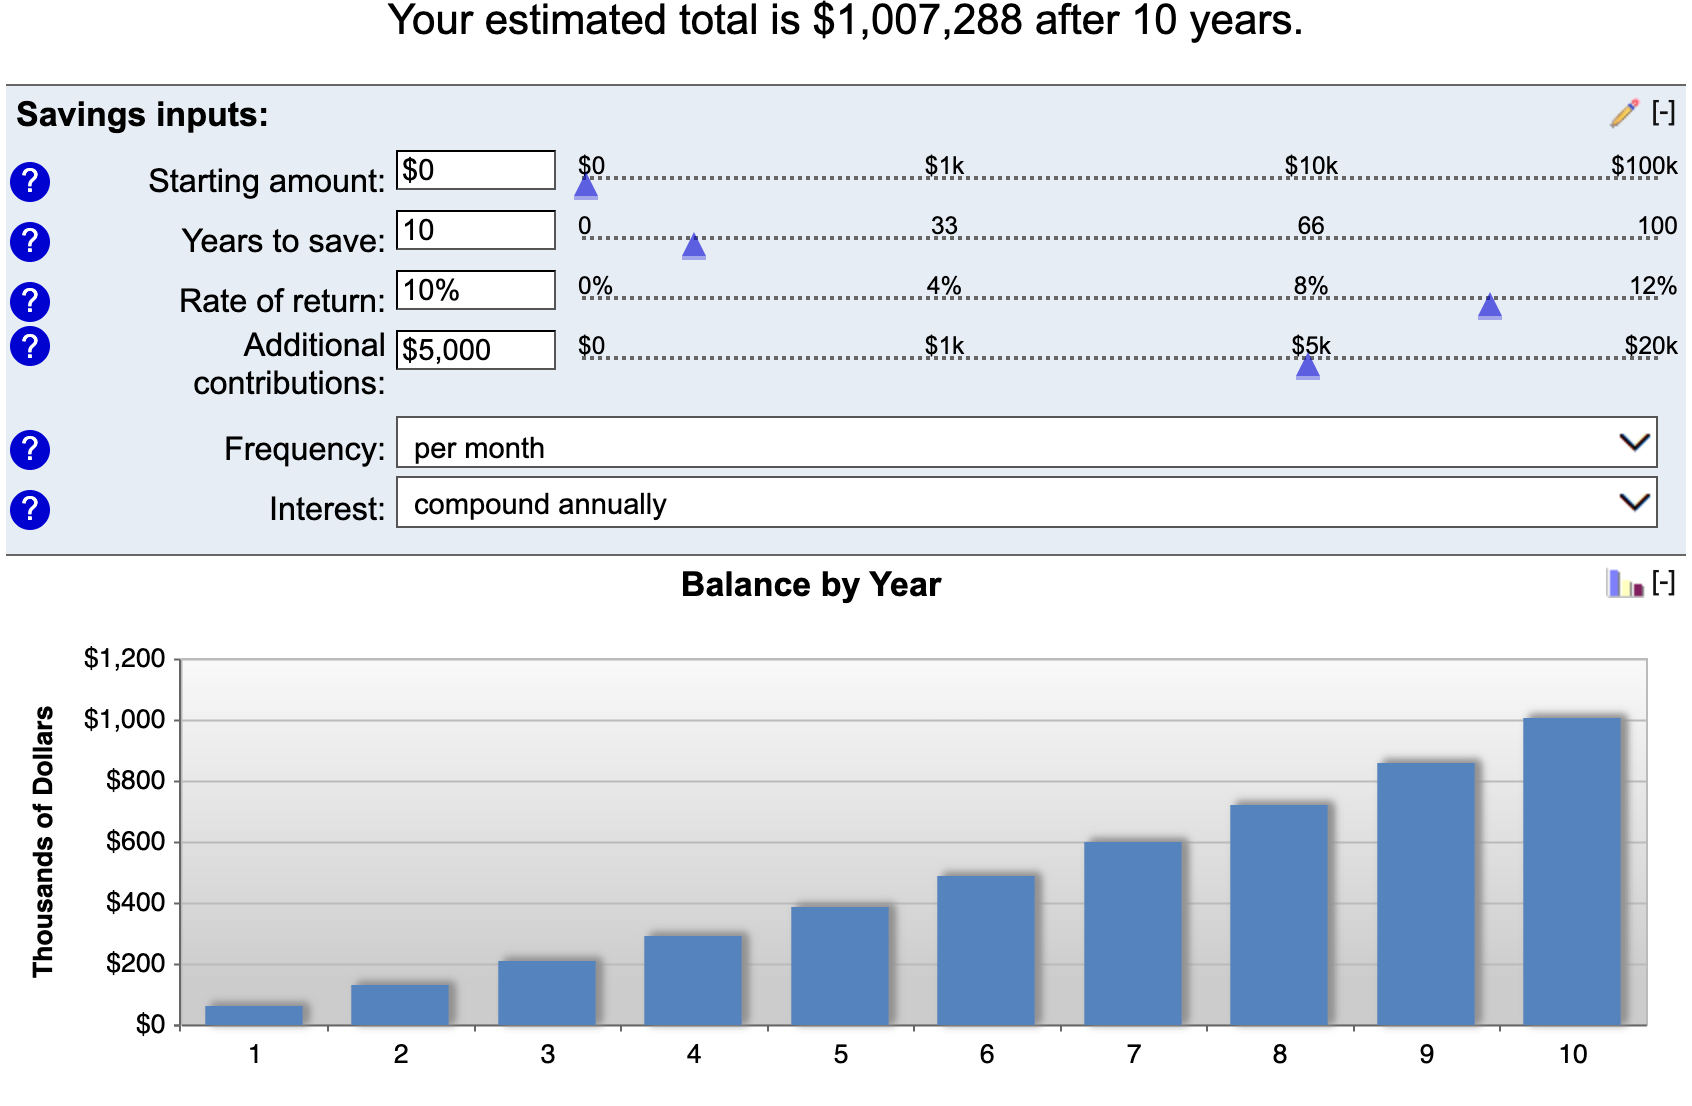
From nothing to an ‘everyday millionaire’ in 10 years?
If you just want to be an everyday millionaire ($1 million liquid), start from nothing, earn 10 percent per year, and want to do it within 10 years, how much would you need to save?
$5,000 per month.
A lot of time is spent on what the best investments are or what the right trading strategy is. But not as much is dedicated to the personal finance aspect.
To trade or invest you need money, which ideally comes in the form of money earned. The more you save the more money you can dedicate to the markets.
Why are exponents so non-intuitive?
Our brains are not good at computing exponents. As compounding goes on, the amount gets larger and larger in a steepening, non-linear way. Do it enough at a high enough level, the compounded number can become extremely high.
The birthday paradox
The birthday paradox is a common everyday problem that illustrates the non-intuitive nature of compounding.
The puzzle involves the basic question:
How many people would you need to have in a room for there to be a 50 percent chance that at least one pair shares the same birthday?
The answer is 23.
Considering there are 365 days in one year, 23 seems like a low number.
We are conditioned to think that probabilities are linear. Moreover, when we’re standing among a smaller group of people, we are likely to assume that the odds are low of them sharing our own birthday because it’s easy to think of just in relation to ourselves. It’s easy to forget all the combinations associated with other people.
If we’re among 23 people, we will think of the 22 other people and may tend to think that the odds are something like 22/365, or about 6 percent.
Or we’ll think marginally of the other combinations but underestimate how many there are. It’s difficult for our brains to process how many.
In total, there are 253 combinations, or 231 comparisons to be made of all people in the room excluding ourselves.
The fact that there are 10x the number of comparisons outside of ourselves is why we tend to underestimate.
Similarly, this is why it can be so easy to miscalculate the risk/reward of a trade.
For example, if a stock is trading at $105 and you see a 100 put expiring in two days with a premium of $5 per share, it might look tempting. Each contract, with 100 shares per contract, would provide a payout of $500 assuming the stock doesn’t decline by 5 percent or more at the end of two days.
But prices are what they are for a reason.
A company could have an earnings report coming out or some big data release between then and expiration. Or it could simply be very volatile from lots of speculative activity.
For example, Gamestop stock crashed by more than 90 percent in a few weeks after its first “meme stock” surge in 2021.
If that $105 stock crashes to $50, that’s a $5,000 loss (100 strike minus 50, multiplied by 100 shares per contract), or a $4,500 net loss taking into account the $500 premium.
In other words, a seemingly “no brainer” trade turned into a 9x loss. It can always be more (in the thousands of percent).
This goes back to the concept of expected value. It’s not always the best decision to bet on something that’s simply the most likely.
That’s the instinctive thing to do. But there may be the probability of an outcome with large downside associated with it.
It’s very easy to get risk and reward wrong on short options trades because of the convexity built into options.
Trying to understand what you’re missing
Going back to the birthday paradox, if you’re in a room with 22 other people and someone offers you a reward of $1,000 if no one in the room shares the same birthday, you might be inclined to feel pretty good about that bet if you weren’t aware of the problem.
But let’s say there’s a $1,500 penalty if one pair (or more) do share the same birthday.
We already mentioned that there’s a 50-50 chance that in a room of 23 (yourself plus 22) that two or more pairs share the same birthday.
The total number of pairs is 23*22/2 = 253 (if you’re familiar with permutations and combinations).
The chance of each pair having the same birthday is 1/365. So the odds of a pair having a different birthday is 364/365.
Therefore:
(364/365)^253 = 0.49952 = 50 percent
Taking the bet would have an expected value of minus-$250 (0.50 * $1,000 – 0.50 * $1,500) and would not be advisable to make.
Coin flipping example
Consider the world’s most famous probability event – flipping a coin.
Let’s say the following competition existed:
- If you can flip heads 10x in a row you win $10,000.
- Entrance fee is $25.
Is this competition worth entering?
Coin flip probabilities are fairly straightforward to figure out, given the probability of 50 percent. You need heads 10x in a row, so the math is:
P(heads 10x) = (½)^10 = 0.00098 = 0.098 percent
Your expected value from the game is the probability of winning multiplied by the reward, which is:
Expected value = $10,000 * (½)^10 = $9.77
This is less than the $25 entrance fee, so this is not a good game to play.
It seems cheap, like a lottery, which could be compelling given the potential reward. And getting heads 10x in a row is harder than it seems because of the exponential effect that our brains have trouble processing.
We know that flipping a coin heads has a 50 percent probability associated with it. A person might assume that flipping heads 10x in a row might be something like basic division – 50 percent divided by 10 – or around 5 percent. But because of the exponential relationship it’s very close to zero by the 10th flip. It’s already below 1 percent by the 7th flip.
An analogous situation would be paying too much for an option in trading. The premium is high relative to the expected reward.
At the same time, the entity sponsoring this game (i.e., analogously, the option seller) would need to be careful to be sure they can pay out that liability should they need to if the rare event transpires.
Even though if they do enough volume they will make money sponsoring it, there is always the risk of having to pay out on unexpected liabilities. It’s especially dangerous when the liabilities are concentrated and high relative to sensible risk parameters.
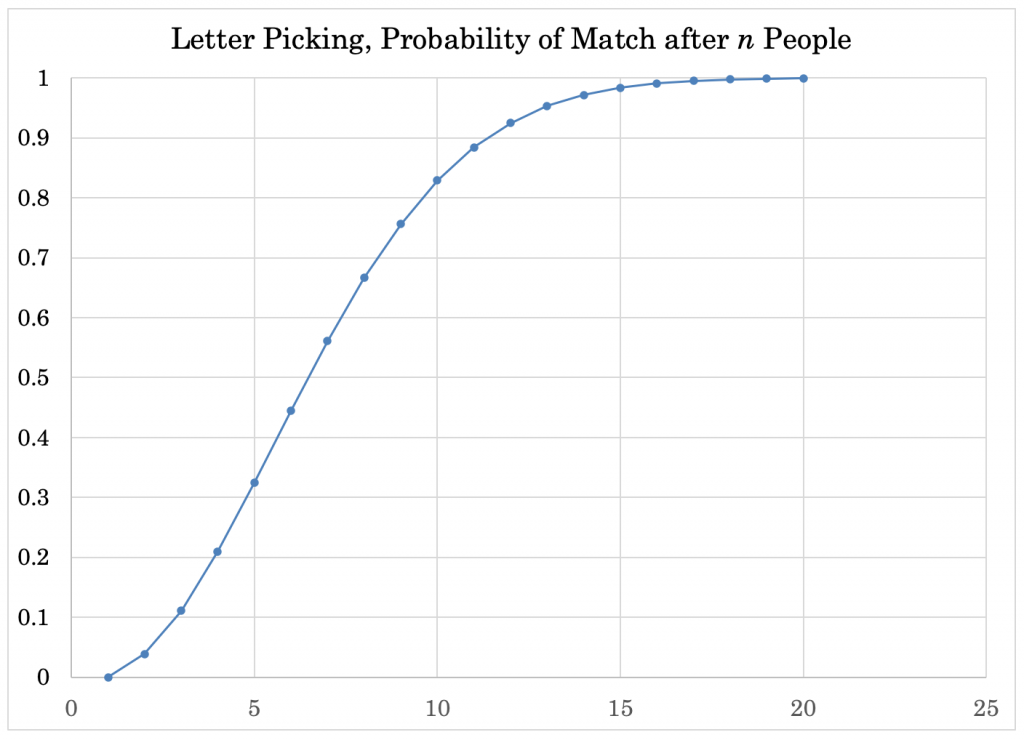
Letter picking paradox
Let’s say you have a certain number of people in a room. They are asked to each randomly pick one letter (any letter) of the alphabet, A through Z.
How many people do you need in the room before you have at least a 50 percent chance that at least one pair picked the same letter?
Seven.
Seems very low, right?
This is similar to the birthday paradox. But in this case, instead of 365 possibilities you now have only 26 (letters of the alphabet). If it took only 23 to get up to 50 percent when there were 365 possibilities, it will be lower when there are just 26.
The number of possible combinations, or pairs, with seven people in the room is: 7*6/2, or 21.
The probability of two people sharing the same letter is 1/26. So the probability of sharing a different letter is 25/26.
P(same letter, if 7 people) = 1 – (25/26)^21 = 56 percent
Conclusion
Understanding exponents and non-linearities is especially important in trading and markets.
It has applications with respect to various topics:
- Diversification and portfolio building
- The importance of avoiding drawdowns
- Options trading and applications of convexity
- Expected value
- Reward relative to risk
- Asset duration and how risk asymmetry shifts depending on yields and/or the interest rate environment
- Compounding money over time
The birthday paradox, getting a certain number of consecutive heads or tails in a coin flipping exercise, and the letter picking paradox are examples of things that are difficult for our brains to calculate.
Even something as basic as: If you took just $1 and doubled it 20 times how much would you have?
You’d have over $1 million (2 to the power of 20). If you took a dollar and tripled it 20 times, you’d have about $3.5 billion (3 to the power of 20).
We tend to underestimate or overestimate probabilities in exponential relationships because they are so non-intuitive.
This is very important to understand in trading because of the perpetual need to properly assess risk and reward. Whenever large losses are sustained in trading, it’s because risk/reward wasn’t properly evaluated.
By understanding what can go wrong and always being cognizant of what isn’t known and what can’t be known, we can take measures to be immune from those things (e.g., building a balanced portfolio that can excel or at least hold its value well in many environments) or prevent those things from happening (e.g., owning appropriate hedges).