Complex Geometry in Finance, Markets & Trading


Complex geometry – particularly fractal geometry and other advanced mathematical concepts – have unique applications in finance, markets, and trading.
These applications help model the patterns and structures in financial data in ways that aren’t normally possible (i.e., integrating the use of complex numbers) to understand market behaviors, predict trends, and manage risks more effectively.
Key Takeaways – Complex Geometry in Finance, Markets & Trading
- Complex geometry is the study of shapes, spaces, and dimensions that are governed by complex numbers, which allows for the exploration of more intricate structures and relationships than those found in traditional geometry.
- For example, complex geometry enables the representation of data where an unknown input variable raised to an even power gives us a negative number (e.g., x^2 = -1), which isn’t possible with standard numbers/geometry.
- Modeling Market Dynamics
- Complex geometry can uniquely capture relationships and patterns within models, which can enable more accurate predictions and risk assessments.
- Optimizing Portfolios
- By understanding the geometric structure of portfolios (or financial data, more generally), traders can optimize asset allocation to enhance returns while managing risk.
- Uses the curvature of the space to identify optimal allocation paths (or whatever is being modeled).
- Navigating Risks
- Complex geometry helps in visualizing and managing the multi-dimensional nature of financial risks, from market volatility to credit exposure.
- It maps these risks onto geometric constructs, which helps with more intuitive and effective risk strategies.
Here are some key concepts and applications of complex geometry in these fields:
1. Fractal Geometry in Market Analysis
Fractals are self-similar patterns that repeat at different scales.
In financial markets, price movements often exhibit fractal behavior.
Suggests that patterns in price data can repeat over time and scales.
Application
Traders use fractal geometry to identify repeating patterns in price charts, which can indicate potential points of trend reversal or continuation.
The Elliott Wave Theory is an example, which proposes that markets move in predictable waves that are fractal in nature.
2. Complex Networks in Financial Systems
Financial markets can be modeled as complex networks, where:
- nodes represent entities (such as stocks, sectors, or countries), and
- edges represent connections or correlations between these entities
Application
Analyzing the structure of these networks helps in understanding systemic risks, contagion effects, and the resilience of financial systems.
For instance, a large and densely interconnected network might be more susceptible to systemic failures.
3. Chaos Theory & Non-linear Dynamics
Financial markets are dynamic systems that can exhibit “chaotic” behavior – sensitive to initial conditions and featuring non-linear dynamics.
This means small changes can lead to vastly different outcomes and there are lots of dependencies.
This makes market movements difficult to forecast over long periods – i.e., your distributions get wider over time.
Application
Traders and analysts use chaos theory to understand market volatility and to develop trading strategies.
It underlines the importance of thinking probabilistically and using risk management techniques to cope with the high range of unknowns relative to the range of knowns relative to what’s discounted in the price.
4. High-Dimensional Data Analysis
Financial data is often high-dimensional, with many variables influencing market movements.
Techniques from complex geometry, such as manifold learning and topological data analysis, can uncover structures within this high-dimensional space.
Application
These techniques are used for dimensionality reduction, clustering, and visualization of financial data.
Helps to identify patterns, correlations, and anomalies that are not apparent in traditional analyses.
5. Option Pricing Models
Advanced models for pricing options and other derivatives often involve solving partial differential equations that describe the evolution of prices over time.
These equations can have solutions that are geometric in nature, and involve complex shapes and surfaces in high-dimensional spaces.
Application
The Black-Scholes model and its extensions use these concepts to provide theoretical prices for options by accounting for factors like volatility, time decay, and the underlying asset’s price movements.
6. Portfolio Optimization
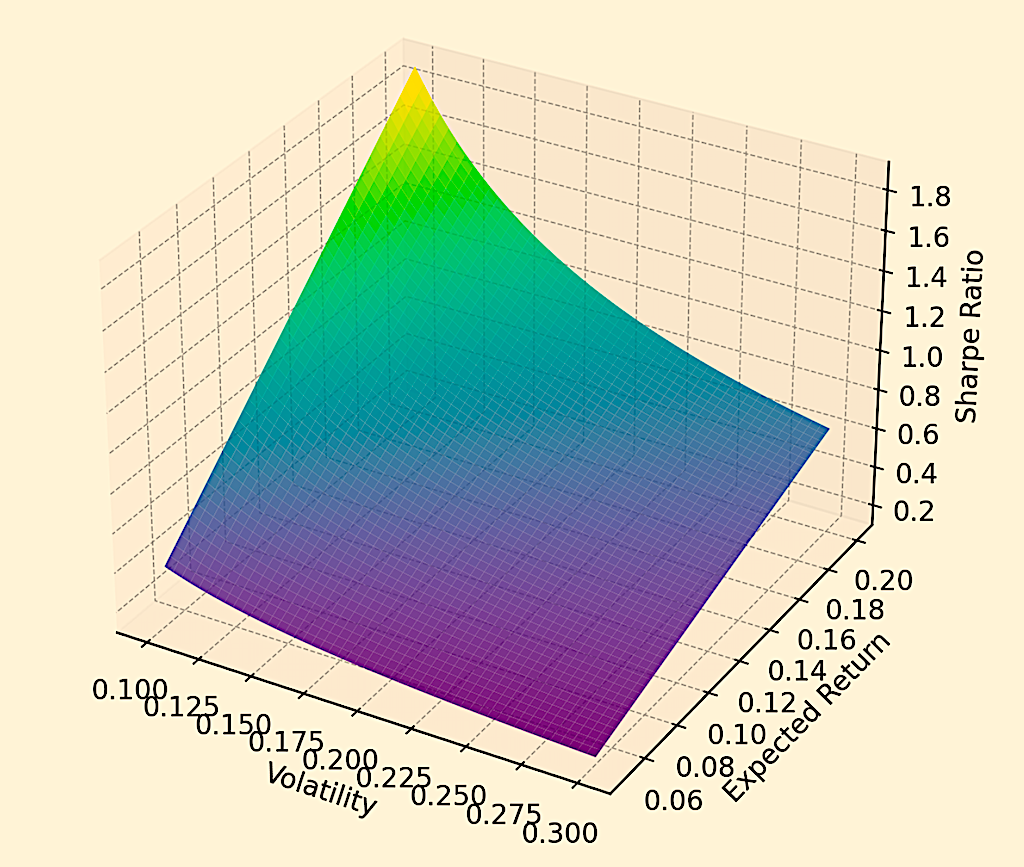
The problem of optimizing a portfolio to achieve the best possible return for a given level of risk can be framed geometrically, with solutions lying on the efficient frontier in the risk-return space.
This would be an example of a 3D manifold, showing expected return and volatility on the x- and y-axes and the Sharpe ratio on the z-axis.
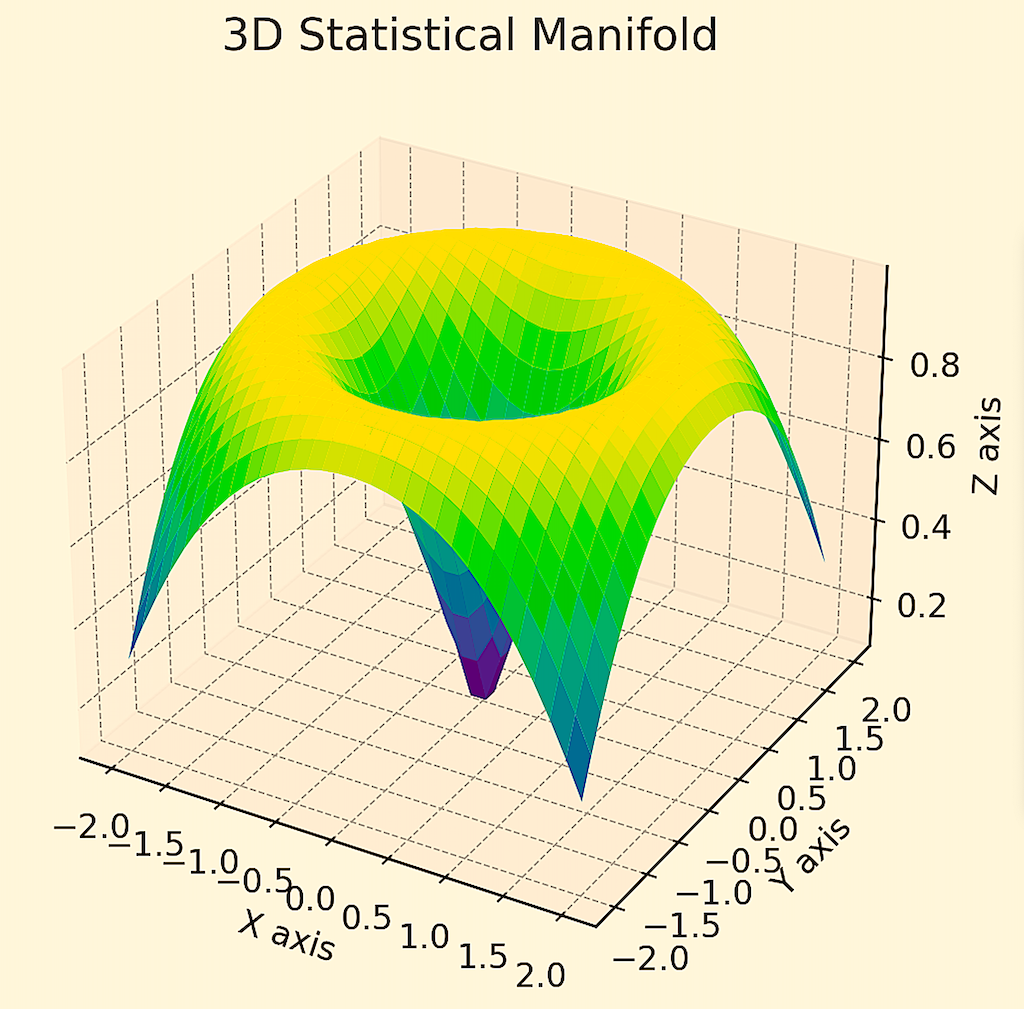
The following would be an example of a 3D statistical manifold, where getting into a higher and flatter point on the graph shows better optimization of the portfolio.
Application
Techniques from complex geometry are applied to explore this space to identify optimal portfolio allocations.
This involves balancing the portfolio across different assets to minimize risk while targeting specific return profiles.
Complex Geometry & Machine Learning in Finance and Trading
Complex geometry helps in modeling the intricate structures of financial data and market dynamics, which helps in understanding of portfolio diversification and risk management.
Meanwhile, machine learning algorithms learn from vast datasets to uncover hidden patterns, optimize trading strategies, and improve decision-making.
Together, they enable traders and analysts to improve asset allocation and minimize risks through flexible modeling and mathematical frameworks.
Coding Example – Complex Geometry in Trading
An example application of complex geometry in trading would be the optimization of a portfolio where we have an input variable raised to an even power and the solution being a negative number (e.g., short selling, where the allocation toward something is negative).
We can model the concept using Python by focusing on a simplified scenario of portfolio optimization with constraints allowing for short selling.
We’ll use Python to optimize a two-asset portfolio and incorporate complex geometry concepts by considering the possibility of assets’ returns as complex numbers, to demonstrate handling negative values – e.g., short selling in the context of certain portfolio optimization procedures.
Python Code Example
This example won’t directly visualize complex geometric manifolds but will show how to set up an optimization problem that includes the possibility of short selling, modeled through Python’s scipy.optimize for numerical optimization:
import numpy as np
from scipy.optimize import minimize

# Example returns for two assets (could be extended to include complex scenarios)
# Here we simply use real numbers for demonstration
returns = np.array([0.1, 0.2]) # Expected returns for asset 1 & asset 2

# Covariance matrix for the assets
cov_matrix = np.array([[0.005, -0.002],
                       [-0.002, 0.004]])

# Objective function to maximize (negative for minimization function) expected return
# Adding complexity by allowing for short selling, where allocation can be negative
def objective(weights):
    return -np.dot(weights, returns)

# Constraints: sum of weights = 1
constraints = ({'type': 'eq', 'fun': lambda weights: np.sum(weights) - 1})

# Bounds for each weight allow for short selling (no limit)
bounds = ((-np.inf, np.inf), (-np.inf, np.inf))

# Initial guess (equal allocation)
init_guess = [0.5, 0.5]

# Portfolio optimization
opt_results = minimize(objective, init_guess, method='SLSQP', bounds=bounds, constraints=constraints)

print("Optimal Weights:", opt_results.x)
print("Expected Portfolio Return:", -opt_results.fun)
Explanation
- Objective Function – Defined to maximize expected return; it’s negative here because minimize function seeks the lowest value.
- Constraints and Bounds – Ensure the weights sum to 1 (maintaining full investment) and allow for negative weights, representing short selling.
- Optimization – Uses scipy.optimize.minimize with Sequential Least SQuares Programming (SLSQP) method, suitable for constrained optimization problems.
This code provides a foundational approach to portfolio optimization, including elements like short selling, using Python.
While it doesn’t explicitly model the manifold or involve complex numbers directly, the concept of allowing negative weights hints at the inclusion of complex-number strategies (like short selling) in portfolio optimization.
Conclusion
The application of complex geometry in finance, markets, and trading offers a unique way for analysis, prediction, and risk management.
By exploring new ways to analyze the complexity and patterns within financial data, traders, investors, and analysts can gain deeper insights into market data and improve their decision-making processes.
Related
- Differential Geometry
- Symplectic Geometry
- Riemannian Manifolds
- Manifold Learning
- Topology
- Differential Topology
- Geometric Mechanics
- Complex Analysis