Strategic Alternatives in a Low-Return World

The low-return environment is the most important reality facing traders and investors today. We’ll briefly cover the environment and its implications, along with how to approach strategic alternatives to appropriately calibrate risks and returns.
Even before the Covid-19 pandemic, low interest rates were a fixture of the overall backdrop. The environment was as follows:
– lowest prospective returns in modern times
– asset prices that were fully priced to excessively priced (based on earnings growth, limited ability for monetary authorities to stimulate economies, returns low relative to the risk)
– pro-risk behavior encouraged given limited alternatives, which exacerbates excessive use of leverage
– a highly leveraged economy
– higher than normal geopolitical unknowns as China increasingly competes with the US technologically, militarily, economically, and in broader geopolitical ways
Altogether, these factors mean, and continue to mean, that we’re in a low-return world in which the prospective returns don’t fully compensate for the associated risks.
Forward P/E ratios of 25x or more for equities are generally approaching bubble territory, as it means forward annual earnings yields are trending at 4 percent or below. The lower yields go the harder it becomes to justify those risks.
A lot of the very high yields in stocks are in tech, in particular. Some investors are betting that their cash flows generated way out will be high, making P/E out a year a poor reflection of cash flows that are projected to transpire in the future.
But there’s also execution risk, making these cash flows more speculative. This comes with higher volatility in those particular securities and sector-wide.
More important than the absolute returns is the spread between cash and other investments.
If cash yields nothing and equities yield 4 percent, that’s essentially no different than a previous era where cash yielded ~5 percent (close to the average between 1972 and 2020 in the US) and equities provided 9 percent (1-2 percent below the average over the same period).
We can see that in the table below.
| Name | |||||||||||||||||||||||||||CAGR | ||||||||||Stdev | Best Year | Worst Year | Max. Drawdown | Sharpe Ratio |
|---|
| US Stock Market | 10.39% | 15.60% | 37.82% | -37.04% | -50.89% | 0.42 | ||
| 10-year Treasury | 7.21% | 8.03% | 39.57% | -10.17% | -15.76% | 0.34 | ||
| Cash | 4.69% | 1.01% | 15.29% | 0.03% | 0.00% | N/A |
When the yields on cash are low relative to the yields on equities – i.e., there’s a positive spread – that still suggests it’s usually prudent to move forward with risk asset strategies but with appropriate caution.
The lower the forward returns and the higher the risks, the more the markets become susceptible to exogenous shocks.
The Covid-19 situation and associated shutdowns resulted in a big drop in income.
Normally, a “crunch” goes through the credit channel. Namely, a lot of money will be needed to cover upcoming debt payments.
There isn’t enough income to service the debt, leading to asset sales (i.e., risk assets decline), cost cutting including cutbacks in labor, and a consequent downturn in the economy.
But with the pandemic, income literally just fell for a large swath of the economy. This led to a huge drop in risk asset prices and, for a while, the prices of everything aside from cash (whose value doesn’t move around much at all).
The large fall in income and spending generally occurs when the market is priced for improving conditions (as it usually is). This caused the most violent sell-off in history.
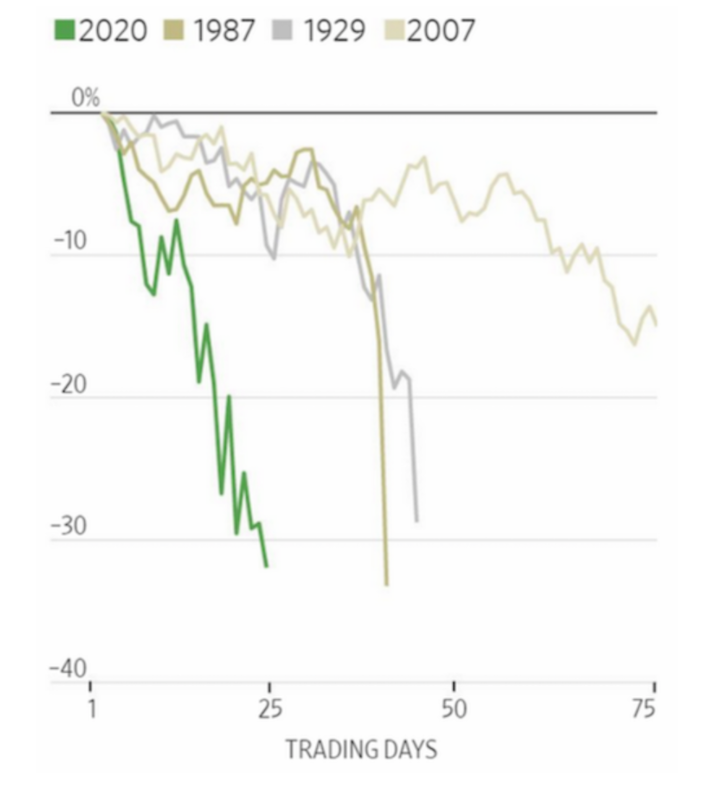
(Source: WSJ)
Moreover, those who sold out-of-the-money or far OTM derivatives had to dynamically hedge these bets (e.g., shorting stocks to cover put options that went ITM), or face being squeezed out. Many investors sold out due to cash flow problems rather than fundamentals of cheapening assets. This worsened the sell-off.
The drop, for a period, also included gold and US Treasuries, the world’s top reserve asset (as a liquid source of the world’s top reserve currency).
While Treasuries went up through the period on net, aided by Fed rate cuts, central bank asset buying, and general need for safety and liquidity, some investors needed money to cover their payments. This caused practically everything to drop. Enough of a dislocation like this can cause other traders and investors to get into issues that force more net selling.
This is where the central bank has to come in and step up money creation, liquidity support, and new credit programs, though they are more reactive than proactive and markets drop by a lot.
All portfolios, even if cash isn’t particularly attractive and the worst thing you can own over the long-term, should have some level of it.
When you have a cash buffer, you can approach portfolio declines unconcerned, with a clear mind and plenty of flexibility. Selling for cash flow reasons or having to remediate problems due to a drop in a portfolio is a bad scenario for any trader to be in.
Funds set aside for drawdowns enable you to pick up quality assets when they fall a lot, whenever they may occur.
Despite the large drop, the Covid-19 market swoon didn’t last long due to aggressive liquidity and credit support from central banks.
Similarities between post-Covid and pre-Covid markets
The post-Covid drop market and the pre-Covid market have a lot in common. The same risks exist, but also along with some new ones.
This includes:
– The ongoing fight against the virus (or viruses) in various parts of the world
– The shape of the general recovery
– The shape of the recovery for individual sectors (e.g., little disruption for many of those tied to the digital economy, while those that rely on public gatherings or in-person service will be disadvantaged)
– Taxation and redistribution programs going forward depending on political outcomes
– What the printing of trillions of dollars means for the value of money when they inevitably have to create a lot of it to fill the large debt servicing gaps
– Social tensions between the “haves” and “have-nots”, the political left and the political right, and so on
– Adequate returns are unlikely to be had using traditional investment approaches
– Generally, the only sectors that look reasonably valued are those that are most at risk. This includes oil and gas, real estate (particularly commercial and office buildings), hotels, malls and retailers, and the lowest-rated forms of credit.
– Even when the riskiest stuff might have a compelling yield – CCC has an effective yield of a bit more than 11 percent as this is written, that is not particularly cheap relative to the risks.
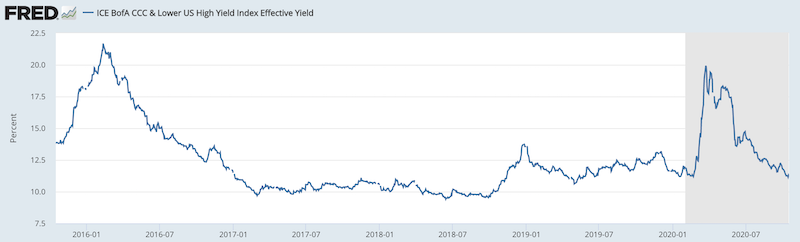
(Source: Ice Data Indices, LLC)
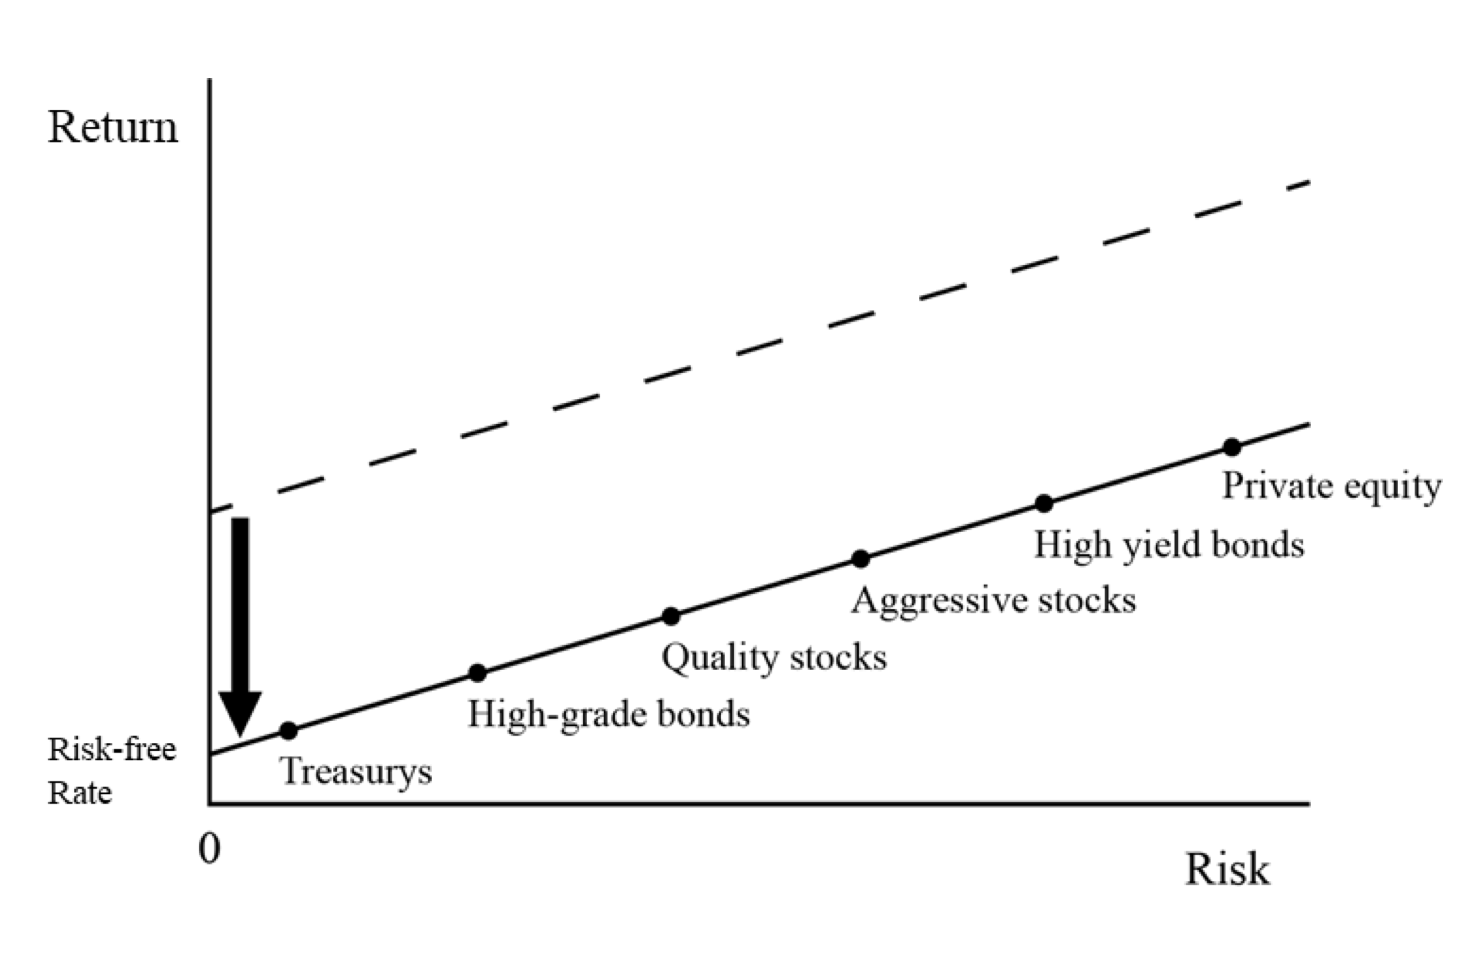
And nothing is cheap due to a very low short-term interest rate everywhere in the developed world, as the entire capital market line shifts down in conjunction.
– Bargains came and went quickly, and not many could take advantage of them given markets naturally bottom when people are most financially stressed and most in need of money as a whole.
This means traders and investors have to engage in elevated risks in order to get these types of high yields and many of these risky bets are not likely to pan out.
The yields (or implied yields in the case of stocks) of the riskiest investments like triple-C credit are that way because these companies are teetering on the precipice of bankruptcy.
Zero interest rates are the most important part of today’s environment
In finance and investing, practically everything is built off an interest rate, or a required return.
You put up a lump sum amount of money in exchange for an income stream in return that gives you a yield or rate of return.
Today’s strategic alternatives
When you have the lowest prospective returns in history, for reasons enumerated above and in other articles, you have the following strategic alternatives.
I) Invest like you always have and normally do, believing you’ll get historic returns (which you might be able to in terms of short- and medium-term considerations).
But the issue is that asset prices today are priced to provide much lower returns.
II) Invest like you always have and normally do, and settle for the low returns going forward.
This is more realistic, but not particularly appealing.
III) Reduce risk further in relation to the set of higher risks and accept even lower returns.
Keeping risk and reward in check is entirely prudent. But the reality is that if you need a certain level of returns, this may not be palatable either. This is the type of situation facing endowments, pensions, and individuals trying to take control of their own retirements, to name a few in particular.
They need to obtain a certain level of income to meet their commitments and most of these institutions will face shortfalls relative to expectations or need, which is a longer-running issue. This means either cutting benefits, obtaining more funding (e.g., getting higher cuts of worker paychecks for pensions), and/or getting help from governments.
IV) Increase risk to get higher returns. Many times, when forward returns are low and market volatility is low to moderate, various players will increase their leverage to get the desired returns on equity.
But if you need 10 percent per year and you determine that equities will yield 4 percent, that means you need to borrow $1.50 for every $1 you have in capital (2.5x leverage, or $2.50 in total capital for each $1 in equity).
Drawdowns of just 25-30 percent are not uncommon. They happen about once per decade.
Drawdowns, US equities, since 1972
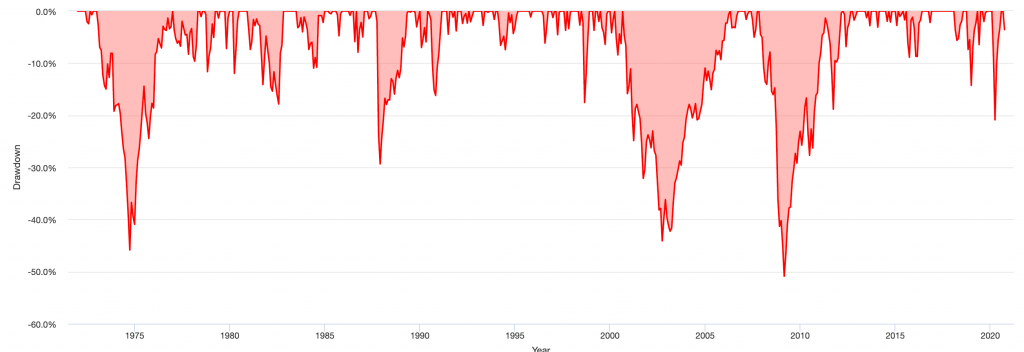
Here’s a brief history of the worst ten drawdown with respect to US equities since 1972.
| # | |||Start||||||| | End||||||| | Length|||| | Recovery By | Recovery Time | Underwater Period | Drawdown |
|---|
| 1 | Nov 2007 | Feb 2009 | 1 year 4 months | Mar 2012 | 3 years 1 month | 4 years 5 months | -50.89% |
| 2 | Jan 1973 | Sep 1974 | 1 year 9 months | Dec 1976 | 2 years 3 months | 4 years | -45.86% |
| 3 | Sep 2000 | Sep 2002 | 2 years 1 month | Apr 2006 | 3 years 7 months | 5 years 8 months | -44.11% |
| 4 | Jan 2020 | Mar 2020 | 3 months | Jul 2020 | 4 months | 7 months | -35.62% |
| 5 | Sep 1987 | Nov 1987 | 3 months | May 1989 | 1 year 6 months | 1 year 9 months | -29.34% |
| 6 | Dec 1980 | Jul 1982 | 1 year 8 months | Oct 1982 | 3 months | 1 year 11 months | -17.85% |
| 7 | Jul 1998 | Aug 1998 | 2 months | Nov 1998 | 3 months | 5 months | -17.57% |
| 8 | Jun 1990 | Oct 1990 | 5 months | Feb 1991 | 4 months | 9 months | -16.20% |
| 9 | Oct 2018 | Dec 2018 | 3 months | Apr 2019 | 4 months | 7 months | -14.28% |
| 10 | Mar 1980 | Mar 1980 | 1 month | Jun 1980 | 3 months | 4 months | -11.98% |
With higher than normal risks, drawdowns will occur.
If you’re leveraged 2.5x with a plain long-only equities allocation (to try and get around 10 percent annually), those 25-30 percent drawdowns turn into drawdowns of 60 percent or more.
And the larger the drawdown the harder it is to dig yourself back out.
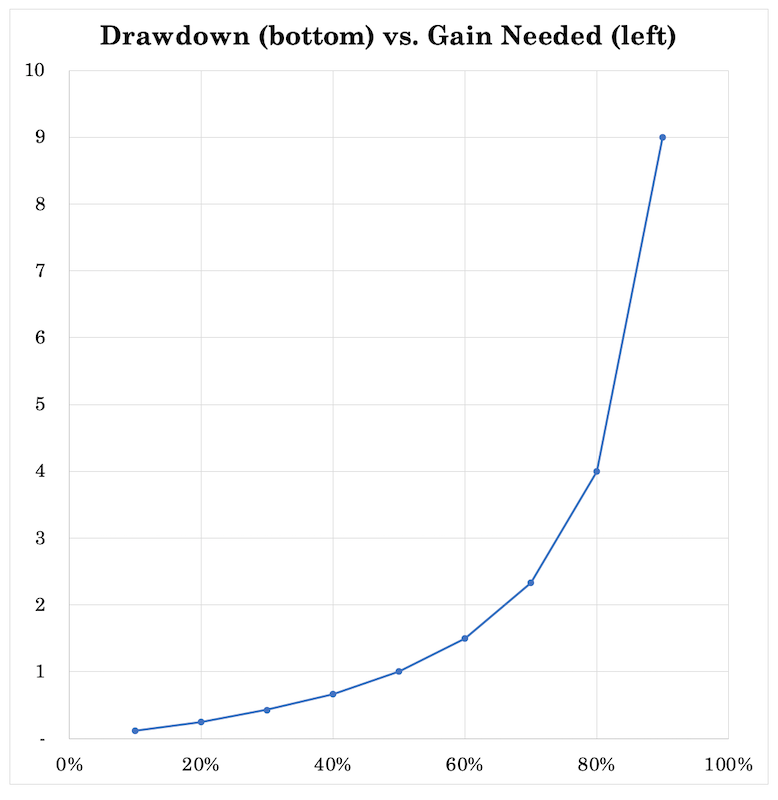
With a 10 percent drawdown, you need just an 11 percent gain to get back to where you were. With a 60 percent drawdown, you need to gain back 2.5 times your new lower portfolio value. That can take decades, if ever, so it’s especially important to avoid drawdowns.
You can notice the larger the drawdown, the larger the gain, in a steepening, non-linear way.
This type of “increase your risk” approach is also crowded, especially when volatility subsides and yield becomes a more important factor to investors than risk. More leverage enters the financial system, which compounds risks further and tends to magnify moves back in the other direction.
V) Wait for a correction and hang out in a lot of cash.
Most institutions can’t do this. And going to mostly cash or all cash is extreme.
Plus you’d have a zero or negative nominal return, depending on where you are. And you’d have a negative real return with the erosion in spending power over time.
At the same time, you’re waiting for an opportunity to buy cheaper assets that may never come.
It is possible that whenever an index is at its current level, you’ll never see the index that low ever again. Or it could perhaps be lower far out in the future, but you still earned nothing or little over that period.
Most institutions involved in managing money have to take some level of risk or they’ll never meet the obligations or expectations of their clients. Nobody will pay to sit around in cash.
When cash is the best asset, it only is for short periods. Economies have issues if cash isn’t being used to create goods and services of higher value.
Even if you’re investing or trading for yourself, you have to have enough in assets that will grow or at least preserve your wealth depending on what you’re trying to do.
VI) Try to obtain alpha
This seems like a no-brainer by picking the right securities and/or allocating to the right investment managers.
This could mean branching into private investments (real estate, internet or digital investments, timberland) and other markets where alpha might supposedly exist and provide higher and potentially more reliable streams of income if you or those you hire have the requisite skills to manage these investments well.
This introduces illiquidity into a portfolio along with execution and manager risk. It can provide higher returns, but comes with extra risks due to the extra skills and abilities needed.
You can also move into more liquid alternative strategies, such as risk premiums related to volatility. But this is also a matter of management expertise as a more actively traded strategy.
Some investors might also target lower-risk equities like consumer staples and utilities for the risk asset portion of their portfolios.
People always need these services irrespective of what’s going on in the world. So, the cash flows tend to be more stable and the return a bit better in relation to the risk.
They also aren’t as reliant on interest rate cuts to get a floor under their earnings and stock in a downturn. Accordingly, certain equities can be considered stores of wealth.
With economic shocks like a pandemic, the distribution of outcomes among different companies is very different.
There’s a big impact on spending in different sectors in the economy and less so in others.
Sectors that were very hard hit like airlines, travel, or restaurants see very large impacts.
Even if unemployment is “only” ten percent (the level it peaked at in the US during the 2008 financial crisis), then you see huge declines in earnings in these sectors down to zero or very close to it.
Things like durable goods sales are somewhere in the middle of the spectrum. Staples like food, basic medicines, and personal care products are a lot less disrupted, as people always need these things to live.
Building a better portfolio
In a world of zero interest rates (at least throughout developed markets), you have continuous policy asymmetry to economies and markets.
Namely, interest rates can’t go down much to stimulate growth in the markets or economies, but there’s no limit to how high they can go.
This makes holding securities with safer, more predictable cash flows more important than normal. As mentioned, some industry groups will be affected quite a bit, but some won’t be nearly as impacted to the same extent.
Bonds are no longer going to give you much outside being viable as a source of liquidity and diversification.
Having some amount of inflation-linked bonds could be useful given there’s no technical limitation to how low real yields can go (nominal yields minus inflation).
This is unlike standard nominal bonds, which have practically no value for income generation but still have the downside.
Forming a bond proxy through a well-diversified basket of equities where their underlying businesses sell essential products could be a reasonable alternative.
You can be sure that certain everyday products like food and all the basics are always going to be in demand. It’s a reality that some sectors are going to be more reliable than others.
For example, as this article was being written, it was a down day for the stock market.
Cyclicals like consumer discretionary (e.g., ETF ticker XLY), materials (XLB), industrials (XLI), and energy (XLE) sold off. On the other hand, consumer staples (XLC) and utilities (XLU) only sold off only 0.50x-0.75x as much.
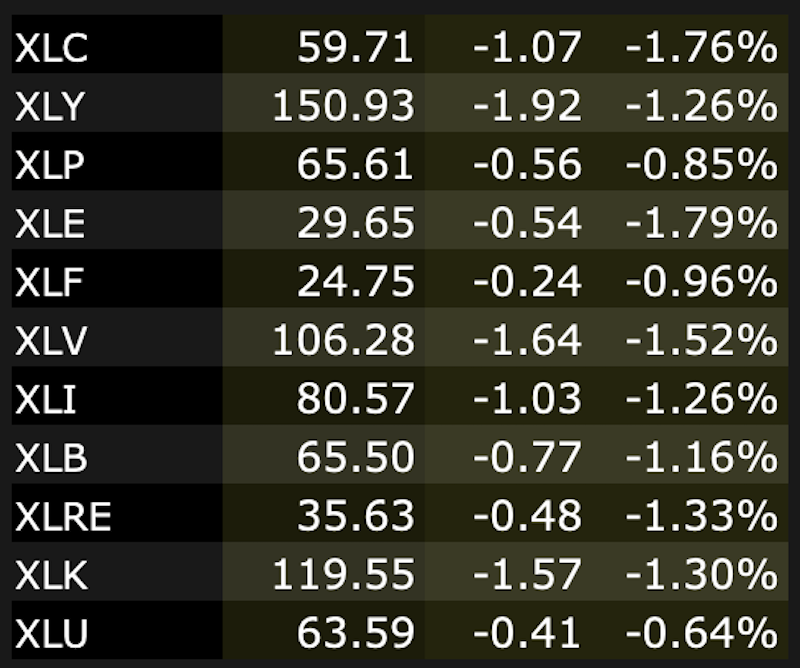
The companies selling the everyday basic products have a more or less steady path of demand spending associated with them. As a result, the companies that provide these goods and services tend to have fairly steady revenue and earnings streams.
They’re probably not going to be the most exciting investments over time like bonds (what they could take the place of to an extent). But they do tend to routinely grow their earnings and provide a little bit more than bonds.
There will be more volatility to them than most standard bonds. The cash flows of equities go on forever in theory, unlike bonds that typically have a fixed maturity. This perpetual nature gives stocks a longer duration so there will still be greater structural price volatility relative to most types of bonds.
But you can get something that can replace a bond-like income stream over time by strategically choosing which companies or sector baskets (through ETFs or otherwise) to include in your portfolio over time that fit the general theme.
Bond replacement portfolio
If you were trying to get a portfolio that could give you an earnings stream from stocks that could look similar to the coupon distributions on a bond over time (i.e., steady, predictable), how would you do this?
The most stable earnings streams in the market are generally in three main sectors:
– consumer staples
– utilities
– healthcare (depending on what you include, as it’s a diverse industry)
With consumer staples, consumers always need to buy the basics in terms of food, personal care items, toothpaste, aspirin, etc.
With utilities, people will always have a need for water and sewer, electricity, heating, and so on.
Healthcare is known as an elastic good. People will always have the demand to keep themselves in good enough health to remain functional.
A lot of this gets down to basic human needs.
All three sectors have comparable levels of volatility. And all have popular ETFs assigned to them with track records dating back more than two decades.
This means we don’t necessarily have to pick individual securities in each and can get broad exposure through the ETF.
The usefulness of an ETF is in being able to get sector-wide exposure and trade macro themes quickly and efficiently. Instead of having to buy dozens or hundreds of stocks to get ample diversification, you can buy an ETF and get the exposure efficiently and in one shot. Lots of large institutions also use ETFs for strategic exposure.
The companies that exist at any given point in time changes regularly, and ETFs also provide the advantage of providing access to indices, which involve survivorship bias. Poorly performing companies get booted from them all the time, while better performing ones get inclusion.
It also means we can backtest a “stable earnings” basket through several recessions and big market downturns to see how it held up versus the broader market.
For purposes of simplicity, and for reasons related to similarities in volatilities, we can split this “bond proxy” basket into three equal pieces and allocate utilities, consumer staples, and healthcare to each.
If we do a risk decomposition of that three-ETF portfolio, equal money-weighted allocations to each also give roughly equal risk allocation.
| Ticker | Name |
|---|
| XLP | SPDR S&P Consumer Staples ETF | 30.46% | |
| XLU | Utilities Select Sector SPDR ETF | 35.90% | |
| XLV | Health Care Select Sector SPDR ETF | 33.64% |
Then we can compare this to the S&P 500, the broad market benchmark.
Portfolio matchup
Portfolio Allocations
| Ticker | Name | Allocation |
|---|---|---|
| XLP | SPDR S&P Consumer Staples ETF | 33.34% |
| XLU | Utilities Select Sector SPDR ETF | 33.33% |
| XLV | Health Care Select Sector SPDR ETF | 33.33% |
| Ticker | Name | Allocation |
|---|---|---|
| SPY | SPDR S&P 500 ETF Trust | 100.00% |
Portfolio Returns
| Portfolio | Initial Balance | Final Balance | CAGR | Stdev | Best Year | Worst Year | Max. Drawdown | Sharpe Ratio | ||
|---|---|---|---|---|---|---|---|---|---|---|
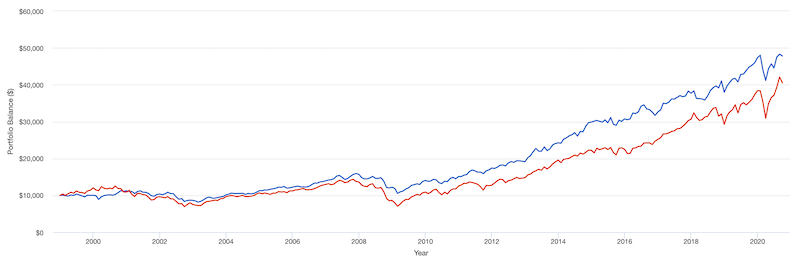
| “Bond proxy” | $10,000 | $47,814 | 7.46% | 11.15% | 26.92% | -22.42% | -33.82% | 0.54 | ||
| Stocks | $10,000 | $40,524 | 6.65% | 14.94% | 32.31% | -36.81% | -50.80% | 0.39 |
These statistics go back to January 1999 (when all four ETFs started trading simultaneously) through October 2020.
Overall, we see better overall returns over time and shallower drawdowns of the “bond proxy” portfolio. Volatility is cut by a bit more than 25 percent. That worst year is only 3/5th as deep. The max drawdown is only two-thirds as deep.
The Sharpe ratio is 38 percent better. The Sortino ratio (not shown, but emphasizes the minimization of downside volatility, unlike the Sharpe ratio) is 39 percent better.
The correlation to the market is also only 0.72, with a beta of just 0.52. A lower beta is generally better, as it shows less reliance on positive stock market movement to generate returns.
Portfolio Growth (blue line = “bond proxy; red line = stocks)
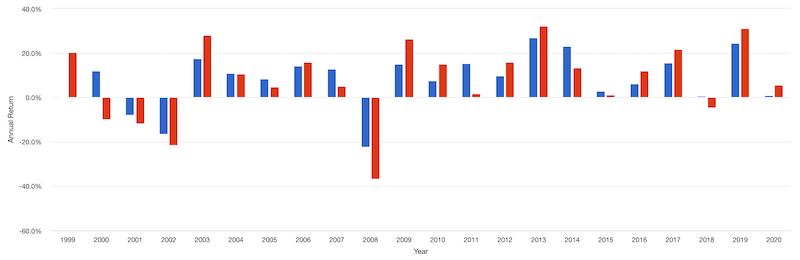
Annual returns (blue line = “bond proxy; red line = stocks)
Drawdowns for Historical Market Stress Periods
| Stress Period | Start | End | Bond Proxy | Stocks |
|---|---|---|---|---|
| Dotcom Crash | Mar 2000 | Oct 2002 | -25.82% | -44.71% |
| Subprime Crisis | Nov 2007 | Mar 2009 | -33.82% | -50.80% |
Drawdowns for Bond Proxy
| # | Start | End | Length | Recovery By | Recovery Time | Underwater Period | Drawdown |
|---|
| 1 | Dec 2007 | Feb 2009 | 1 year 3 months | Apr 2011 | 2 years 2 months | 3 years 5 months | -33.82% |
| 2 | Nov 2000 | Feb 2003 | 2 years 4 months | Feb 2005 | 2 years | 4 years 4 months | -27.49% |
| 3 | Feb 2020 | Mar 2020 | 2 months | Aug 2020 | 5 months | 7 months | -14.24% |
| 4 | Jul 1999 | Feb 2000 | 8 months | Sep 2000 | 7 months | 1 year 3 months | -13.89% |
| 5 | Aug 2016 | Nov 2016 | 4 months | Feb 2017 | 3 months | 7 months | -8.29% |
| 6 | Dec 2018 | Dec 2018 | 1 month | Mar 2019 | 3 months | 4 months | -7.44% |
| 7 | Jun 2007 | Jul 2007 | 2 months | Oct 2007 | 3 months | 5 months | -7.14% |
| 8 | Aug 2015 | Sep 2015 | 2 months | Mar 2016 | 6 months | 8 months | -6.84% |
| 9 | Feb 2018 | May 2018 | 4 months | Jul 2018 | 2 months | 6 months | -6.47% |
| 10 | Jun 2011 | Sep 2011 | 4 months | Nov 2011 | 2 months | 6 months | -5.73% |
Drawdowns for Stocks
| # | Start | End | Length | Recovery By | Recovery Time | Underwater Period | Drawdown |
|---|
| 1 | Nov 2007 | Feb 2009 | 1 year 4 months | Mar 2012 | 3 years 1 month | 4 years 5 months | -50.80% |
| 2 | Sep 2000 | Sep 2002 | 2 years 1 month | Nov 2006 | 4 years 2 months | 6 years 3 months | -44.71% |
| 3 | Jan 2020 | Mar 2020 | 3 months | Jul 2020 | 4 months | 7 months | -19.43% |
| 4 | Oct 2018 | Dec 2018 | 3 months | Apr 2019 | 4 months | 7 months | -13.52% |
| 5 | Aug 2015 | Sep 2015 | 2 months | May 2016 | 8 months | 10 months | -8.48% |
| 6 | Apr 2012 | May 2012 | 2 months | Aug 2012 | 3 months | 5 months | -6.63% |
| 7 | Jan 2000 | Feb 2000 | 2 months | Mar 2000 | 1 month | 3 months | -6.43% |
| 8 | May 2019 | May 2019 | 1 month | Jun 2019 | 1 month | 2 months | -6.38% |
| 9 | Feb 2018 | Mar 2018 | 2 months | Jul 2018 | 4 months | 6 months | -6.28% |
| 10 | Jul 1999 | Sep 1999 | 3 months | Oct 1999 | 1 month | 4 months | -5.76% |
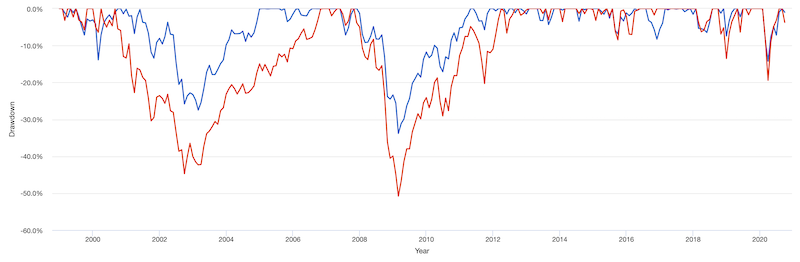
You can observe shallower drawdowns for the bond proxy:
Drawdowns (blue line = “bond proxy; red line = stocks)
Rolling returns
Rolling returns are also much better.
| Roll Period | Bond proxy | Stocks | ||||
|---|---|---|---|---|---|---|
| Average | High | Low | Average | High | Low | |
| 1 year | 8.43% | 26.92% | -22.42% | 8.19% | 32.31% | -36.81% |
| 3 years | 7.69% | 19.71% | -4.85% | 6.34% | 20.31% | -14.52% |
| 5 years | 8.09% | 16.29% | 0.30% | 6.70% | 17.85% | -2.38% |
| 7 years | 8.36% | 14.12% | 2.37% | 6.79% | 14.70% | -1.53% |
| 10 years | 7.83% | 12.91% | 2.00% | 6.06% | 13.44% | -1.49% |
| 15 years | 8.30% | 10.32% | 6.08% | 6.68% | 9.82% | 4.17% |
More in-depth metrics of each
| Metric |
|---|
| Bond Proxy | Stocks | |
|---|---|---|
| Arithmetic Mean (monthly) | 0.65% | 0.63% |
| Arithmetic Mean (annualized) | 8.13% | 7.84% |
| Geometric Mean (monthly) | 0.60% | 0.54% |
| Geometric Mean (annualized) | 7.46% | 6.65% |
| Volatility (monthly) | 3.22% | 4.31% |
| Volatility (annualized) | 11.15% | 14.94% |
| Downside Deviation (monthly) | 2.19% | 2.95% |
| Max. Drawdown | -33.82% | -50.80% |
| US Market Correlation | 0.72 | 0.99 |
| Beta(*) | 0.52 | 0.96 |
| Alpha (annualized) | 3.63% | -0.14% |
| R2 | 52.33% | 97.85% |
| Sharpe Ratio | 0.54 | 0.39 |
| Sortino Ratio | 0.78 | 0.56 |
| Treynor Ratio (%) | 11.67 | 6.09 |
| Calmar Ratio | 0.64 | 0.63 |
| Active Return | 0.38% | -0.43% |
| Tracking Error | 10.67% | 2.29% |
| Information Ratio | 0.04 | -0.19 |
| Skewness | -0.86 | -0.53 |
| Excess Kurtosis | 1.67 | 1.03 |
| Historical Value-at-Risk (5%) | -5.55% | -7.84% |
| Analytical Value-at-Risk (5%) | -4.62% | -6.46% |
| Conditional Value-at-Risk (5%) | -7.91% | -9.73% |
| Upside Capture Ratio (%) | 57.22 | 93.80 |
| Downside Capture Ratio (%) | 45.28 | 95.19 |
| Safe Withdrawal Rate | 6.02% | 5.14% |
| Perpetual Withdrawal Rate | 5.11% | 4.36% |
| Positive Periods | 160 out of 261 (61.30%) | 163 out of 261 (62.45%) |
| Gain/Loss Ratio | 1.07 | 0.87 |
In many ways, we can see that the “bond proxy” basket has outperformed the broader market (stock market) with better returns at lower risk with less correlation to the market and a better gain/loss ratio.
It might not be the fanciest portfolio allocation that’ll provide big gainers or much thrill seeking.
But getting fairly steady growing accumulations of earnings is certainly a reasonable strategy over time, especially when other strategic alternatives are not very palatable.
This is especially true in a period where companies with cyclical cash flows may struggle when central banks lack the ability to ease monetary policy when they need to going forward.
This portfolio construction could help create a bond-like alternative or at least a hybrid bond-equity mix if it’s engineered efficiently. It could be a type of product to integrate into one’s portfolio.
No free lunch
Nothing is totally satisfactory and free from downside from either a risk or return perspective.
How should you balance defensiveness and aggressiveness?
Should you be more defensive in light of the higher than normal risks, forcing you to settle for lower expected returns?
Or should you be more offensive because low returns in combination with the types of returns you need might loosely require this approach?
Having balance and diversification in particular is more important than normal. Mathematically, when done well, you get more return per unit of risk.
We covered this in a previous article on how to build a balanced portfolio (plus a stocks-only version), involving adopting a risk-neutral approach to the markets to derive a portfolio that can perform well in all economic environments.
Conclusion
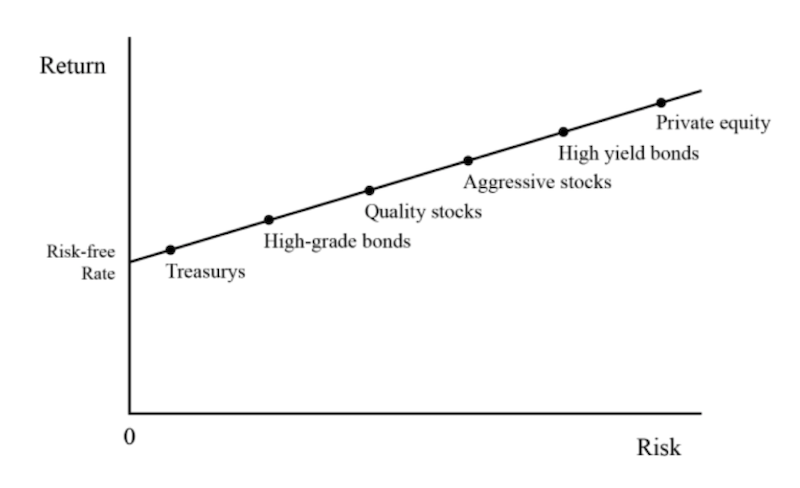
Prices aren’t extremely high in relative terms because of where interest rates are priced. In terms of the “capital market line” (conceptual illustration below), stocks return above bonds, which return above cash by roughly the appropriate risk premiums. This relationship is one of the main three market and economic equilibriums.
Central banks want interest rates that way and are determined to leave them that way to keep weak and highly leveraged economies going.
This makes the markets and economy susceptible to shocks, whatever they might be and however they might ultimately transpire.
With such above normal risks, as a trader or investor you would normally want to be compensated for taking them.
Yet it’s the opposite. When governments have to keep interest rates low and will keep them low by buying as many fixed income securities as they need (and some equities and equity-like products depending on where you go), the private sector is forced to deal with these lower absolute returns relative to the risks.
Investors can choose to “sit it out”, invest as normal, or take higher than normal risks. But when risk/reward is out of whack on traditional long-only investing, all of those approaches are unappealing.
This forces traders and investors into other strategies, like alternative risk premia. Or various types of private investments where they need to make trade-offs involving lower liquidity and with such investments requiring different types of specialized skills and management approaches.
Adopting more balanced, risk-neutral approaches are also more important than normal as a way to increase return per each unit of risk.