How to Invest in Volatile Markets

From 2009 to the early part of 2020, investors enjoyed a steady ride with volatility below historical norms. Going forward traders will need to adapt and learn how to invest in volatile markets. The process that boosted asset prices over the past eleven years (low interest rates and central bank purchases) will not be as effectively looking ahead.
Most investors, naturally being biased long their domestic equities markets, got burned during the coronavirus crash. Many were over-extended, essentially betting on the economy continuing to get better while it got worse.
Some will take a while before their confidence returns. Economic re-openings will be slow, partial, and fitful, and a vaccine likely won’t be available until the second half of 2021.
How to invest in volatile markets
Market volatility is another one of those things where you have to go opposite your instincts to manage it well. It’s the same concept as how traders typically view assets depending on what direction they’re moving.
For example, when the price of an asset goes up, the normal reaction is that it’s a better investment rather than a more expensive investment.
Our behavior governing the purchase of financial assets is typically diametrically opposed to our behavior buying anything else.
When an item we want goes down in price (a sale or whatever it might be), we perceive it as a better value.
When a financial asset goes down in price, we perceive it as worse or a riskier investment.
In some respects, you could argue that financial assets are treated by many as what economists call “Giffen goods” – i.e., our desire for it increases the more its price goes up. Bitcoin could also potentially be thought of this way. When people heard it was going up, more were inclined to buy it for fear of missing out. When Tesla was going up before the coronavirus crash, it’s popularity increased on Robinhood. People hear about some type of asset making people a lot of money and many are inclined to hop in.
This is, of course, probably not a good idea. People who buy toward the tops of bubbles (e.g., Japan in the late-80s, tech in the 1998-2000 period, US housing in 2007, Bitcoin in 2017) will tend to stay underwater for years if not permanently.
Chances are they don’t realize it’s a bubble, because they believe it’s a new paradigm, even if it becomes obvious in retrospect. Moreover, many investors get flushed out of the investment when it drops either due to cash flow reasons or to get rid of the pain associated with holding a volatile investment that’s performed terribly in the recent past.
Low volatility regimes can also spur this type of behavior where low volatility causes investors to grossly underestimate their risk and high volatility causes traders to become overly cautious.
The same concept applied to volatility
The concept is analogous.
When volatility is low, yield is more important to investors and they feel more comfortable taking risk. So, risk premiums get bid down.
Accordingly, both discretionary and mechanical strategies tend to leverage up to magnify smaller premiums into the desired return on equity. More placid environments tend to sow the seeds of their own demise because of the buildup of that leverage. Reactions become magnified in the opposite direction.
When volatility is higher, as it’s been since the coronavirus effects started being priced in, yield is less important relative to the risk. Capital preservation becomes more important and cash flow constrained investors sell in order to raise cash. So, risk premiums fall, people deleverage, and assets become cheap.
Naturally, many investors will want to shift their capital around as risk premiums ebb and flow to get the best return relative to their risk – i.e., move into assets who risk premiums are expanding (asset prices falling) and sell as the risk premiums contract (asset prices rising).
Risk premium are the concept of the returns of one asset class relative to another.
What is the return on bonds relative to cash?
What is the return on stocks relative to bonds?
There are various ways of doing this. Below is one interpretation.
It is one of the big three market equilibriums that is part of the mechanics of how economies and markets work.
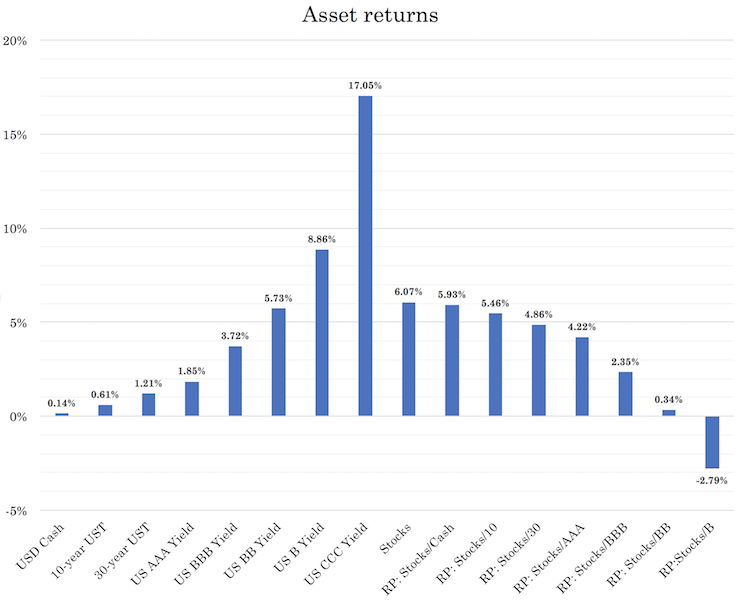
It shows the current yields and risk premiums (“RP”) between different asset classes for USD assets.
It shows that cash and short-term bonds provide very low returns. For the Fed – and other developed market central banks – to enact their programs, they’ve had to make cash and bonds unattractive to get investors into the types of assets that will help finance spending.
Stocks don’t have traditional yields like cash and bonds. In the case of the latter two instruments, those can be determined by looking at their interest rates. Cash pays a yield roughly on par with the short-term rates offered by the central bank. Bonds pay a yield based on their periodic coupon payment relative to their current price.
The “yield” of stocks can be thought of as the expected earnings relative to the price. Essentially, it’s the reciprocal of the forward P/E ratio.
If the forward P/E ratio is 16, then stocks “yield” the reciprocal of that, or just over 6 percent. If you compare that to a risk-free bond of similar duration yielding just under 1 percent, that risk premium is 5-5.5 percent.
Historically the excess return of stocks over the 10-year Treasury has been close to 3 percent, and the return of stocks over cash at about 5 percent.
Stocks typically cheapen when volatility is higher as people want more compensation to hold them.
In the chart above, the forward return of stocks is estimated at 6.07 percent. This basically assumes that corporate earnings will get back to their normal level within one year (170 on SPX).
Is this too optimistic? It could be, given how far we still need to go to get the economy reopened.
Stock market volatility: The large cap vs. small cap gap
There are divergences within asset classes.
At the end of business cycles, many investors rotate away from cyclicals (e.g., autos, manufacturing, consumer discretionary, banks, homebuilders, shipping) and toward companies with more stable revenues and earnings (e.g., consumer staples, healthcare, utilities).
The same also goes for the size of a company in terms of investors’ preferences for small cap and large caps. Larger, more diversified companies tend to do better toward the latter stages of the business cycle and through the violence of a downturn than smaller, less diversified companies.
In terms of stock market volatility, the plunge in small caps has been especially hard.
US small caps, via the Russell 2000 index, fell 43 percent in a few weeks peak to trough, deeper than the 36 percent by the S&P 500, which is virtually a large cap index. Moreover, small caps haven’t hit a new high since August 2018.
Small cap underperformance pre-dated the coronavirus crisis. Below shows a Russell 2000/S&P 500 chart (i.e., small cap index divided by large cap index):
Russell 2000 / S&P 500
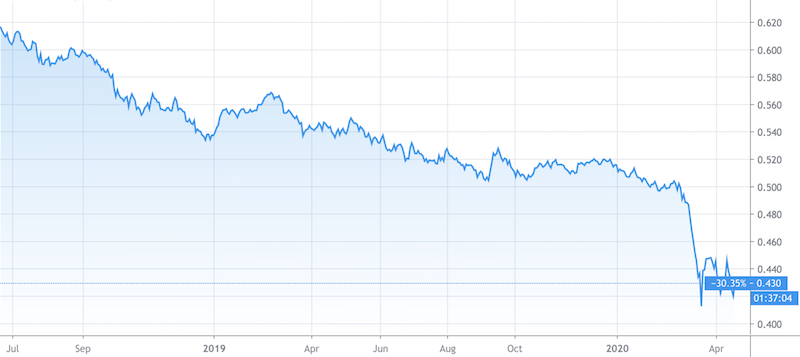
(Source: Trading View)
Small caps are generally defined as those have a market capitalization of $2 billion or under.
They tend to be less diversified, are less international (exposing them to fewer markets and diversification opportunities), have less revenue, and tend to be more leveraged. This exposes them more to economic downturns than larger companies. They are also less liquid to trade than large cap companies
They lagged behind in the past two years as investors had concerns over how US-China trade tensions would impact their business. Moreover, investors believed that small caps would be riskier to own later in the cycle due to these characteristics. Accordingly, they missed out on the S&P 500’s march to new records in 2019 and into early 2020.
The portion of small caps that don’t make money and have high debt levels has been rising. March 2020 marked the worst month for small caps since October 1987. Nearly 100 percent of the stocks fell and more than 85 percent suffered declines of more than 20 percent.
The fall was the fastest on record into bear market territory, surpassing all other well-known bear markets 2008 (subprime lending), 2000 (tech bubble), 1987 (heavily a one-day event), and market episodes from the Great Depression and World War II period from 1929-1945.
Given the nature of an economic shutdown excluding the most essential services, the market rout has been broad and spanned across sectors.
As of the end of February 29, based on BofA Global Research and FactSet data, the share of Russell 2000 companies that aren’t profitable stood at 29 percent, the highest since November 2009 when 31 percent had negative earnings. That number has surely spiked since the Covid-19 effects shut down large portions of economic activity.
How most investors can win in the markets
Actively trading based on what assets are cheap or expensive relative to one another based on their risk premiums is not easy to do because it requires a level of timing.
Most investors should have a well-balanced portfolio that can extract risk premia throughout the cycle and is not biased toward any one environment.
Every asset class has an environmental bias.
Stocks do well when growth is above expectation and inflation is low to moderate.
Government bonds of the reserve currency countries do best during deflationary recession.
Gold does best when real interest rates are low and/or during periods of geopolitical uncertainty.
Commodities do best during inflationary periods.
Cash does best when money and credit are tight (basically periods where the higher-returning assets do poorly because not enough capital is available to buy them, leading to too many sellers relative to buyers).
Environmentally biased portfolios inevitably have horrific drawdowns. They are structured to excel in a particular environment and invariably do poorly when the environment shifts.
Mixing assets well improves your return per each unit of risk and will lower expected drawdowns, shorten underwater periods, provide lower left-tail risk, among a host of other benefits.
Limiting left-tail risk is basically the idea of limiting how much you can lose. We like to diversify across different asset classes, countries, and currencies. When doing this in a prudent way the risk shifts from: “will the US stock market hold up?” to “will this allocation outperform cash?”
One thing we can be pretty sure over time is that financial assets will outperform cash. That’s a risk you can feel pretty comfortable taking.
During times when that isn’t true (for a brief period in late February and early March 2020 as the coronavirus issues were flaring up) policymakers have big incentives to get the system going again to get money flowing back into assets. Central banks will do practically anything to save the system – lowering interest rates, buying financial assets of various forms, and backstopping all sorts of collateral.
Below is a drawdowns maps of a simple portfolio 25% stocks / 40% intermediate government bonds / 20% cash / 15% gold portfolio (blue line; diversified) against a 100% stocks portfolio (red line; non-diversified).
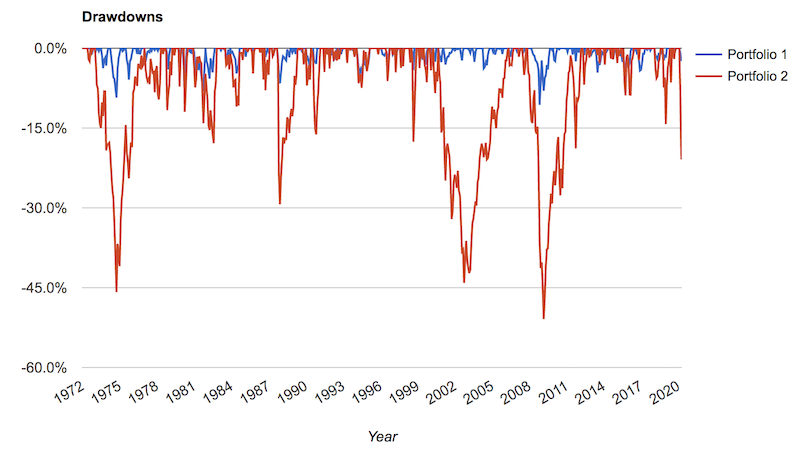
The bond allocation is typically done through bond futures, as it requires less capital outlay. Mixing assets well typically allows you to get equity-like returns at 30-40 percent of the risk, or better than equity returns at the same risk or some permutation thereof, depending on your leverage. The amount of leverage required to design a portfolio like this is very low.
If investors can look at leverage without black-and-white preconceptions – “no leverage is good and any leverage is bad” – they will see that a moderately leveraged, highly diversified portfolio is considerably less risky than an unleveraged, non-diversified one.
We won’t go too much more in depth here, as this topic was covered in our article of how to build a balanced portfolio.
Higher than normal volatility will remain for awhile
Covid-19 has had a clear devastating effect on the US economy. This came at the same time US equity markets were at all-time highs and most traders were positioned for the economy to continue its expansion, which had lasted eleven years, the longest in the history of the country.
Various economic indicators have posted their largest declines ever. This includes retail sales, the New York Fed’s general business conditions index, and the NAHB housing market index. March’s decline in industrial production was the worst in over 70 years.
The economy will recover, but it will take time. It’s impacted incomes and balance sheets – i.e., for most entities, savings and assets have been hit while liabilities have remained the same or gotten worse.
Those pockets of financial destruction need to be filled by money and credit. Unlike in 2008 when it was the banks that had the leveraging problems, policymakers had to go through and figure out which banks they wanted to save and which ones they could afford to let fail. In 2020, it’s practically all businesses taking a hit because large swaths of the economy have been shut down.
Nominal US retail sales dropped 8.7 percent in March. That was the largest drop since the data set began.
Motor vehicle and parts sales fell 25.6 percent, which caused total retail sales to drop 4.2 percentage points. Excluding the effect of autos, retails sales were down 4.5 percent in March.
The impact of retail store closures and social distancing hit retail sales in March and will continue to weigh in April and a couple months thereafter.
Manufacturing data is also terrible. Industrial production declined 5.4 percent in March. That’s the largest drop since 1946. As motor vehicle and parts plunged 28 percent, manufacturing industrial production fell 6.3 percent in March. Excluding autos, industrial production dropped 4.5 percent in March (it had also fallen in January and February).
The Empire State manufacturing survey’s general business conditions index plunged to -78.2 in April, from -21.5 in March. This was the largest monthly drop and lowest level since the dataset’s inception in 2001.
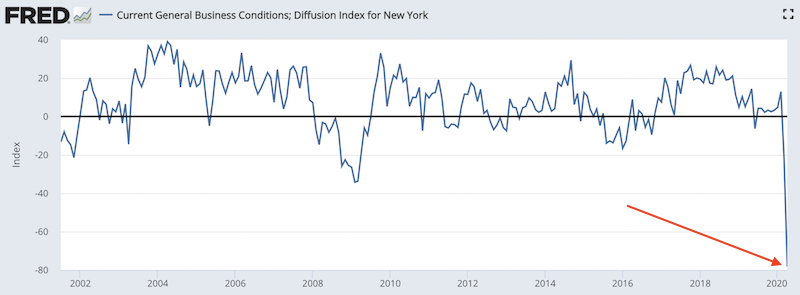
(Source: New York Federal Reserve)
The Philadelphia Fed manufacturing survey’s general business conditions index also dropped in April, down to -56.6 compared to -12.7 in March.
The outlook for business investment is also poor. Future spending by consumers is expected to be lower as Covid-19 uncertainty lingers, which is causing businesses to pull back (e.g., capital expenditure plans).
Both business confidence surveys and measures of economic policy uncertainty affect manufacturers’ capital spending plans. Business confidence has fallen drastically and economic policy uncertainty has spiked.
Housing is also part of it. Housing starts dropped to their lowest since 1984.
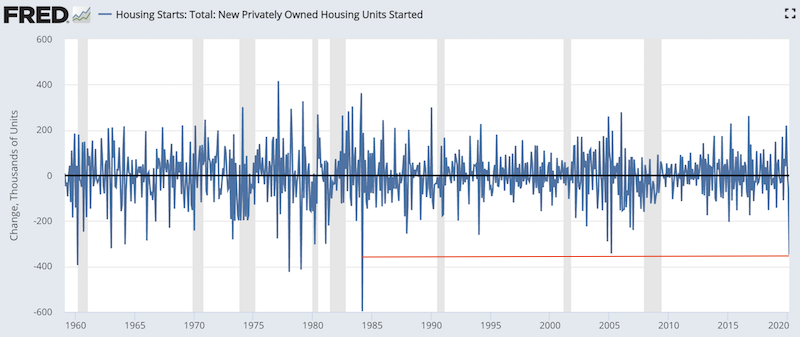
(Source: US Census Bureau)
The NAHB housing market index fell from 72 in March to 30 in April.
Initial claims for unemployment insurance benefits surged by 5.245 million in the week ended April 11. Claims over the past few weeks would put the unemployment rate at more than 20 percent. That’s more than double the rate that resulted from the 2008 crisis and close to the rate seen during the Great Depression in the 1930s.
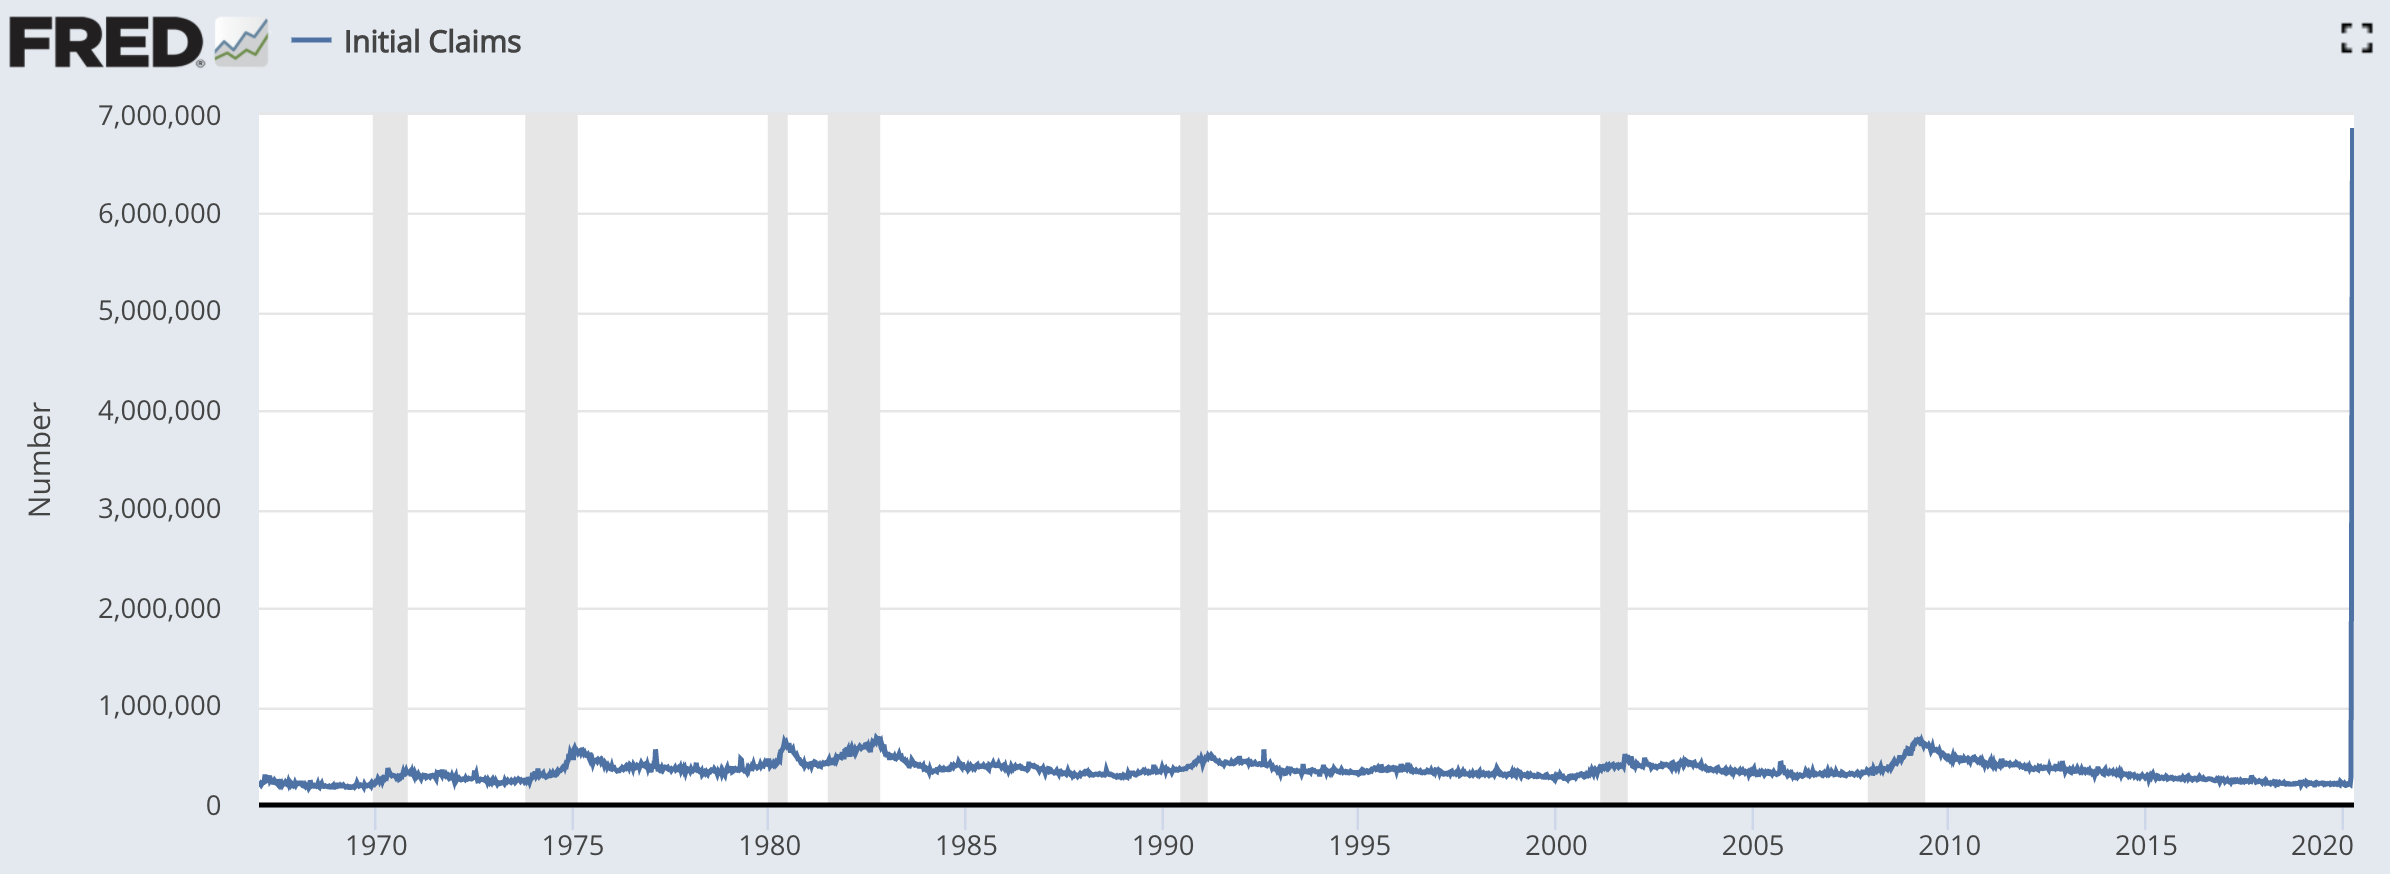
(Source: U.S. Employment and Training Administration)
Some sectors have dried up completely. Sit-in restaurants are down by virtually 100 percent across the country. Theater box office receipts are essentially zero. Air travel through TSA checkpoints are down 96 percent on a year-on-year basis.
Final Thoughts
US markets have risen 32% in just a few weeks after the Fed established swap lines, lending facilities, and has agreed to buy just about anything (Treasuries, mortgage-backed securities, corporate credit, municipal bonds, ETFs) to patch up the economy while large parts of it is closed down.
The markets may be getting ahead of themselves as it will take a while for earnings to reach their former peak. Volatility will remain elevated for some time and any economic re-opening will be cautious and spasmodic. People will need to adapt in the best way possible.
Any investors looking to develop a plan that’s longer-term in nature should consider strategically diversifying to not be overly imbalanced in their approach. Each asset class has a unique environment in which it does best.
Ever since markets came out of the financial crisis, stock markets moving 3-4 percent in a day would have been big news. Now, they do this naturally and it seems uneventful. Rumors of re-openings and progress toward a treatment or vaccine will be a key driver of markets. We also have to contend with continued credit risk.
Many assume that central banks will continue their “unlimited stimulus” programs going forward. But naturally many policymakers have qualms about this support and what it may do for risk-taking and longer-term ramifications over incentives and what it means for the currency.
With markets very much expected to be inconsistent for the foreseeable future, having balance and being in the game while being protected has never been more important.