What Is A Commodities Supercycle?


In commodity markets, you often hear of what’s called a commodities supercycle.
What is a supercycle?
A commodities supercycle is considered to be a sustained period of increasing commodity demand, often for more than a decade.
During this time commodities prices tend to rise, which can boost economic growth and development, especially among commodity exporters.
However, commodities supercycles don’t always last, as high prices help beget more supply, and there’s no guarantee that commodities prices will continue to rise during one.
What causes a commodities supercycle?
There are two main things that can cause a commodities supercycle.
Increase in demand
One is simply an increase in global demand for commodities. This could be due to population growth or industrialization in developing countries, which requires more energy and food.
Another could be central bank or central government policies that create a lot of demand – e.g., low interest rates, lots of money and credit creation.
This can fuel inflation in lots of different things, from investment assets to goods and services to commodities.
Declining supplies
Another potential cause is declining supplies of certain commodities.
This might happen if there are declining reserves of a precious commodity, or if production declines due to political instability in a major producing country.
Additionally, government policies or providers of capital could have concerns regarding the production of certain commodities. A prominent example is the concern that many have about the effect of hydrocarbons on the environment.
This can lead to chronic underinvestment in new capacity and underproduction relative to what’s needed to satisfy demand. In turn, this can lead to sustained price increases.
Commodities supercycles in history
There have been several commodities supercycles throughout history.
The first commodities supercycle of the century started around mid-2002 with the start of the post-dot-com collapse economy, and lasted until around 2008.
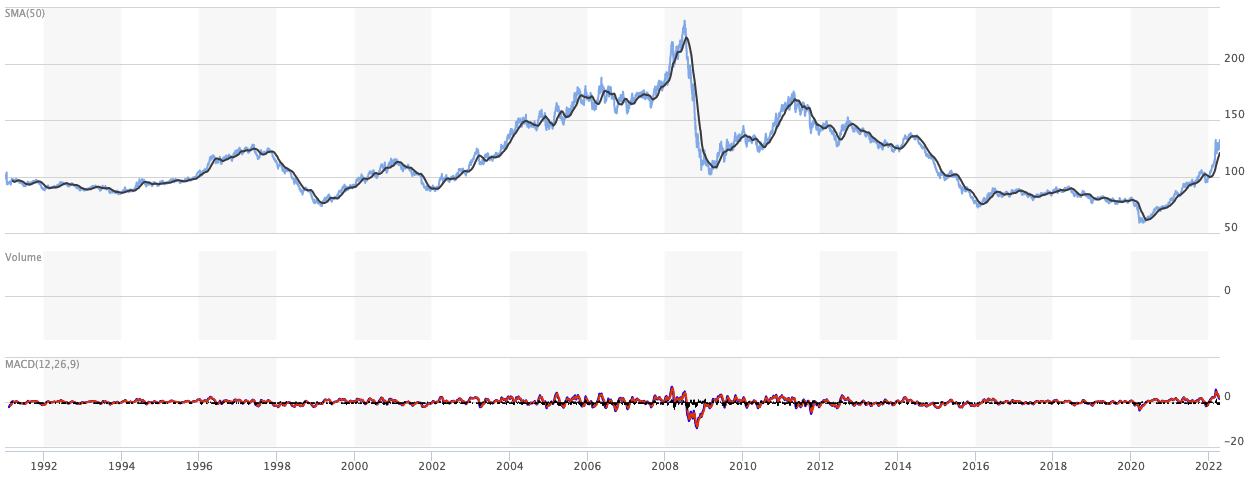
Bloomberg Commodity Index (BCOM): Mid-2002 to 2008 commodities supercycle
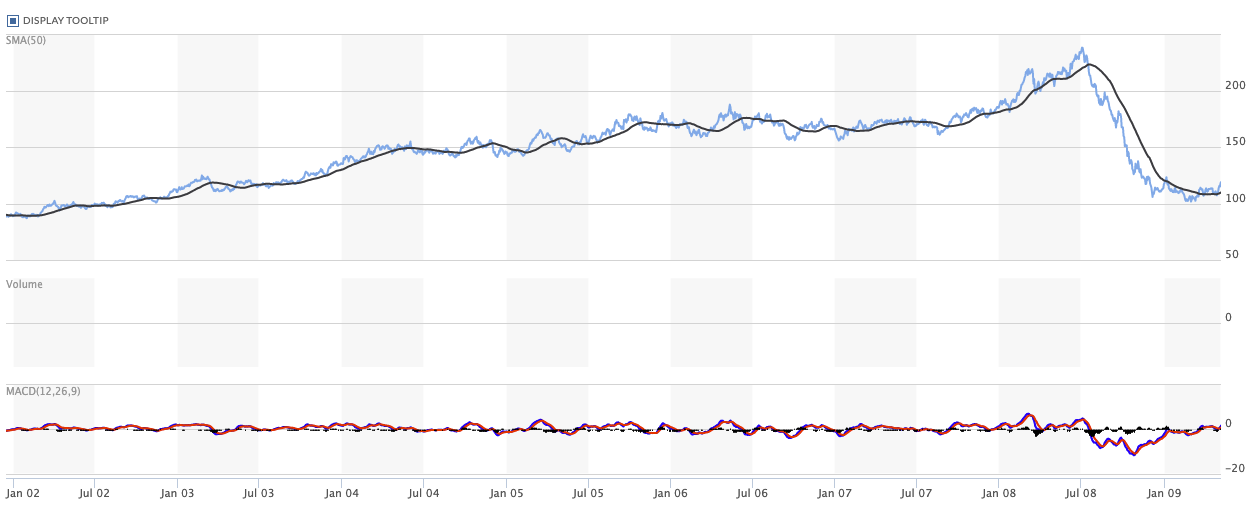
During this time, commodities prices rose sharply as global demand increased, particularly from China as its massive population grew wealthier.
The 2008 financial crisis provided a hiccup before the uptrend continued. However, commodities prices then fell sharply starting in 2015 as Chinese demand began to cool and global economic growth slowed.
It’s not clear if we’re in another commodities supercycle now, or if the current commodities rally is just a short-term blip. Time will tell.
In the meantime, it’s important to be aware of the potential for commodities prices to rise during a commodities supercycle, as this can have major implications for investment portfolios and economic growth.
High, spiky prices with steep levels of backwardation in the futures curve tell you that supplies are running low.
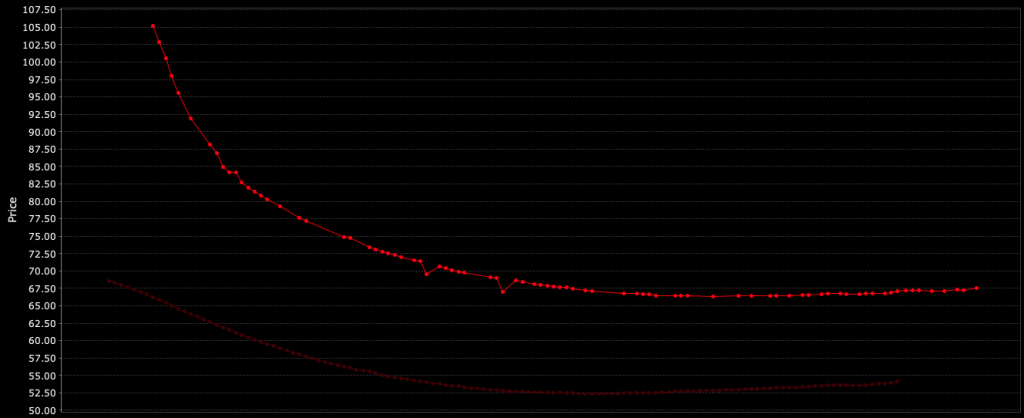
For example, this is a chart of oil, showing a backwardated curve, with spot prices higher than prices further out.
Oil futures curve
Moreover, you know commodities have the potential to run higher when there’s a lack of capital expenditure constraining supply.
On top of that, there’s a long-term structural rise in demand for many types of commodities (e.g., copper, aluminum, lithium, cobalt) stemming from policies aimed at addressing inequality, climate change, and resiliency in supply chains.
For asset portfolios
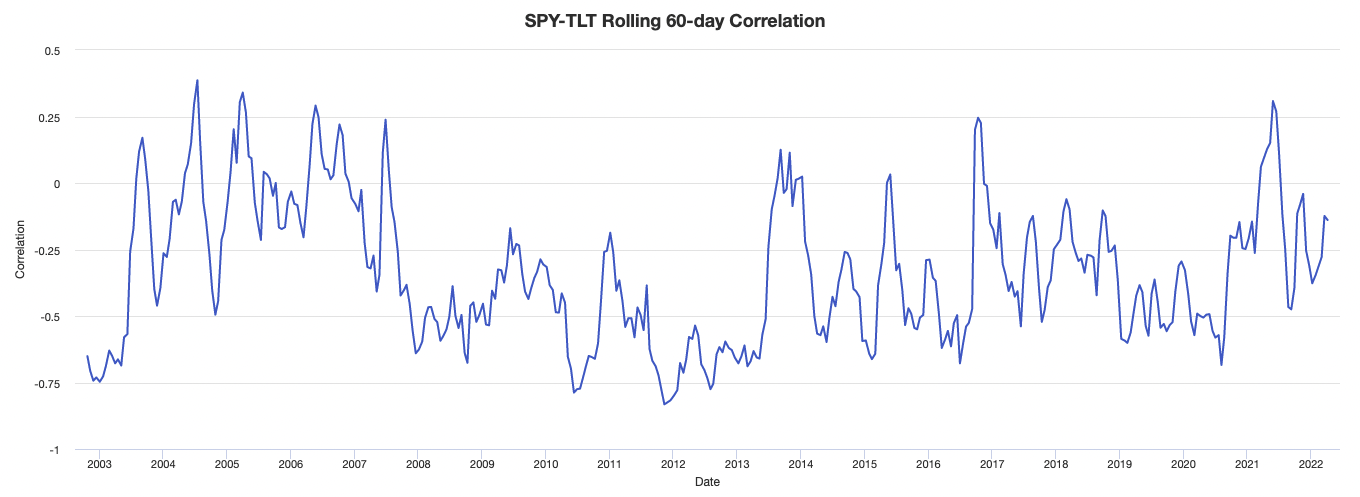
From a trading and investment perspective, the correlation between equities and bonds has been turning positive (or reversing its negative correlation) as inflation rises, further making the case for increasing commodity allocations.
Commodities have also typically performed well late in the business cycle – and during periods of geopolitical conflict – offering a potential hedge against inflation and disruption.
They can provide a type of diversification at a time when both stocks and bonds can be struggling due to higher interest rates and a central bank tightening cycle.
Commodities also tend to do well in periods of stagflation, like what was seen in the US during the 1970s. Commodities and gold did well while stocks and bonds fell in inflation-adjusted terms.
The last central bank hiking cycle in 2018 was an exception. Commodities didn’t help offset price drops in stocks and bonds. At that time, the relentless rise in shale oil production led to more supply relative to demand, providing a headwind to all commodity returns.
Yet with low inventories, high roll yields, and the diversification potential commodities bring, such forces are creating an opportune time to invest in commodities.
Low inventories
Inventories hit low levels in the early part of the decade due to supply lagging behind demand.
This imbalance became most pronounced in energy markets.
Producers, faced with environmental restrictions and poor investment returns (e.g., crashes after 2008 and during 2015-16), have underinvested in drilling new wells – both shale oil and conventional. In turn, prices eventually went up a lot when this undersupply finally came home to roost.
And higher energy costs can be felt in the rising prices of other commodities.
For example, if the world is trying to shift away from hydrocarbons, then that means lots of base metal production is needed.
Producing base metals is highly energy-intensive.
Similarly, natural gas is used to make ammonia fertilizer, which is a key cost of agricultural products.
To meet current and projected demand, energy producers are going to need to invest in new capacity.
However, they are likely to wait to bring more rigs online and drill more wells until they are confident that price strength will endure.
Moreover, as we covered in a different article, it is not spot pricing that drives investment decisions, but term pricing that’s most important.
High roll yields
Most major commodity markets are in a state of backwardation (i.e., forward prices are lower than spot prices), which is consistent with lower inventories.
Backwardation is the single strongest historical predictor of forward commodity returns due to the implications of demand exceeding supply.
The “roll yield” (sometimes called commodity carry), which is found by rolling a lower-priced longer-term contract into a higher-priced short-term contract, for the Bloomberg Commodity Index (BCOM) is averaging over 5 percent positive.
This is more than the combined buyback and net dividend yield for the S&P 500.
After adjusting for short term interest rates, this is the highest level of backwardation since the early 2000s, which preceded the last commodities supercycle.
It might be too early to call this a new commodities supercycle, as higher prices will ultimately incentivize more supply.
But holding commodities to hedge inflation risks and other portfolio risks (e.g., holding equities and bonds long) is more attractive when positive carry provides a tailwind, which brings us to our next point.
Diversification amid inflation
Commodities have historically provided a very important source of diversification for investors as the business cycle gets into its later stages.
This is characterized by low unemployment and high/rising inflation.
When labor supply is low relative to the demand, this drives higher prices for labor, which flows through into higher prices for goods and services.
It’s at this point that inflation becomes a dominant driver of asset prices rather than growth.
It’s also at this point that the interest rate needed to bring down inflation is too high relative to what the markets and economy can tolerate. So the odds of a recessions go up.
At this late stage of the business cycle, both stocks and bonds may lose value, which hurts those who are long stock-bond mixes, such as the 60/40 portfolio.
Stocks will turn down before the economy, as the financial economy leads the real economy. Once the real economy turns down, the central bank will want to ease again.
This causes bonds to rally and stocks only stop falling when interest rates have been cut adequately enough (along with other monetary and fiscal easing measures, if necessary) to get more money and credit into the system to backstop their valuations.
And while nominal asset classes such as equities and bonds/fixed income have had a negative response to adverse inflation surprises, real assets such as commodities have historically tended to be effective as a hedge against inflation.
For every one percent in unexpected change in inflation, commodities have historically delivered excess returns of over eight percent.
For that reason, having a broad basket of commodities as part of 5-10 percent of your portfolio could make sense.
Balance is key when it comes to commodities in a portfolio
Note that commodities are volatile, so this is not a recommendation to go all-in.
Commodities are like any other asset class in that they have an environment where they do well and an environment where they do horribly.
But when used as part of a balanced, diversified portfolio, commodities can help mitigate some of the downside risk from being long other assets during periods of high inflation.
The effect of decarbonization trends and policies on a commodities supercycle
The link between higher energy prices and capital expenditures has broken down.
The capital markets’ engagement as it pertains to environmental issues, decarbonization, and climate change has reached very high levels.
It can be measured in many ways, such as climate change shareholder resolutions where the approval rate went from 10 percent to 40 percent over the past 10 years.
And this drives a big divergence in the cost of capital of high-carbon versus low-carbon energy projects.
One estimate is that there’s been a divergence of 15 percentage points in the cost of capital. This is just one indication of how pronounced the impact is of the capital markets’ focus on climate change and ESG trends.
Because of this shift, the oil, gas, and the broader “fossil fuels” industry finds itself severely capital-constrained on traditional hydrocarbon investment in different ways.
For smaller exploration and production companies the main goal is about getting financing.
For larger integrated oil and gas companies it’s about decarbonizing and finding alternative business models. But either way, none of these types of companies can scale their oil and gas projects the way that they used to.
If most companies effectively are forced to abide by a carbon budget, this ultimately leads to less oil and gas development, which leads to higher hurdle rates or cost of capital for these projects.
In turn, this means that whatever cash flow might be available from these projects, the capital expenditures that can be allocated to them are restrained.
This material restraint on capex in oil and gas is what breaks the historical relationship between energy prices and capex.
And even in a tight oil and gas market, this prevents the creation of new oil and gas fields.
So this push toward decarbonization is producing inflationary results because of the restrained supply (even though the demand is still there) and the greater demand for alternative base metals that are necessary to shift away from hydrocarbon energy sources.
That causes the commodity up-cycle to endure because of all this supply tightness.
Normally, higher prices beget higher supplies.
But when there are structural constraints, this ultimately generates what could be one of the most interesting commodity up-cycles, or perhaps a commodities supercycle, that we’ve seen in decades.
Higher oil and gas prices are fully consistent with, and partially a product of, a push for decarbonization that comes from the capital markets.
The influence of recent investment losses in energy on the commodities supercycle
Investors are also influenced by the recent history of investment losses in the energy sector. One reason why capital isn’t flowing in is because of the history of market participants in this space getting burned before.
At the same time, if you look back to previous recoveries after prior falls, you used to see a doubling of capex within two to three years.
However, capex in two or three years will barely go up in oil and gas by 20 percent. So something is structurally different, not just cyclically different.
There will be other avenues of capex in energy.
For example, if low-carbon investments are included, you would see slightly more capex recovery because of the shift to lower carbon sources of energy, but still nothing like the capex increases that have been observed in previous up-cycles.
Investment differentials based on geography
There are geographical differences in energy capex, but capital markets are much more global these days.
The push toward decarbonization is stronger in Europe, but it is also still prominent in the US and in other regions.
So while it’s true that the European energy companies are probably more carbon constrained, in the US the focus on oil growth is very low even at an oil price that should lead to more investment activity.
Even with the national oil companies, where operating profits are less of a concern, they are focusing much less on oil growth and more on the development of low-carbon energy businesses. So while there is some regional bias, it’s going on globally.
If oil prices are high and capex is low, does this mean more share buybacks and dividends?
That’s one upshot for energy investors.
We’ve discussed how focused the capital markets are on decarbonization. But on the other side, it’s also important to note how little policy coordination there is on a global scale around decarbonization.
They are currently a patchwork of different policies depending on where you go.
The providers of capital are trying to push for decarbonization but policymakers are effectively struggling to coordinate on a global framework on decarbonization, carbon pricing, and other things, which leads to a period of where it’s largely unknown where carbon emissions are going.
The result is the parts of the economy that are very carbon-intensive will delay and/or reduce investment decisions because of the associated uncertainty involved in the policy environment.
Sectors like oil and gas, cement, steel, and shipping are all investing 40-50 percent less of their cash flow than they’ve done relative to their long-term history.
If you reinvest 40 percent less of your cash flow, the result is a lot more money to use for strengthening the balance sheet.
But that’s already mostly played out through dividends and buybacks. M&A will also matter at some point, especially later in business cycles when available opportunities shrink and consolidation is a logical next step.
That money goes into consolidating the industry rather than building new capacity.
This leads to a lot of inflationary development in these commodity markets, leading to higher energy prices for longer.
This is the way it’s likely to continue until global carbon policy starts to better align.
Do higher energy prices help or hurt the transition to low carbon energy?
Higher prices help to accelerate the energy transition.
The more expensive the hydrocarbon source of energy becomes, the cheaper the low-carbon alternative becomes on a relative basis.
And while it helps from a relative perspective, it also creates affordability issues that could generate political backlash.
So one of the main risks is that the current source of energy costs a lot but the lower-carbon source of energy that may (or may not be) the future isn’t ready and has its own problems (e.g., lack of ideal energy density, is available only intermittently like wind or solar).
The risk is therefore political instability and the consumer suffers from the cost inflation associated with it.
But just looking at the economics and the incentives within that, higher oil and gas prices will help accelerate an energy transition, shrinking the hydrocarbon share and increasing the renewables share.
But it’s done in a way that can be inflationary and be disruptive from a social and political perspective.
How to measure underinvestment in oil
There are three main ways we can look at how much has been underinvested in the sector.
1) Reserve life
First, we can look at the reserve life.
It used to be 50 years. But now it’s gone down to 25 because of falling oil reserves.
This demonstrates a lack of interest in exploration and resource expansion due to a push for decarbonization by both policymakers and many private investors.
2) Lost future production
The second way is to frame it in terms of how much future production has been lost because of all the delays in investment decisions on new oil and gas projects?
This comes to 10 million barrels per day of oil.
This is the same as Saudi Arabia’s daily production and 3 million barrels per day of oil equivalent in liquefied natural gas (LNG), which is more than the equivalent of Qatar’s entire daily production.
In other words, delaying new investment decisions in oil and gas since 2014 has essentially reduced oil and gas by the entirety of the production of Saudi Arabia and Qatar.
3) Look at capex
The third way is to simply look at investment numbers.
In upstream oil and gas, at its peak the industry was spending $900 billion dollars per year which. This troughed at $300 billion dollars in 2020, so there was a reduction in capex by two-thirds.
All point in the same direction
So, we have those three main ways to measure the extent of the underinvestment but they all point to the same conclusion.
All of the spare capacity in the system is virtually gone, and this reduces any buffer room to contend with supply disruptions, which can lead to large price spikes like the ones we saw because of the Russia-Ukraine conflict.
Conclusion
A commodities supercycle is a period of time during which commodities experience sustained price increases. This can be due to a variety of factors, including global economic growth, inflation, and currency devaluation.
The most recent commodities supercycle began in the early 2000s and lasted until 2008, when commodities prices began to decline due to the financial crisis.
While commodities prices have risen and fallen over the years, the commodities supercycle of the early 2000s was notable for both its length and its magnitude.
Prices for commodities such as oil, copper, and wheat more than tripled during this time period. This had a major impact on global economies, as countries that are heavily reliant on commodities exports experienced an economic boom.
Investors should keep an eye on commodities as we head into the later stages of this business cycle.
Prices are rising due to tightness in global commodities markets and this is starting to show up in inflation data.
While it’s too early to call it a commodities supercycle, diversification into commodities as a hedge against inflationary risks makes sense for many investors.
Just be sure not to balance your portfolio so that commodities make up more than a small portion of it. 5-10 percent can be a good target range.