What To Do With $100k [Investment Portfolio Strategies]


If you have $100k in cash or are wondering what to do with $100k in the bank, in this article, we cover a balanced approach to what to do with this kind of money.
Assuming you have no debt, an emergency fund of 3-6 months of living expenses, and are already maxing out your retirement accounts, here are a few options for what to do with $100k.
What to do with $100k
As we mentioned in other articles, we’re a proponent of having balance.
Capital isn’t destroyed so much as it shifts around.
So if you can find balance in a portfolio and avoid environmental biases, you can construct a portfolio that can do well in any environment and efficiently capture risk premiums from the market.
For example, stocks do well when growth is above discounted expectations and inflation is moderate to below expectations.
Commodities tend to do well in inflationary or stagflationary environments (and rising commodity prices are sometimes the cause or partial cause of inflation itself).
Inflation-linked bonds tend to outperform nominal rate bonds when growth is low and inflation expectations rise.
Nominal rate bonds (of reserve currency countries) tend to do well when growth and inflation are low.
Cash does best when money and credit are tight. And so on.
Having balance and blending assets well
So if you can balance these assets against each other and blend them well, you’ll have a fairly efficient portfolio that doesn’t have the big downs.
It won’t have the huge ups either like you’ll get with concentrated asset exposure.
But that’ll be offset by the improved reward-to-risk, lower left-tail risk, lower drawdowns, shorter underwater periods, and so on. (We have summary statistics at the end of this article.)
What questions to ask yourself first
The questions individuals and institutions should ask themselves at the outset aren’t that different.
There are basically three important ones:
- What is your required return?
- What is your achievable return?
- How big of a drawdown can you take along the way?
By required return this simply means the return that is necessary for current assets to meet future needs and obligations.
For a pension fund, for example, this means matching cash flows to future obligations. For an individual, this means determining how much return you need to support your lifestyle.
Achievable return is a function of current asset pricing and skill.
And the drawdown considers how much of a drop in your principal can you tolerate while not denting your long-term goals.
These questions are straightforward and common sense. But they’re not always easy to answer, even for sophisticated parties.
But they are also key to one’s sustainability across a range of market and economic outcomes and have implications for how one might structure a portfolio.
For a $100k portfolio, it’s probably not something you can retire off of unless your living expenses are very low.
If you’re trying to live off a portfolio where the asset returns are less than the required return, assets must be liquidated to cover the payments. And as a consequence, the future required return rises.
For instance, if your basic living expenses are $2,000 per month, that means a $100k portfolio would require a 24 percent annual return just to fund that without eating into the principal.
That kind of annual return is not very realistic when it comes to liquid asset markets, unless supplemented by a sufficient amount of outside funding sources (e.g., funds saved from your job).
So $100k is really a sum that’s viewed as something one would contribute to with their savings and look to grow over time.
For example, if you’re 30 years old and have $100k to put into the markets and achieve a six percent annual rate of return, by age 70, that’s a portfolio worth slightly over $1 million. Using the four percent rule, that can draw slightly more than $40,000 per year.
If one has a portfolio with the intention of living off of it, but they’re always losing money in it due to market events that are adverse to it, unsound investment practices, because funds have to be withdrawn from the portfolio to cover expenses, etc., it’s an uphill battle.
If this occurs often enough and by large enough amounts, the problem spirals.
The actual dynamics will be different for every investor, depending on the nature of their liability or benchmark, but the three questions are almost always relevant and important to keep in mind before figuring out what to do with any amount of money to invest.
Base allocation
Here’s an example allocation following the balanced portfolio approach.
- Developed market stocks = $25k
- Emerging market stocks = $10k
- Inflation-linked bonds = $30k
- Emerging market bonds = $5k
- Gold = $15k
- Commodities = $5k
- Long-duration government bonds = $15k
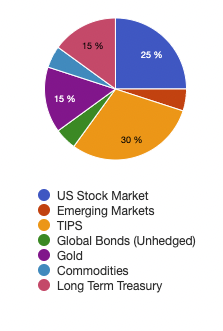
Portfolio Allocations
Since we’re dealing with $100k, the dollar amounts are essentially equal to percentage amounts as well.
| Asset Class | Allocation |
|---|---|
| US Stock Market | 25.00% |
| Emerging Markets | 5.00% |
| TIPS | 30.00% |
| Global Bonds (Unhedged) | 5.00% |
| Gold | 15.00% |
| Commodities | 5.00% |
| Long Term Treasury | 15.00% |
We have summary statistics of this portfolio below in the Appendix section, compared with a 100 percent stock portfolio on the bottom.
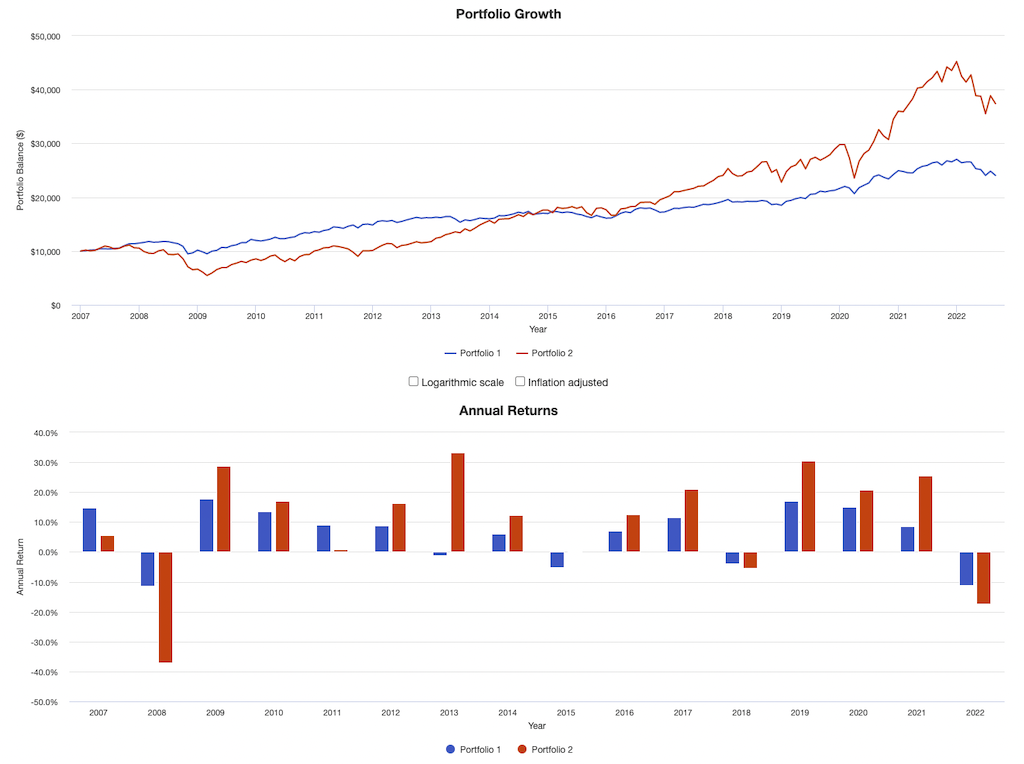
So, you got 5.8 percent CAGR at just under 8 percent volatility.
Portfolio Returns
| Portfolio | Initial Balance | Final Balance | CAGR | Stdev | Best Year | Worst Year | Max. Drawdown | Sharpe Ratio | Sortino Ratio | Market Correlation |
|---|---|---|---|---|---|---|---|---|---|---|
| Balanced | $10,000 | $24,056 | 5.76% | 7.86% | 17.71% | -11.35% | -19.48% | 0.65 | 0.97 | 0.72 |
| Stocks | $10,000 | $37,407 | 8.79% | 16.20% | 33.35% | -37.04% | -50.89% | 0.55 | 0.80 | 1.00 |
As can be observed the trajectory of the balanced portfolio (blue line) is a lot steadier than the concentrated stocks portfolio (red line):
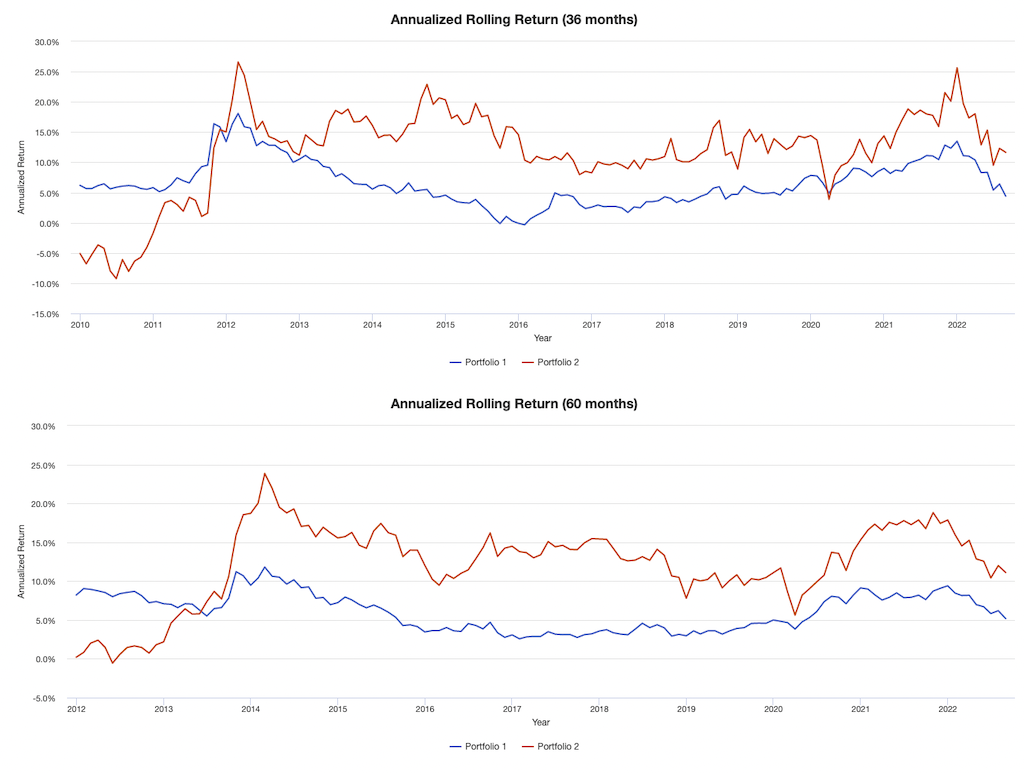
This can also be seen through 36-month and 60-month rolling returns:
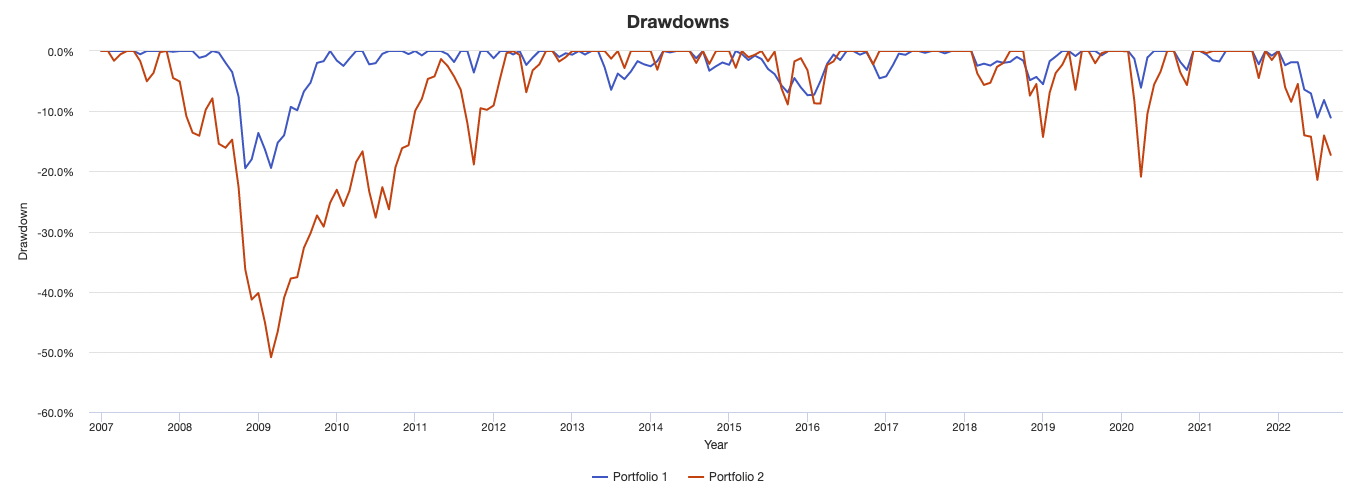
Its drawdowns are also shallower:
The diversification makes an improvement in terms of reward versus risk.
But naturally it lags behind the equity portfolio because of the lower-returning assets mixed in.
How do you get around this?
Through a moderate amount of leverage.
Most think diversification just lowers their returns.
This is true if you don’t risk adjust.
For example, if stocks have an 8 percent return at 16 percent volatility and bonds have a 4 percent return at 8 percent volatility, there’s basically the same thing if they’re adjusted for risk.
Some are totally against all forms of debt or leverage, which is fine, but if you want to bring the return up, you need to effectively borrow $0.50 for every $1.00 in net liquidation value for the above balanced portfolio to return the same as the stocks portfolio.
In other words, if the portfolio is run at 1.5x leverage, you’ll get the same return as the equity portfolio (looking backward) and you’ll still have a fraction of the risk.
For example, your max drawdown was still under 30 percent, compared with 51 percent for equities. Your vol is under 12 percent, compared with 16 percent for the pure equities portfolio.
Your worst year would have been only down 16 percent vs. 37 percent for equities. Your best year would have been a respectable +26 percent vs. 33 percent for equities.
If you run it at 2x leverage, your volatility is still slightly lower than the equities portfolio, but you got 11-12 percent annualized returns, and still had lower drawdowns, a lower “worst year”, lower left-tail risk, and so on. So you did better at less risk.
How do I create this portfolio?
ETFs provide diversified exposure.
In this case, we’re using unlevered ETFs. You’re only paying the management fees, which are typically very low.
Usually, the fees with stock index ETFs are the cheapest (normally under 15bps); bonds ETFs are a bit more expensive overall (usually 10-50bps, depending on the type of bond fund); commodity ETFs are the most expensive (usually over 40bps).
Here’s an example:
- Developed market stocks (SPY) = $25k
- Emerging market stocks (VWO) = $5k
- Inflation-linked bonds (TIP) = $30k
- Emerging market bonds (EMLC) = $5k
- Gold (GLD) = $15k
- Commodities (GSG) = $5k
- Long-duration government bonds (TLT) = $15k
But what about the cost of borrowing?
It’s a good question, because the cost of borrowing in your portfolio is not always free.
There are a couple main ways:
1) Futures
Futures enable you to buy a lot of exposure to a certain asset for a low outlay of capital.
For example, with some futures contracts, you can get $10 of exposure for every $1 of collateral.
So getting leverage through futures is easy, but it can be easy to overleverage and difficult to size positions appropriately.
These days, smaller futures contracts (sometimes called “mini” contracts) are available to better appeal to the needs of 5- and 6-figure accounts.
Liquidity is also an important consideration. Some futures contracts are not that liquid, which poses an additional problem because the spread will raise transaction costs, which directly eat into return.
Moreover, futures contracts have an expiration date. You have to roll contracts from one date to the next, often once every three months, but sometimes every 1-2 months. This involves transaction costs.
2) Borrowing
Margin debt can be expensive.
For example, if you have $100k and want 2x exposure, that means $200k in assets. That, in turn, means $100k has to be borrowed.
If your margin cost if 5 percent (it can easily be more expensive than that), that’s $5k per year. If your assets are throwing off $10k per year in cash flow, on average, that means half is eaten up just in margin costs (i.e., interest).
So you should try and minimize your cash borrowing.
How to borrow without paying interest
There is a way you can borrow on margin without paying any margin interest.
That involves also running a short book.
This is because shorting gives you a cash credit in your account, which means avoiding any net borrowing.
However, it can be hard to win at shorting when the incentive is for these assets to go up.
So one way to do this is to run a short book with covered puts.
Basically it boils down to: The puts sold against the short positions generate income while the short book offsets the margin interest, enabling you to be more long the core assets.
This is not necessarily recommended because it’s complicated. But running a short book or a short book with put options to harvest income from those short positions is nonetheless a strategy.
We’re also not including any transaction costs in these backtests. In reality, you’ll pay some spread to get in and out of positions, but it’s not a big deal when you’re buying and holding for the long term.
Avoid using leveraged ETFs
Leveraged ETFs are not good for any timeframe outside intraday.
Leveraged ETFs are especially bad for any timeframe beyond one day because of the time decay or tracking error element.
They need to be handled carefully if used for anything beyond day trading purposes. This is because their values are recalculated every trading day.
In light of this, percentages matter rather than the value of the index. If the value of something falls 20 percent, a 25 percent gain is needed to make back the losses and leveraged ETFs reflect this.
Example
For example, if an index drops from 100 to 99 it loses one percent of its value.
If the index rallies back to 100 the next day that would be a gain of 1.01 percent.
A 2x leveraged ETF of the underlying index would drop 2 percent from 100 to 98.
The next day, the ETF would rally 2.02 percent to follow the index (2 multiplied by the 1.01 percent gain).
However, following the daily reset, doing the calculation, taking 98 multiplied by 2.02 percent gives us only 99.98.
Further price movement compounds this tracking error, with higher volatility causing a higher resulting discrepancy.
Because of this, there’s a natural decay pattern in these leveraged ETFs that distorts how effectively they will mirror what it’s supposed to be tracking over the long-term – i.e., anything longer than one day.
If the market does decrease and you’re long a 2x or 3x leveraged short ETF, you will make money in excess of simply being short a straight 3x short S&P 500 ETF like SPXU.
But it won’t be the 3x many might assume they’ll be getting unless limiting the holding period to within just a single day.
The advantage of these securities, however, is that they can be traded in a regular stock trading account for those who lack futures and options accounts.
Nonetheless, the leveraged varieties should ideally be avoided for those who have holding periods beyond one day due to the tracking error that results from them.
FAQs – What to do with $100k
Should I buy individual stocks and securities?
The idea behind this portfolio is to have broad diversification to take risk more efficiently.
This is about strategic asset allocation rather than tactical.
So, ETFs tend to be best for this purpose because they’re an easy way to achieve this. However, if you want to buy individual stocks, that’s fine.
You just need to be careful about tactical selections and avoid concentrated exposure that increases risks.
How do I rebalance?
The portfolio should be rebalanced as needed. It’s not necessarily once a quarter or once a year, though it can be operated like that if it’s most convenient to do so.
This is because the underlying asset mix will have changed and you want to keep the desired ratio.
To do this, simply sell the asset that has increased the most in value and use the proceeds to buy more of the others.
At the same time, consider your tax implications.
Due to laws governing short-term and long-term capital gains, you may find it beneficial to increase your holding periods.
Should I use leverage?
It’s not a black-and-white concept – “any leverage is bad, no leverage is good”.
A modestly leveraged portfolio that is balanced and well-diversified can be better (i.e., higher returns and less risk) than a portfolio that’s unleveraged and poorly diversified.
Leverage is a tool like anything else. Most financial wipeouts occur due to some form of overleveraging – e.g., using margin carelessly, using futures carelessly, being naked short options.
The key is not to use too much leverage (going back to the question of “how much of a drawdown can you take?”) and to be aware of the risks.
A good rule of thumb is to keep your total portfolio volatility at or below 20 percent. Those who are closer to retirement or a stage where they’ll need the money from the portfolio may want to consider dropping it below 12 percent or even less than 10 percent.
What about stop losses?
A stop loss is an order to sell a security when it reaches a certain price.
It’s designed to limit an investor’s loss on a position in a security.
For example, let’s say you buy shares of XYZ stock at $50 per share.
You might place a stop loss order at $45, which would automatically sell your shares if the price dropped to that level.
There is no “right” answer when it comes to stop losses.
It depends on your investment goals, risk tolerance, and other factors.
Some investors choose to set stop losses, while others are more relaxed about it.
It’s important to remember that a stop loss is not guaranteed.
If the market gaps down (opens at a lower price than the previous day’s close), your stop loss may not be executed at your desired price.
Moreover, stop losses are more of a trading concept than an investing concept.
Traders and investors tend to think differently about markets. For traders, it’s all about the gains or losses from market movements. Investors are more likely to think of stocks as owning shares in a business.
For example, someone who owns farmland doesn’t think about dropping prices as a matter of losing money. They think about how much net income the land is generating them. In fact, if prices are falling and they get more earnings per unit of land, it might be a good idea to buy more.
If farmland were a liquid security, a trader would view these mark-to-market losses as a bad thing.
Isn’t picking individual securities better than buying ETFs?
Everything that’s known is already baked in the price.
Market pricing isn’t determined based on whether things are good or bad. It’s determined by whether things are good or bad relative to what’s already discounted in.
This is why a stock can rally off a bad earnings report. The market expectations were that it would be terrible.
Or why a stock can fall a lot despite a very good earnings report. The market expected an excellent one. Even if it was excellent, forward estimates could be cut, leading to a fall.
Betting on a bad company can be just as good as betting on a good company because their prices already reflect what’s already known.
That’s why the Nifty Fifty of the late 1960s and early 1970s turned out to be a dud. They were “can’t miss” stocks that were perceived to be the present and future. But their prices got ahead of their actual future earning potential.
Also beware of stocks that operate more on stories, hype, and promotion than reality. A stock is a claim on future profits – i.e., production of goods and services in excess of the costs of making them.
It’s the same reason why betting on bad teams can be just as good as betting on great teams in the sports betting markets.
Not much is expected of bad teams. So they are regularly underdogs and have favorable point spreads when bookmakers make a market in them that attempts to balance money on both sides of the bet.
A lot is expected of great teams. They’re almost always favorites and have to cover large point spreads accordingly.
Other options for what to do with $100k
What we covered above is a passive approach to investing $100k.
While $100k is a nice sum of money, if you were to use it with the purposes of living off it in perpetuity, it wouldn’t go that far.
Using the 4 percent rule, it might reliably throw off about $4,000 per year (or about $300-$350 per month) in income.
There are other ways to get better returns, though they may be more active approaches or simply riskier.
Let’s go through them.
#1 Start or buy a business that leverages your skill set
You can either start your own business or buy an existing one.
The advantage of buying an existing business is that it already has a customer base, team, processes, or at least some form of traction in place.
If you’re starting a business from scratch, you have more control over how much you spend but also more risk since you’re not guaranteed success.
Either way, owning your own business can be a great way to generate income and build wealth over time.
Just make sure you do your due diligence before making any decisions.
Also think about how the business leverages your skill set. If you’re a coder, you might create (or buy) a SaaS project. If you’re in SEO, you might start (or buy) a blog.
Also think about synergies. How will it help any existing business you have save costs or create up-sell or cross-sell opportunities?
For example, an online brokerage might buy an auto-invest platform to bring in younger investors, or buy a prime brokerage technology platform to attract more institutional clients.
#2 Invest in real estate
Investing in real estate can be a great way to generate income and build wealth over time.
However, you have to really know real estate to get the most out of it.
For example, you have to identify the right deals and identify the right improvements to get the most out of it.
You also need to factor in the time and effort required to manage rental properties.
And if you’re not careful, real estate can be a very risky investment.
But done right, it can be a great way to build wealth over time. Just make sure you do your homework before getting started.
#3 Angel investing
This can be very risky since most VC deals don’t return any capital in the end.
However, for investors who can spot opportunities well, this can be a great way to make money.
The key is to really understand the companies you’re investing in, the management, emerging trends, developing markets, and have a good idea of their potential.
And as with any investment, don’t put all your eggs in one basket. Diversify your investments to minimize risk.
#4 Trading
This is speculative trading where you buy and sell stocks or other assets within a short time frame, typically within days or weeks.
The goal is to capitalize on short-term price movements.
This can be risky since it’s difficult to predict price movements over such a short timeframe.
You’re only as good as the information you have and your process.
However, if you’re good at it, trading can be a way to make money.
Just make sure you only use money you can afford to lose and don’t get too caught up in the excitement.
Conclusion – What to Do with $100k
If you want to treat $100k in a way that maximizes your reward relative to your risk in liquid markets, you will need to have balance.
You don’t need to make correct economic/market forecasts in order to do well.
This is about spreading your chips in a balanced, efficient way and collecting.
It’s not about being right all the time.
The goal is to build a system that generates income and appreciates in value over time, while giving you the flexibility to live your life the way you want.
These are just a few options for what to do with $100k. It’s important to find an investment that matches your risk tolerance and goals. And as always, don’t forget to diversify, even when trading or there’s a high degree of turnover in your portfolio.
With a little bit of thought and planning, you can make your $100k work for you.
Appendix – Summary Statistics
Below are summary statistics of the unleveraged balanced portfolio and stocks portfolio used in this article.
| Arithmetic Mean (monthly) | 0.49% | 0.81% |
|---|---|---|
| Arithmetic Mean (annualized) | 6.09% | 10.22% |
| Geometric Mean (monthly) | 0.47% | 0.70% |
| Geometric Mean (annualized) | 5.76% | 8.79% |
| Standard Deviation (monthly) | 2.27% | 4.68% |
| Standard Deviation (annualized) | 7.86% | 16.20% |
| Downside Deviation (monthly) | 1.50% | 3.19% |
| Maximum Drawdown | -19.48% | -50.89% |
| Stock Market Correlation | 0.72 | 1.00 |
| Beta(*) | 0.35 | 1.00 |
| Alpha (annualized) | 2.53% | 0.00% |
| R2 | 51.31% | 100.00% |
| Sharpe Ratio | 0.65 | 0.55 |
| Sortino Ratio | 0.97 | 0.80 |
| Treynor Ratio (%) | 14.70 | 8.96 |
| Calmar Ratio | 0.40 | 0.54 |
| Active Return | -3.02% | 0.00% |
| Tracking Error | 11.91% | 0.00% |
| Information Ratio | -0.25 | N/A |
| Skewness | -1.07 | -0.60 |
| Excess Kurtosis | 5.76 | 1.38 |
| Historical Value-at-Risk (5%) | -3.25% | -8.12% |
| Analytical Value-at-Risk (5%) | -3.24% | -6.88% |
| Conditional Value-at-Risk (5%) | -4.85% | -10.24% |
| Upside Capture Ratio (%) | 35.62 | 100.00 |
| Downside Capture Ratio (%) | 27.14 | 100.00 |
| Safe Withdrawal Rate | 9.23% | 8.49% |
| Perpetual Withdrawal Rate | 3.24% | 6.05% |
| Positive Periods | 115 out of 188 (61.17%) | 124 out of 188 (65.96%) |
| Gain/Loss Ratio | 1.14 | 0.81 |
| * US stock market is used as the benchmark for calculations. Value-at-risk metrics are based on monthly values. | ||