Correlation Trading Models


Correlation trading models are quantitative models that take advantage of the statistical relationships between the movements of two or more financial assets.
These models are based on the principle that the price movements of different assets can be related in a predictable manner.
Correlation trading strategies can be applied across various asset classes including equities, fixed income, commodities, and currencies.
The basic concept behind these models is the correlation coefficient, which measures the degree to which the returns of two assets move in tandem.
A correlation coefficient of +1 indicates perfect positive correlation, 0 indicates no correlation, and -1 indicates perfect negative correlation.
These coefficients are dynamic and change over time.
Key Takeaways – Correlation Trading Models
- Correlation trading models capitalize on the changing relationships between assets, which allows traders to profit from variances in correlation, not just directional movements.
- Example
- A trader might exploit the positive correlation structure between the Canadian dollar (CAD) and oil by shorting the CAD against a higher-interest currency (for positive carry) and go long oil if it has a steep backwardated curve for the positive roll yield.
- This limits the correlation to oil and produces a positive expected yield.
- There are many elements and variables to these trades, so these markets have to be studied carefully and risk-managed effectively.
- Diversification
- Use correlations to diversify trading strategies.
- Mitigates risk by pairing assets that move inversely or independently, which helps with a balanced portfolio that can withstand market volatilities.
- Often used by hedge funds, given many try to provide value by giving their investors strong risk-adjusted returns while also being largely independent of the movements of other asset classes.
- Dynamic Adjustment
- Correlations change over time; hence, traders must regularly reassess and adjust their models to maintain efficacy.
- Risk Management
- Correlation trading models offer a strategic approach to managing portfolio risk.
- Enables traders to identify and exploit the relationship between asset movements for trade positioning and risk reduction.
- Cointegration
- Cointegration refers to a statistical relationship between two or more time series variables where their long-term movements are linked, even if they aren’t necessarily moving in the same direction at all times.
- It suggests that despite any short-term deviations, these variables tend to move together over the long run, indicating a stable equilibrium relationship between them.
Key Concepts in Correlation Trading Models
Correlation Coefficient
A statistical measure that calculates the degree to which two securities move in relation to each other.
Correlations are used in portfolio management to study how assets move in relation to each other.
The basic idea is that some assets zig while others zag.
Assets have different environmental biases.
For example:
- stocks do well when growth is above expectation and inflation is at or below expectation
- cash does well when money and credit are tight
- safe government bonds do best when growth and inflation are below expectation, etc.)…
…so they have different correlations as traders/investors move out of one and into the other based heavily on how conditions change relative to what’s discounted.
As such, losses holding one asset can be offset by gains holding another.
Pairs Trading
A market-neutral trading strategy that matches a long position with a short position in a pair of highly correlated instruments such as two stocks, ETFs, currencies, commodities, or options.
Spread Trading
Involves taking opposite positions in two correlated assets.
The trade is based on the widening or narrowing of the spread between these assets.
Cointegration
A more sophisticated approach than correlation, indicating a long-term equilibrium relationship between two or more variables, despite short-term deviations.
Used in pairs trading to identify pairs where the spread is statistically likely to revert to its mean.
Beta-/Market-Neutral
Involves constructing a portfolio where the beta (a measure of an asset’s volatility in relation to the market) is neutralized.
This means the portfolio’s overall performance is independent of market movements.
Volatility Arbitrage
Exploits the difference between the forecasted future volatility of an asset and the implied volatility of options based on that asset.
Cointegration vs. Correlation vs. Covariance
Cointegration, correlation, and covariance describe different types of relationships between time series variables:
- Correlation measures the strength and direction of a linear relationship between two variables in the short term.
- Cointegration assesses whether two or more variables move together over the long term, indicating a deeper, structural linkage, even if they don’t move in tandem in the short term.
- Covariance indicates the direction of the linear relationship between two variables. Shows whether increases in one variable tend to be associated with increases (positive covariance) or decreases (negative covariance) in the other (without specifying the strength of the relationship).
Naturally, cointegration trading strategies require a longer time horizon.
Correlation strategies can be pursued on shorter timeframes.
Math Behind Correlation Trading Models
Here’s a short overview of the math behind correlation trading models:
- As mentioned, correlation trading involves taking advantage of correlations between different assets or markets.
- The key mathematical concept is correlation, which measures the degree to which two variables move together.
- Correlation coefficients range from -1 to +1.
- To calculate the correlation coefficient between two assets X and Y, you first calculate the covariance between the two return series:
Cov(X,Y) = ∑_(i=1)^n (X_i – E(X))(Y_i – E(Y)) / n
Where E(X) and E(Y) are the expected values (means) of X and Y.
- The correlation coefficient is then calculated as:
ρ(X,Y) = Cov(X,Y) / (σ(X)σ(Y))
Where σ(X) and σ(Y) are the standard deviations of X and Y.
- A correlation close to +1 means the assets tend to move together. A correlation close to -1 means they tend to move opposite each other.
- In trading, you can exploit correlations by taking long and short positions in correlated assets to hedge systemic risk.
- For example, if Stock A and Stock B have a high positive correlation (e.g., Ford and GM), you could long Stock A and short Stock B as a market-neutral trade.
- Statistical methods like regression analysis can also be used to model the linear relationship between correlated assets and forecast future movements.
- The key math involves estimating the regression coefficients between variables.
So, correlation coefficients, covariance, regression analysis, and statistical modeling are the main mathematical techniques used in correlation trading strategies.
The aim is to profit from relationships between assets while hedging overall market risk.
Types of Correlation Trading Models
Statistical Arbitrage Models
These models use statistical and computational algorithms to identify mispricing between pairs of assets.
Trades are placed to exploit the reversion of the spread to its historical mean.
Dynamic Correlation Models
Use time-varying correlations to adjust trading strategies dynamically.
These models account for changing market conditions and adjust positions accordingly.
Cointegration-Based Models
Identify pairs of assets that share a long-term equilibrium relationship.
The strategy involves trading on the basis that the spread between these assets will revert to its mean.
Given the variance and stochastic nature to markets, there necessarily needs to be a longer-term timeframe for this type of strategy.
Factor Models
These models identify the underlying factors (such as market, sector, or country factors) that drive the returns of assets.
Correlations between these factors and assets are used to construct diversified portfolios.
Machine Learning Models
Use algorithms to identify complex, non-linear relationships between assets that would be difficult to detect with traditional statistical methods.
These models can adapt to new data and evolving markets.
Related: Non-Parametric Models
Spread Trading Models
These models focus on the price differential between two correlated assets, trading on the widening or narrowing of this spread.
Unlike cointegration models that rely on a long-term equilibrium, spread trading can capitalize on short-term fluctuations and mean reversion strategies.
Volatility Arbitrage Models
While not directly a correlation trading model, volatility arbitrage takes advantage of the correlation between an asset’s price and its implied volatility.
Traders can exploit discrepancies between the realized volatility of an asset and the implied volatility priced into options contracts.
Cross-Asset Arbitrage Models
These models exploit the price discrepancies across different asset classes (e.g., equities, commodities, currencies) that theoretically should maintain a certain correlation relationship.
Example
For example, the Canadian Dollar (CAD) tends to correlate positively with oil prices (because Canada’s an oil exporter).
If a trader has a positive roll yield in oil and has positive carry by shorting the CAD against another currency (i.e., currency with a higher interest rate than CAD), they can go long oil and short the CAD to take advantage of the correlation structure.
By trading on deviations from this expected correlation, traders can potentially secure profits.
High-Frequency Correlation Models
Employing high-speed data analysis and execution to capitalize on correlation changes that occur in milliseconds.
These models require sophisticated technology and are used by quantitative trading firms to exploit very short-term correlation inefficiencies between assets.
Related: HFT Strategies
Coding Example – Correlation Trading Model
Below, we’ll provide a Python example demonstrating a correlation trading model where daily returns for two simulated assets (Asset A and Asset B) are analyzed over a year.
The rolling 30-day correlation between these assets’ returns is calculated and plotted.
The strategy considers going long on one asset and short on the other based on the deviation of the current correlation from the historical average.
import numpy as np
import pandas as pd
import matplotlib.pyplot as plt
from sklearn.linear_model import LinearRegression
# Simulated daily returns for two assets (e.g., Asset A and Asset B)
np.random.seed(51)
dates = pd.date_range(start='2022-01-01', end='2022-12-31', freq='B')
asset_a_returns = np.random.normal(0.0005, 0.01, len(dates))
asset_b_returns = asset_a_returns * 0.8 + np.random.normal(0.0002, 0.005, len(dates))
# Create DataFrame
data = pd.DataFrame({'Asset_A_Returns': asset_a_returns, 'Asset_B_Returns': asset_b_returns}, index=dates)
# Calculate rolling 30-day correlation
rolling_correlation = data['Asset_A_Returns'].rolling(window=30).corr(data['Asset_B_Returns'])
# Plot the rolling correlation
plt.figure(figsize=(14, 7))
plt.plot(rolling_correlation, label='Rolling 30-Day Correlation')
plt.title('Rolling 30-Day Correlation Between Asset A and B Returns')
plt.legend()
plt.show()
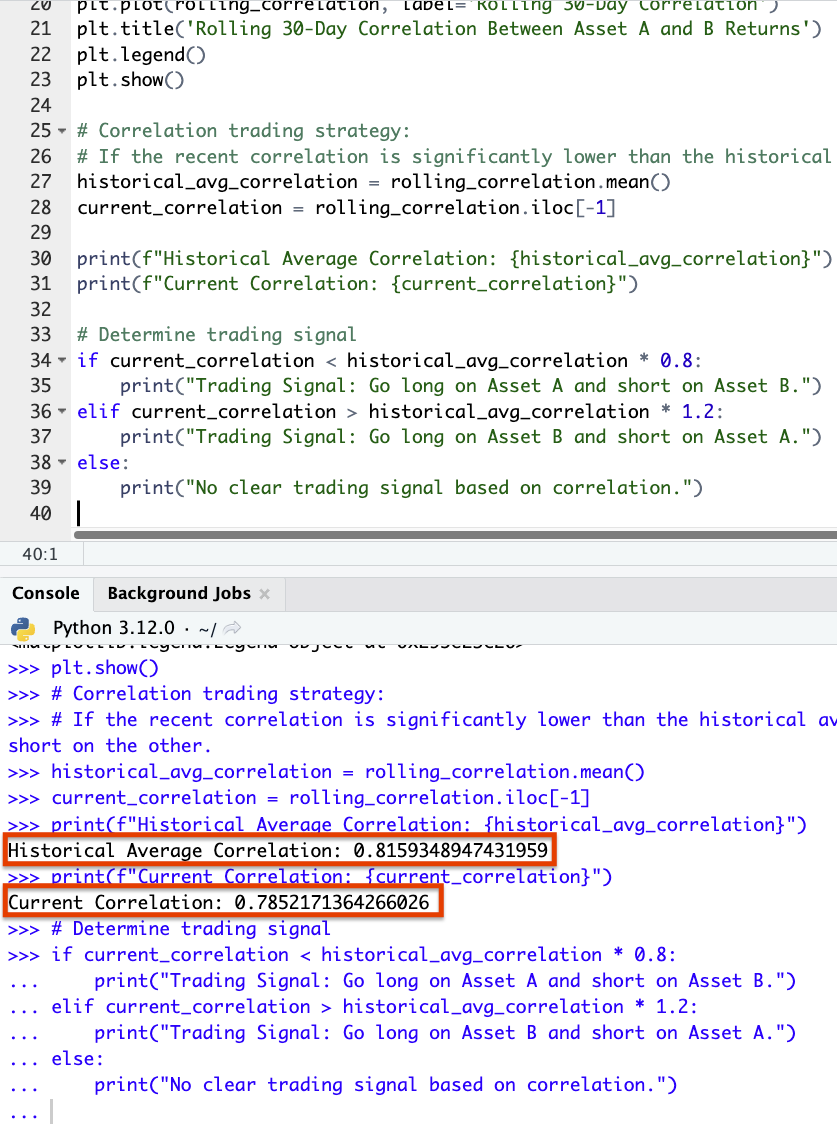
# Correlation trading strategy:
# If the recent correlation is significantly lower than the historical average, go long on one asset and short on the other.
historical_avg_correlation = rolling_correlation.mean()
current_correlation = rolling_correlation.iloc[-1]
print(f"Historical Average Correlation: {historical_avg_correlation}")
print(f"Current Correlation: {current_correlation}")
# Determine trading signal
if current_correlation < historical_avg_correlation * 0.8:
print("Trading Signal: Go long on Asset A and short on Asset B.")
elif current_correlation > historical_avg_correlation * 1.2:
print("Trading Signal: Go long on Asset B and short on Asset A.")
else:
print("No clear trading signal based on correlation.")
Results
In this case, the current correlation is slightly lower than the historical average, but not significantly enough to trigger a clear trading signal based on the predefined strategy criteria.
Correlation diagram:
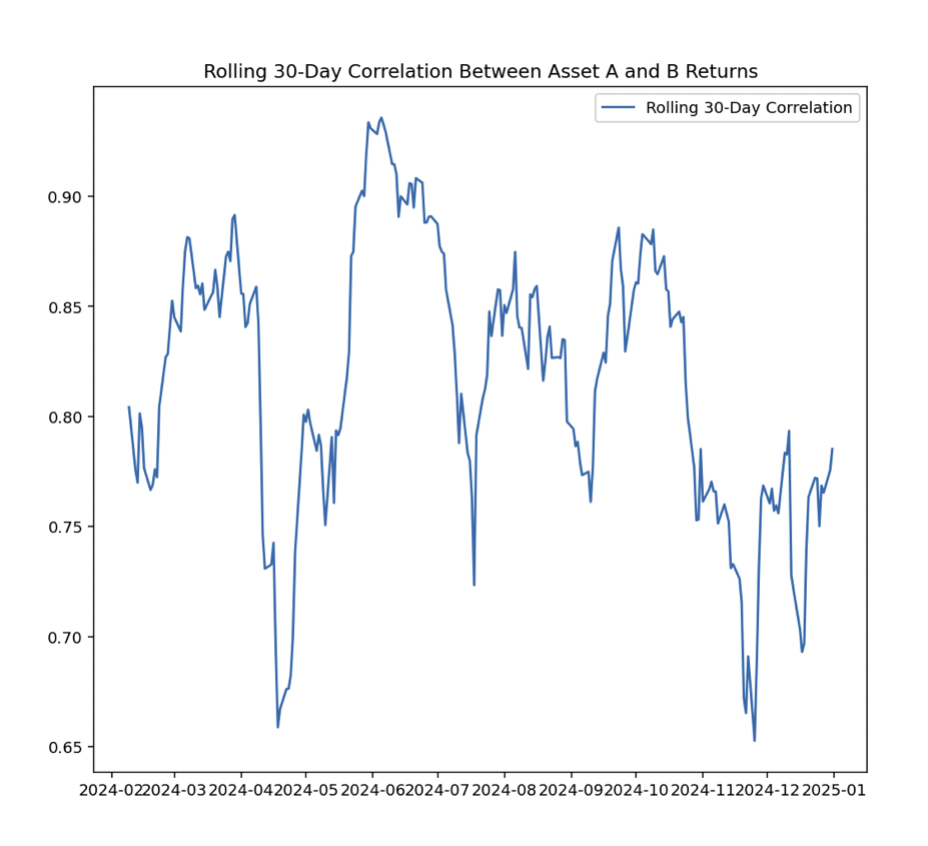
This model highlights the importance of monitoring correlations for trading opportunities – especially when correlations diverge significantly from their historical norms.
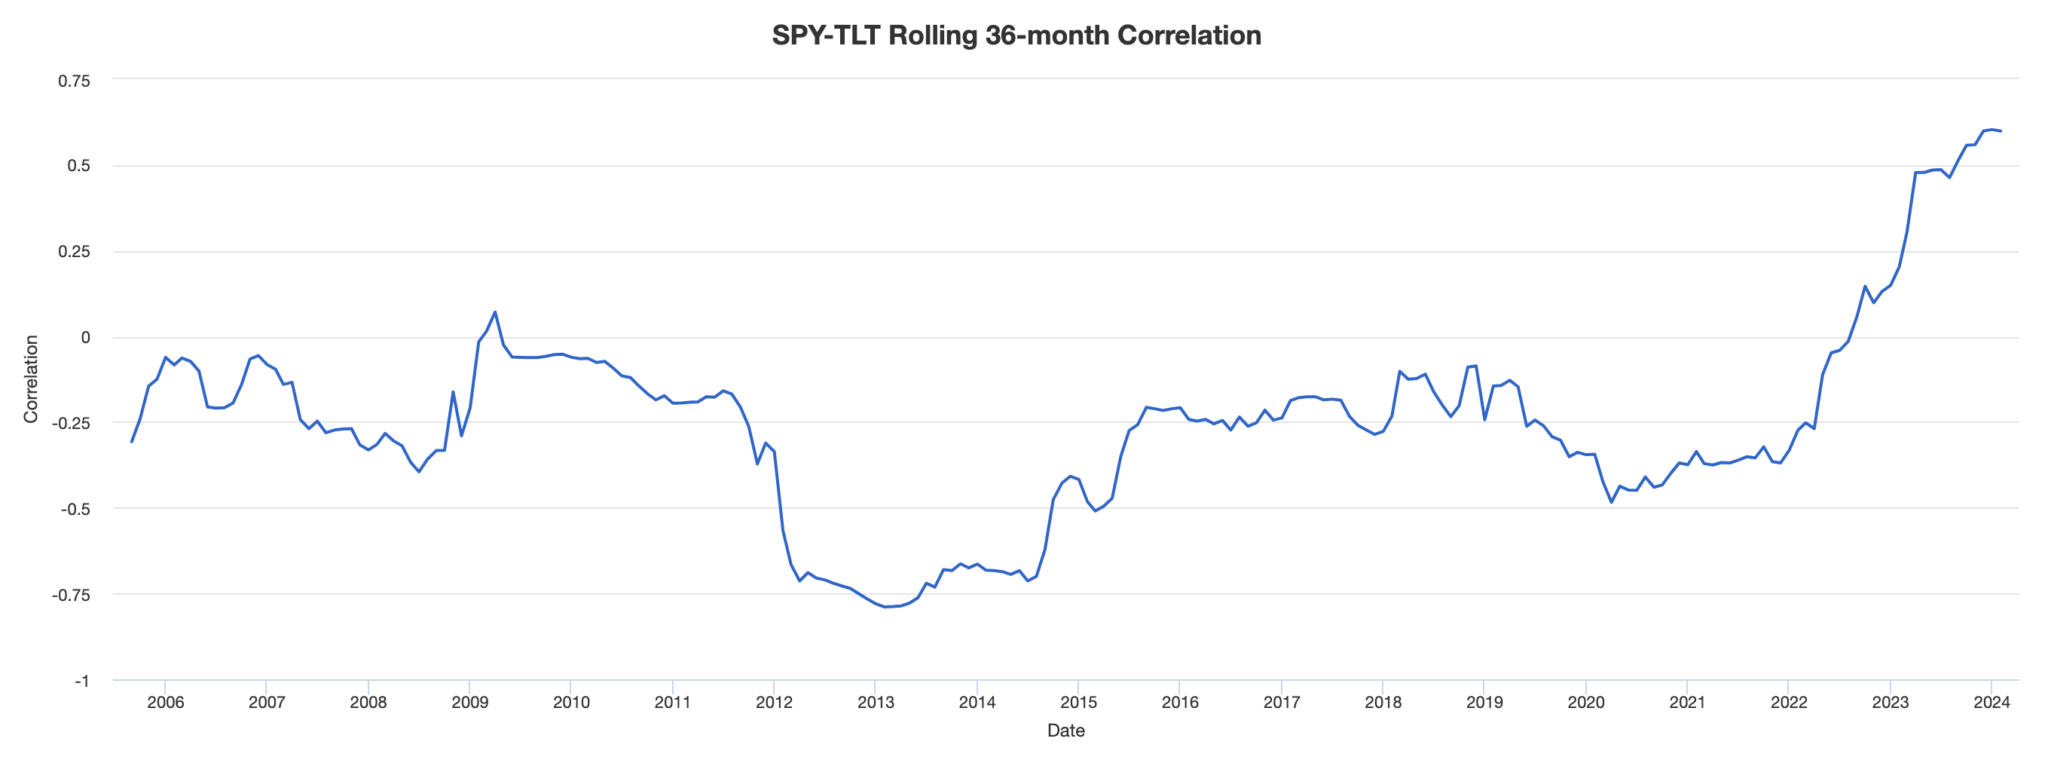
It’s important, though, to understand that correlations can diverge for perfectly logical reasons, as things change.
With real data, correlations can change significantly, as shown in the diagram between stocks and US government bonds:
Conclusion
Correlation trading models require sophisticated statistical analysis and a strong understanding of market dynamics.
They can offer diversification benefits and are used by hedge funds, proprietary trading desks, and sophisticated individual traders to generate alpha while managing risk.
They’re used a lot by hedge funds whose value is often dependent on generating strong risk-adjusted returns independent of the broader market.
Correlations can nevertheless change over time, especially during periods of market stress, which can introduce risk into these strategies.