TensorFlow & Keras in Trading (Applications & Examples)


TensorFlow and Keras are Python libraries used for building trading models and strategies.
We look at how they can be applied in trading.
Key Takeaways – TensorFlow & Keras in Trading
- TensorFlow and Keras are both open-source libraries for machine learning and deep learning.
- TensorFlow, developed by the Google Brain team, is a platform that allows developers to design, train, and deploy machine learning models across various platforms.
- Supports various deep learning algorithms and techniques.
- Keras, initially a standalone project and now integrated with TensorFlow as tf.keras, provides a high-level, user-friendly interface for building and training deep learning models.
- Keras is designed to simplify the creation of complex neural networks, so it’s accessible for both beginners and experienced practitioners.
TensorFlow
Numerical computations
TensorFlow is good at numerical computations, so it’s used for mathematical calculations involved in financial analysis and modeling.
Data Pipelines
It can efficiently handle large datasets of financial time series data – e.g., stock prices, economic indicators, and market news.
TensorFlow allows you to build data pipelines to clean, pre-process, and feed this data into your models.
Custom Models
Keras offers pre-built building blocks, while TensorFlow allows you to create custom models tailored to specific trading strategies.
Keras
Rapid Prototyping
Keras allows you to quickly build and experiment with different trading models. (This is a perk with Python, in general.)
Its interface makes it easier to test various model architectures and hyperparameters to find the best fit for your strategy.
Pre-built layers
Keras provides pre-built neural network layers commonly used in financial applications, such as recurrent layers for handling sequential data (e.g., time series) and convolutional layers for feature extraction.
Flexibility
While primarily high-level, Keras can be combined with lower-level TensorFlow operations when needed.
This lets you leverage the strengths of both for specific tasks.
Trading Applications
What can we do with TensorFlow and Keras?
Some applications:
- Algorithmic trading strategy optimization
- Sentiment analysis from financial news
- Price prediction models (we have an example below)
- Fraud detection in transactions
- Anomaly detection in market data
- Portfolio management and optimization
- High-frequency trading algorithms
- Risk management and assessment
- Real-time trading analytics
- Real-time trading signal generation
- Predictive analytics for trading
- Predictive modeling for stock prices
- Behavioral finance models
- Algorithmic trading strategy development
- Portfolio risk analysis
- Market trend analysis
- Trade execution optimization
- Asset allocation and diversification strategies
- Credit scoring for lending decisions
- Forecasting
- Trading bot automation and decision-making
Going off some of the examples we listed above:
Algorithmic Trading
You can use TensorFlow and Keras to build automated trading systems (bots) that can analyze market data, identify trading opportunities, and execute trades based on your defined strategy.
Price Prediction
Train models to predict future price movements based on historical data and various market indicators.
Market Analysis
Build models to uncover hidden patterns and relationships within market data, which can potentially lead to better trading decisions.
Things to Know
Data Quality
The quality of your financial data is a huge part of the performance of your models.
Make sure you have reliable, clean, and up-to-date data.
Backtesting and Evaluation
Backtest your trading models on historical data to understand their effectiveness and potential risks before deploying them with real capital.
Always understand why something works and its track record.
TensorFlow & Keras in Price Prediction & Time Series Forecasting
Using TensorFlow and Keras for predicting the future paths of a portfolio involves creating a predictive model that can analyze historical data and forecast future values.
The process typically includes data collection and preprocessing, feature engineering, model selection and training, and finally, prediction and evaluation.
Here’s how you might approach this:
1. Data Collection and Preprocessing
Gather historical data
Collect historical data on the assets in the portfolio, including prices, volumes, and potentially external factors that could impact the portfolio (like interest rates, economic indicators, etc.).
Whatever is relevant to performance.
Normalize the data
Financial data often needs to be normalized or standardized to be effectively used in machine learning models.
2. Feature Engineering
Create features
Develop features that the model can use to make predictions.
This could include moving averages, relative strength index (RSI), or other technical indicators.
For a portfolio, you might also consider the historical returns, volatility, or other portfolio-specific metrics.
Determine the target variable
Define what you’re trying to predict.
For a portfolio, this could be future returns, risk metrics, or the value of the portfolio at some future time.
3. Model Selection and Training
Choose a model type
For time series data, models like recurrent neural networks (RNNs), long short-term memory networks (LSTMs), or gated recurrent units (GRUs) can be effective.
Convolutional neural networks (CNNs) and traditional dense networks might also be used depending on the feature structure.
Build the model
Using TensorFlow and Keras, construct the model architecture.
This would involve:
- defining the layers
- neurons
- activation functions, and
- the loss function, and
- configuring the training process (e.g., optimizer, learning rate)
Train the model
Train the model on the historical data, using a portion of the data for training and a separate portion for validation to monitor for overfitting.
4. Prediction and Evaluation
Make predictions
Use the trained model to predict future values of the portfolio based on the most recent data.
Evaluate the model
Assess the model’s performance using appropriate metrics, such as mean squared error (MSE) for regression tasks.
For a portfolio, you might also consider the accuracy of the return direction, the Sharpe ratio, or other financial metrics.
5. Backtesting
Simulate historical performance.
Use the model to simulate decisions on historical data and compare the portfolio’s performance against a benchmark.
This can help validate the model’s effectiveness in a real-world scenario.
6. Optimization and Refinement
Tune the model
Adjust model parameters, experiment with different architectures, and refine the feature set to improve performance.
Regular updates and retraining
Financial markets evolve over time, so regularly updating the model with new data and retraining is important to maintain its accuracy.
Implementation Example
In TensorFlow and Keras, this might look like creating an LSTM network for a time series prediction of the portfolio’s value.
You would feed the network with sequences of historical data points as inputs and train it to predict the next time point’s value.
We’ll do this below.
TensorFlow & Keras Example #1
As a running example in our articles with coding examples, we look at the following 4-asset portfolio, this time with example asset allocations:
- 40% Stocks: +3-7% forward return, 15% annualized volatility using standard deviation
- 45% Bonds: +1-5% forward return, 10% annualized volatility using standard deviation
- 5% Commodities: +0-4% forward return, 15% annualized volatility using standard deviation
- 10% Gold: +2-6% forward return, 15% annualized volatility using standard deviation
What we want to do is model the future paths of a portfolio using an LSTM (Long Short-Term Memory) network in TensorFlow and Keras.
So, we would need to simulate historical data for each asset class based on the given expected returns and volatilities (our provided assumptions).
We’ll then use this data to train the LSTM model.
After training, we’ll forecast the portfolio’s future path over 30 years.
Here’s our code:
import numpy as np
import pandas as pd
from tensorflow.keras.models import Sequential
from tensorflow.keras.layers import LSTM, Dense
np.random.seed(78)
# Sim historical data for each asset
years_history = 30
returns = {
'Stocks': np.random.uniform(3, 7, years_history) / 100,
'Bonds': np.random.uniform(1, 5, years_history) / 100,
'Commodities': np.random.uniform(0, 4, years_history) / 100,
'Gold': np.random.uniform(2, 6, years_history) / 100
}
returns_df = pd.DataFrame(returns)
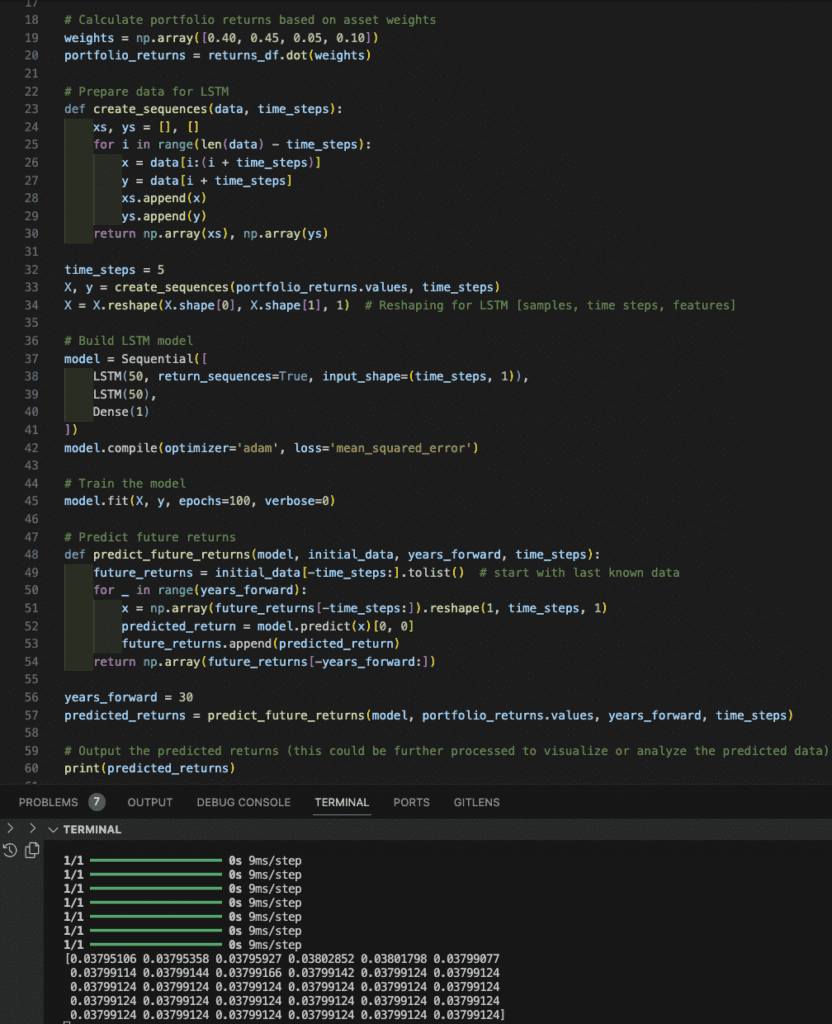
# Calculate portfolio returns based on asset weights
weights = np.array([0.40, 0.45, 0.05, 0.10])
portfolio_returns = returns_df.dot(weights)
# Prepare data for LSTM
def create_sequences(data, time_steps):
xs, ys = [], []
for i in range(len(data) - time_steps):
x = data[i:(i + time_steps)]
y = data[i + time_steps]
xs.append(x)
ys.append(y)
return np.array(xs), np.array(ys)
time_steps = 5
X, y = create_sequences(portfolio_returns.values, time_steps)
X = X.reshape(X.shape[0], X.shape[1], 1) # Reshaping for LSTM [samples, time steps, features]
# Build LSTM model
model = Sequential([
LSTM(50, return_sequences=True, input_shape=(time_steps, 1)),
LSTM(50),
Dense(1)
])
model.compile(optimizer='adam', loss='mean_squared_error')
# Train the model
model.fit(X, y, epochs=100, verbose=0)
# Predict future returns
def predict_future_returns(model, initial_data, years_forward, time_steps):
future_returns = initial_data[-time_steps:].tolist() # start with last known data
for _ in range(years_forward):
x = np.array(future_returns[-time_steps:]).reshape(1, time_steps, 1)
predicted_return = model.predict(x)[0, 0]
future_returns.append(predicted_return)
return np.array(future_returns[-years_forward:])
years_forward = 30
predicted_returns = predict_future_returns(model, portfolio_returns.values, years_forward, time_steps)
# Output the predicted returns (this could be further processed to visualize or analyze the predicted data)
print(predicted_returns)
Results
Pop this code into your favorite IDE (e.g., Visual Studio Code).
We can find them at the bottom (expected unleveraged return of this portfolio would be around 3.8% per year):
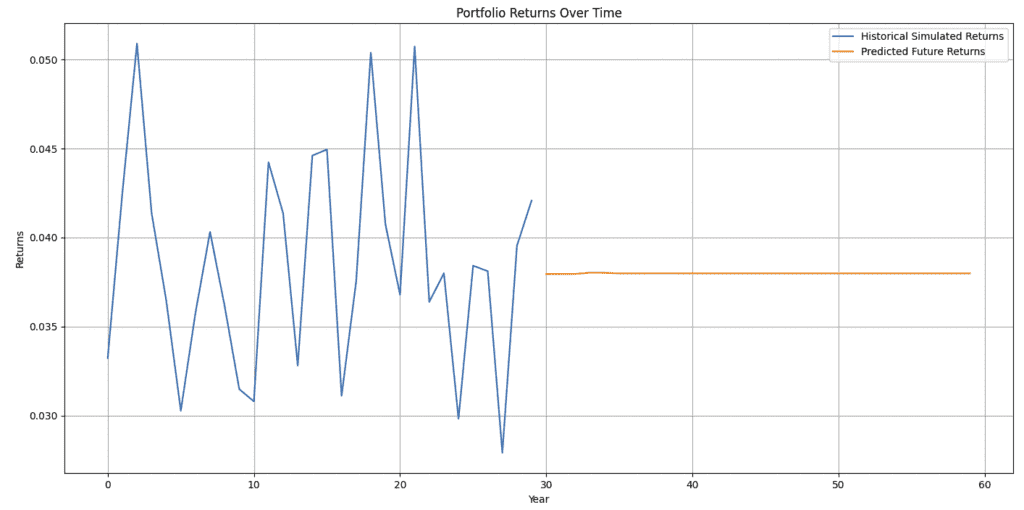
Plot of Results and Future Expected Returns
We need some extra code for this:
import matplotlib.pyplot as plt

# Historical time period
historical_years = np.arange(years_history)
# Future time period, extending 30 years beyond the historical data
future_years = np.arange(years_history, years_history + years_forward)

# Plot the historical and predicted returns
plt.figure(figsize=(14, 7))
plt.plot(historical_years, portfolio_returns.values, label='Historical Simulated Returns')
plt.plot(future_years, predicted_returns, label='Predicted Future Returns')

plt.title('Portfolio Returns Over Time')
plt.xlabel('Year')
plt.ylabel('Returns')
plt.legend()
plt.grid(True)
plt.show()
You can also run it more than once if you’d like.
Just do it with a different seed, which is what’s generating our synthetic data (we’ll switch to 58 from 78).
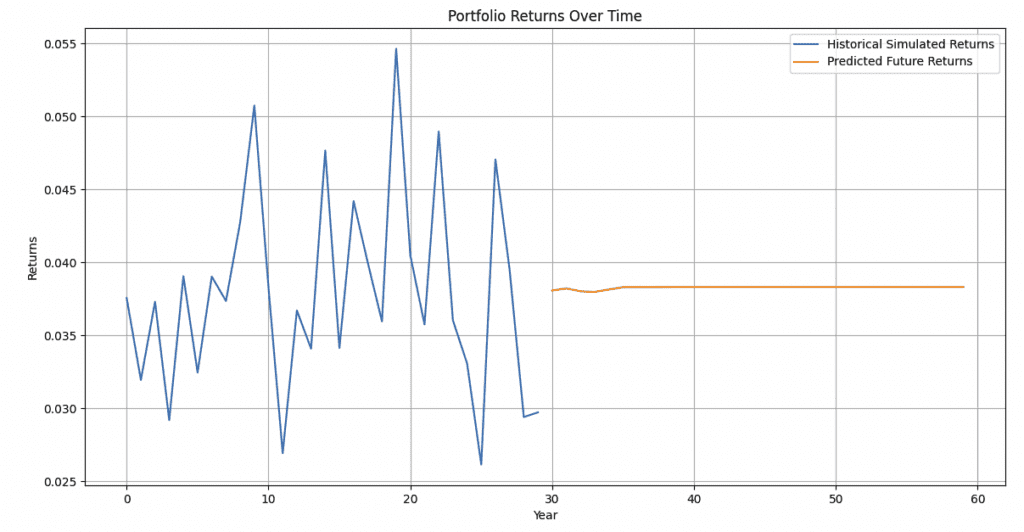
And we see more or less the same results.
TensorFlow & Keras Example #2
Below is an example of how you might use TensorFlow with Keras to create a simple deep learning model for financial data prediction, and then visualize the results using Plotly.
This example will create a model to predict future values in a financial dataset (which is simulated here as random data for demonstration purposes).
Be sure to have what you need installed first.
We like installing these libraries in Python:
pip install matplotlib numpy pandas scipy seaborn scikit-learn keras statsmodels plotly ecos scs
Then we have these steps:
- Data Preparation – Generate some dummy financial data. (Use real-world data for real-world problems.)
- Model Building – Create a simple neural network using Keras.
- Training – Train the model on the data.
- Prediction – Make predictions with the trained model.
- Visualization – Visualize the predictions using Plotly.
The code:
import numpy as np
import pandas as pd
import tensorflow as tf
from tensorflow import keras
import plotly.graph_objects as go

# Sim some financial data
np.random.seed(7)
dates = pd.date_range(start='2024-01-01', periods=100)
data = np.random.randn(100).cumsum()
df = pd.DataFrame(data, columns=['Price'], index=dates)

# Prepare dataset for training
window_size = 5
features = []
labels = []

for i in range(window_size, len(df)):
    features.append(df.iloc[i-window_size:i, 0])
    labels.append(df.iloc[i, 0])

features, labels = np.array(features), np.array(labels)

# Split the dataset into training & testing
split = int(len(features) * 0.8)
train_features, test_features = features[:split], features[split:]
train_labels, test_labels = labels[:split], labels[split:]

# Build a simple LSTM model
model = keras.Sequential([
    keras.layers.InputLayer(input_shape=(window_size,)),
    keras.layers.Dense(64, activation='relu'),
    keras.layers.Dense(1)
])

model.compile(optimizer='adam', loss='mse')

# Train the model
model.fit(train_features, train_labels, epochs=10, batch_size=1)

# Make predictions
predictions = model.predict(test_features)

# Visualize the results
fig = go.Figure()
fig.add_trace(go.Scatter(x=dates[split+window_size:], y=test_labels, mode='lines', name='Actual'))
fig.add_trace(go.Scatter(x=dates[split+window_size:], y=predictions.flatten(), mode='lines', name='Predicted'))

fig.update_layout(title='Financial Data Prediction',
                                  xaxis_title='Date',
                                  yaxis_title='Price')

fig.show()
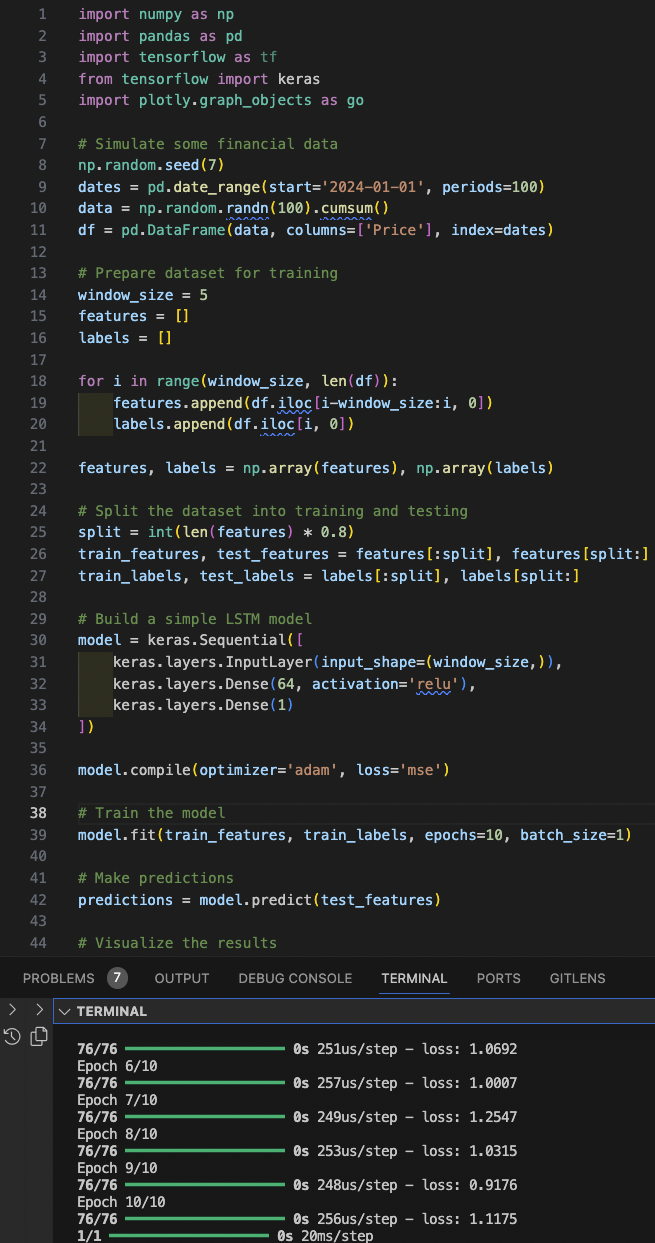
Results
And here’s our visualization showing that the neural network follows actual data reasonably well:
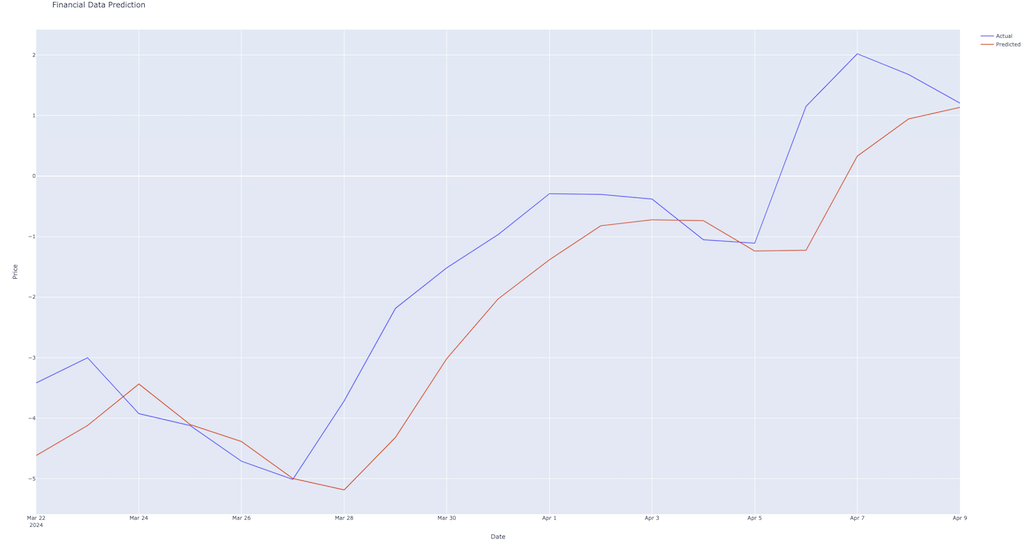
Overall, this code is a basic example of a machine learning workflow in financial data prediction, showing data preparation, model training, prediction, and visualization of results.
Conclusion
TensorFlow and Keras are great Python libraries for quantitative finance, but they should be used with a deep understanding of the markets with a focus on robust model development and evaluation.
The use of neural networks in this article is basic and serves as a starting point for more complex financial time series forecasting models.