Hidden Variables in Finance


Hidden variables in finance refer to elements that aren’t directly observable or quantifiable but significantly influence financial markets and investment outcomes.
These variables often exist beneath the surface of standard financial analyses, impacting asset performance, market movements, and risk assessments.
Key Takeaways – Hidden Variables in Finance
- Hidden variables in finance, like central bank policies and social media trends, influence market dynamics beyond traditional financial metrics.
- Correlation analysis between stock prices and these hidden variables can reveal their impact, though it doesn’t necessarily imply causation.
- Focusing deeply on the full range of causes and effects on markets can help brainstorm and understand what these hidden variables are and how they impact prices.
Impact on Market Dynamics
Market dynamics are often influenced by psychological, sociopolitical, and environmental factors that are not always evident in financial statements or economic indicators.
Investor sentiment, geopolitical events, and even climate change repercussions can act as hidden variables, which can affect market volatility and investor behavior.
Role in Trading & Investment Decision-Making
Investment/trading decision-making frequently hinges on factors that standard financial models don’t account for.
These include management quality, company culture, and technological innovation.
While difficult to measure, their impact on a company’s future performance and risk profile can matter a lot.
Hidden Variables in Risk Assessment
Risk assessment can be skewed by hidden variables.
Traditional risk models might not fully consider the impact of regulatory changes, market disruptions, or technological advancements.
This can lead to an incomplete understanding of the true risk landscape.
Financial Crises and Hidden Variables
Historical financial crises highlight the role of hidden variables.
For example, the 2008 financial crisis was partially fueled by the underestimation of systemic risk and overreliance on flawed financial models that ignored important market dynamics.
Strategies for Uncovering Hidden Variables
To uncover hidden variables, traders and analysts must look beyond conventional metrics and models.
This involves qualitative analysis, studying market psychology, and considering broader socioeconomic trends.
- What are the cause-effect mechanics that go into this market?
- Who are the buyers, who are the sellers?
- How big is each player?
- What are they motivated to do?
- How do they act in response to certain variables (e.g., changes in discounted growth, inflation, discount rates, risk premiums)?
It also requires a continuous process of learning and adaptation.
Coding Example – Hidden Variables of Influences on Stock Prices (Actual Value vs. Theoretical Value)
For example, we know that the theoretical value of stock prices is earnings (cash flows) over time discounted back to the present.
But the price of a stock, in practice, is simply the money and credit used to buy it divided by the number of shares.
So, hidden variables include things like liquidity conditions provided by central banks, social media promotion of a company, and so on.
Creating a coding example to identify the influence of hidden variables in financial analysis involves a multi-step process.
Since we can’t directly quantify hidden variables like liquidity conditions or social media influence, we must infer their impact indirectly.
One way to do this is by analyzing correlations between known financial indicators and market movements, and then comparing these with external factors such as central bank policies or social media trends.
Here’s a high-level outline of how we get to a code that attempts to do this:
Data Collection
Gather data on stock prices, earnings, central bank liquidity measures (like interest rates or quantitative easing programs), and social media sentiment analysis.
For social media analysis, we can use APIs to track mentions and textual/NLP sentiment about specific companies.
Since we’re doing a representative example, we’ll generate synthetic data in our code.
Data Preprocessing
Clean and normalize the data.
This includes handling missing values, converting data into a consistent format, and normalizing different scales. (The usual stuff.)
Analysis of Financial Metrics
Compute traditional financial metrics like Price-to-Earnings (P/E) ratios and compare them with stock prices over time.
Analysis of External Factors
Analyze central bank liquidity measures and social media sentiment over the same time period.
Correlation Analysis
Look for correlations between stock price movements and these external factors, beyond what can be explained by traditional financial metrics.
Visualization
Plot the data and correlations to visually inspect the relationships.
The following code is done in Python:
import pandas as pd
import numpy as np
import matplotlib.pyplot as plt
from scipy.stats import pearsonr

# Synthetic data
np.random.seed(86)

# Dates
dates = pd.date_range(start='2010-01-01', end='2024-1-16', freq='B')

# Synthetic stock prices (simulated w/ some noise)
stock_prices = np.random.normal(loc=100, scale=10, size=len(dates))

# Synthetic central bank liquidity measure (e.g., interest rate, QE)
liquidity_measure = np.random.normal(loc=0.5, scale=0.1, size=len(dates))

# Synthetic social media sentiment (scaled from -1 to 1)
social_sentiment = np.random.uniform(low=-1, high=1, size=len(dates))

# DataFrames
stock_data = pd.DataFrame({'date': dates, 'price': stock_prices})
liquidity_data = pd.DataFrame({'date': dates, 'measure': liquidity_measure})
social_media_data = pd.DataFrame({'date': dates, 'sentiment': social_sentiment})

# Correlation Analysis
correlation_stock_liquidity, _ = pearsonr(stock_prices, liquidity_measure)
correlation_stock_social, _ = pearsonr(stock_prices, social_sentiment)

# Visualization
plt.figure(figsize=(15, 5))

# Stock Prices and Liquidity Measure
plt.subplot(1, 2, 1)
plt.plot(stock_data['date'], stock_data['price'], label='Stock Price')
plt.plot(liquidity_data['date'], liquidity_data['measure'], label='Liquidity Measure')
plt.legend()
plt.title(f'Correlation (Stock & Liquidity): {correlation_stock_liquidity:.2f}')

# Stock Prices and Social Media Sentiment
plt.subplot(1, 2, 2)
plt.scatter(social_media_data['sentiment'], stock_data['price'])
plt.xlabel('Social Media Sentiment')
plt.ylabel('Stock Price')
plt.title(f'Correlation (Stock & Social Media): {correlation_stock_social:.2f}')

plt.tight_layout()
plt.show()
And we get the following charts from this code, representing the correlation between stock prices and liquidity and stock prices and social media sentiment:
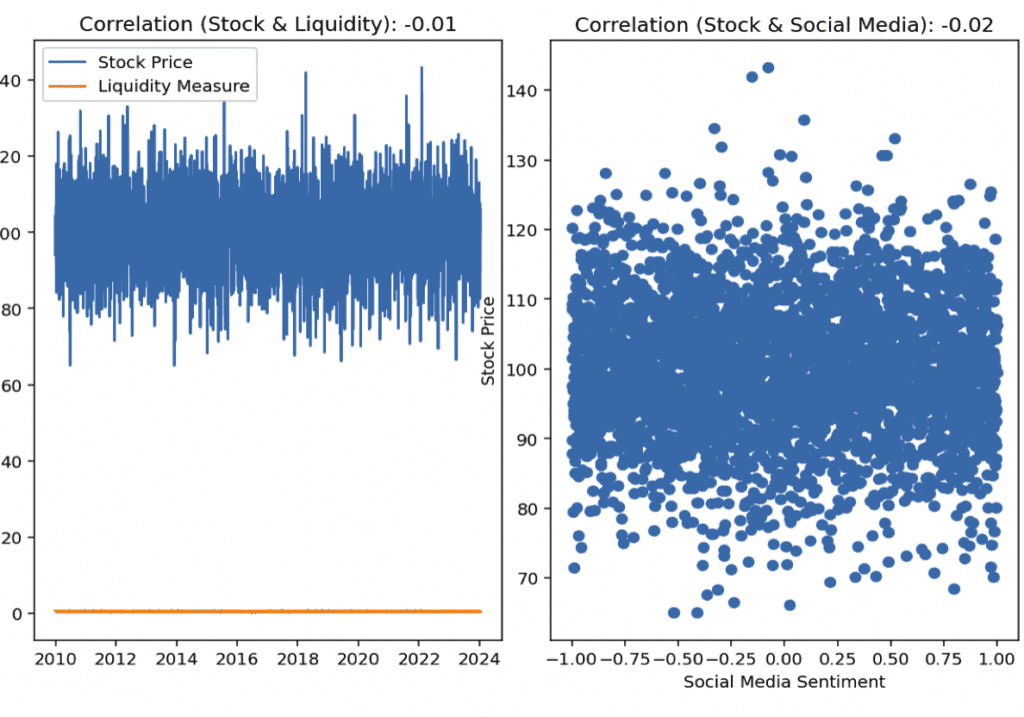
These are not real charts showing the correlations between actual real-world variables. It’s just synthetic data as a means of illustration.
This code is highly simplified and serves as a conceptual framework.
In practice, fetching and analyzing this data requires access to specific financial and social media APIs, and a deeper statistical analysis to draw meaningful conclusions.
The hidden variables impacting equity prices also aren’t just liquidity and social media sentiment.
Also, it’s important to be aware that correlation doesn’t imply causation, and external factors in finance can be incredibly complex and interdependent.
Conclusion
Hidden variables and their elusive nature challenge traditional financial models and decision-making processes.
Recognizing and understanding these variables can provide a more comprehensive view of the markets you trade.