Asset Class Starting Points for 2021

In this article, you can find the asset class starting points for 2021 for many types of benchmarks, including stocks, bond yields, exchange rates, commodities, and cryptocurrencies.
We have 2020’s asset class starting points located here.
Many traders, especially those that specialize in stocks, bonds, or macro, keep track of the major indices and their own portfolio’s progress in relation to them to gauge their results.
The most commonly tracked equity benchmark is the S&P 500.
Traders who are more tech-focused might gauge their progress relative to the NASDAQ.
Small cap managers might measure their progress through the Russell 2000.
Emerging market equity managers often compare themselves to the MSCI Emerging Markets Index (MXEF in terms of the corresponding futures contract).
Bond traders or those focused on corporate credit might track a corporate bond index, such as the iBoxx $ Liquid Investment Grade Index. It goes under the symbol LQD in ETF form.
Those who focus on the high yield space might track themselves against the iBoxx $ Liquid High Yield Index, which is HYG in ETF form.
The most commonly followed bond globally is the 10-year US Treasury. The USD is the world’s top reserve currency and the 10-year is the most popular benchmark duration.
The J.P. Morgan Government Bond Index Emerging Markets Global Core Index covers local currency emerging market debt for emerging markets managers and goes under the symbol EMLC in ETF form.
Oil and gold traders will of course monitor their own performance against the performance of the underlying commodity.
Commodity traders will measure themselves against something like the Bloomberg commodity index, which is represented by the AIGCI futures contract (and accessible through such brokers as IBKR).
For rates traders, the fed funds rate will start 2021 at 0.09 percent and is very unlikely to change from that.
After the crash of 2020, we are now on a monetary policy that focuses on unifying the monetary side with fiscal policy, what some might call MMT.
All the main currencies made gains against the USD in 2020.
The EUR/USD, the cross between the world’s top two reserve currencies begins 2020 at 1.22 (up from 1.12 to start 2020).
The GBP, after a year in which it was most sensitive to Brexit’s impact on the UK’s future capital flows and balance of payments, will start at around 1.367 to the dollar (up from 1.326 to start 2020).
The USD/JPY will begin at around 103 (down from 109 to start 2021).
The USD/CNH (offshore yuan / renminbi) begins the year at 6.495. More traders globally are tracking the yuan as China rises in power globally and brings along its currency into reserve status.
Yields on assets going into 2021
All assets compete with each other for the availability of capital globally.
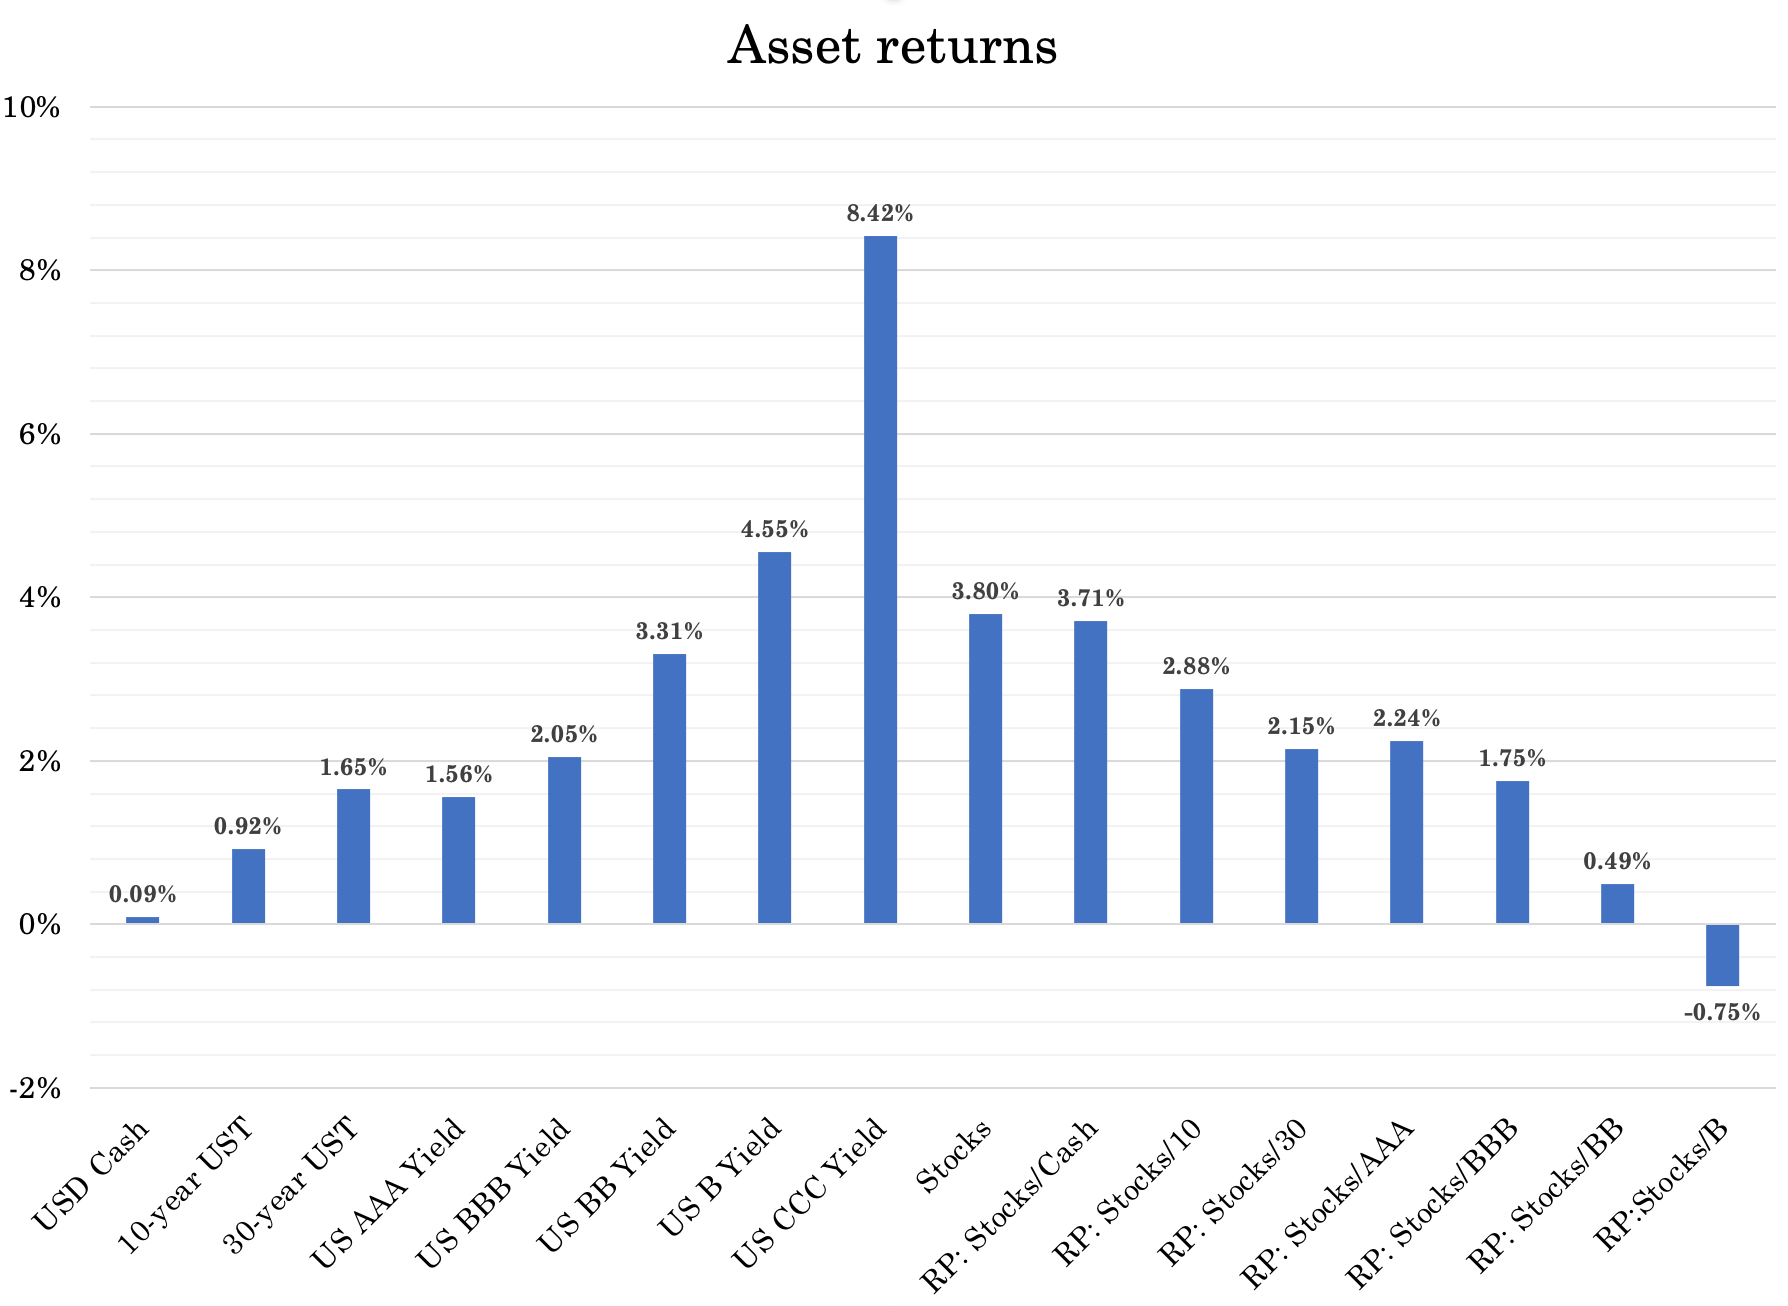
You can build a yield curve of all asset classes, going from the most conservative investment (cash; and in this case, in USD) through to longer duration bonds, to corporate bonds, equities, and the riskiest of all public asset classes taken collectively (CCC or lower credit).
To the right of the CCC or lower column in the graph shows the risk premiums (“RP”) between various asset classes or the expected return differential over one year.
These yields are relevant to USD assets. Nonetheless, this process of looking at (or backing out) the discounted future can be done for all countries that have developed capital markets.
Equities don’t inherently have a yield, as their cash flows are theoretically perpetual.
Accordingly, a common proxy for the yield on stocks is the forward one-year earnings yield.
Earnings can be found by either forecasting earnings top-down (building macroeconomic indicators and how they translate into earnings for the particular index) or bottom-up by going by each individual company in the index and its weighting.
Since the forward P/E of US stocks is around 26x to start the year given the starting price (3,756) and expected earnings out over the year (144).
The quotient of 3,756 and 144 is about 26.
This means that about 26 years of earnings would expect you to earn the equivalent to the principal amount invested. One over that number is the forward one-year yield. If 26, that comes to about 3.8 percent.
The large liquidity produced by central banks throughout the Covid-19 pandemic has produced tight spreads.
This makes for a more challenging environment for investors and traders looking for risk at reasonable prices.
Equities (most people’s favorite asset class) maintain a pretty normal spread over 10-year safe bonds in the ~3 percent vicinity.
But given the 10-year yield is so low, that means investors should expect a long-run return of maybe around 4 percent, or about two percent in real terms. If inflation climbs, then the nominal yield would expect to be better, but that won’t help in real terms, which is what matters in terms of purchasing power.
Cash yields effectively nothing. The 10-year isn’t much better. It yields negative in real terms and comes with duration risk, meaning the price movement is much more vulnerable to shifts in interest rates.
The 30-year gives just 1.65 percent. That means just a 6-bp adverse move (0.06 percent – 1.65 percent divided by its effective duration of about 26) in interest rates would effectively offset its entire annual yield. It’s a lot of price risk for negative real return.
As bond traders in developed Europe and Japan know, their yields are already zero and in many cases negative.
That reality is now setting in within the US. This has implications for the dollar, now that the US no longer has an interest rate or growth advantage.
When you get into corporate credit, you’re dealing with potential defaults, which isn’t much of an expected issue with developed market sovereign credit where debt can always be paid in nominal terms.
The bottom tier of BBB gives only about two percent, or expected inflation. You take on material credit risk for no real return.
The beginning of BB – high yield or “junk grade” – gives only barely over three percent.
CCC bonds are the riskiest of the main liquid asset classes.
CCC credit tends to trade with a relatively high correlation at the beginning of the business cycle. This is because all companies tend to recover as economic prospects improve and lending conditions turn up. Improved liquidity is a factor as well.
But at the latter part of cycles, more company-specific credit research is typically required. Triple-C is more of a “pick and choose” market that doesn’t trade as monolithically as some of the better quality credit.
The “capital market line“, or determining the yields of various assets in relation to each other, where higher risk must be compensated with higher return, also carries through to real estate, private equity, and other investments beyond just the tradable liquid asset classes.
2021 starting reference points for various asset classes
Below is a range of starting reference points for a variety of assets as 2020 opens.
Equities
- S&P 500: 3,756
- NASDAQ: 12,888
- Dow Jones Industrial Average (DJIA): 30,606
- Russell 2000: 1,975
- FTSE 100: 6,460
- DAX: 13,718
- CAC 40: 5,551
- Stoxx 600: 399
- FTSE MIB: 22,232
- Nikkei 225: 27,444
- Hang Seng: 27,231
- Shanghai: 3,473
- BSE Sensex: 47,869
Bonds and Rates
- Fed funds rate: 0.09 percent
- US 2-year: 0.13 percent
- US 5-year: 0.36 percent
- US 10-year: 0.92 percent
- US 30-year: 1.65 percent
- German 10-year: minus-0.57 percent
- Japan 10-year: 0.02 percent
- UK 10-year: 0.20 percent
- Australia 10-year: 0.98 percent
- Canada 10-year: 0.72 percent
- China 10-year: 3.17 percent
- Italy 10-year: 0.55 percent
- Spain 10-year: 0.04 percent
- EMLC (local currency EM debt ETF): $33.27
- USD AAA yield: 1.56 percent
- USD BBB yield: 2.05 percent
- USD BB yield: 3.31 percent
- USD B yield: 4.55 percent
- USD CCC yield: 8.42 percent
- US equities 2021 earnings estimate (start of year): 144
- US equities 2021 earnings yield (start of year): 3.83 percent
Currencies / FX
- EUR/USD: 1.218
- USD/JPY: 103.24
- GBP/USD: 1.3673
- USD/CHF: 0.8900
- Dollar Index (DXY): 89.93
Commodities
- WTI crude oil: 48.42
- Brent crude oil: 51.72
- Gold: 1,902
- Silver: 17.90
Cryptocurrencies (in USD)
- Bitcoin: $29,330
- Ethereum: $729
- Ripple: $0.23
- Bitcoin cash: $340
- Litecoin: $125
- Monero: $133