Coronavirus Crash: How It Differs From Previous Bear Markets

The coronavirus crash is unique as a tail event and unique in that it represents the first major economic shock when policymakers lack the traditional ways of dealing with it.
While the coronavirus is a serious infectious disease that has caused and will continue to cause economic harm, the financial and economic problems are much harder to deal with when rates can no longer be lowered.
This down move in the economy would have happened eventually; the coronavirus simply happened to be the trigger.
As covered in previous articles, we have been concerned about what the next downturn would look like when monetary policymakers no longer have the means to lower interest rates (the primary form of monetary policy) or buy financial assets (secondary form of monetary policy).
The traditional way recessions are caused in developed markets is due to the inflation-output trade off that monetary policymakers have to deal with.
Normally, as unemployment falls and inflation begins to pick up, monetary policymakers have a much more acute trade off balancing growth with inflation. It’s hard to get right and sometimes central bankers must choose to corral inflation by hiking rates. This causes credit costs to go up in excess of the ability to pay for them and the economy enters a recession. The central bank then eases by lowering interest rates and the cycle repeats itself.
That’s the normal dynamic that’s been behind other bear markets.
The coronavirus crash is different. We’re not dealing with the output and inflation trade off. Rather we’re dealing with what happens when debt is high relative to output and you can’t lower interest rates or buy longer-duration assets to ease policy.
When you can’t put a floor under it – namely, pushing nominal interest rates below nominal growth rates – then the contraction keeps on going.
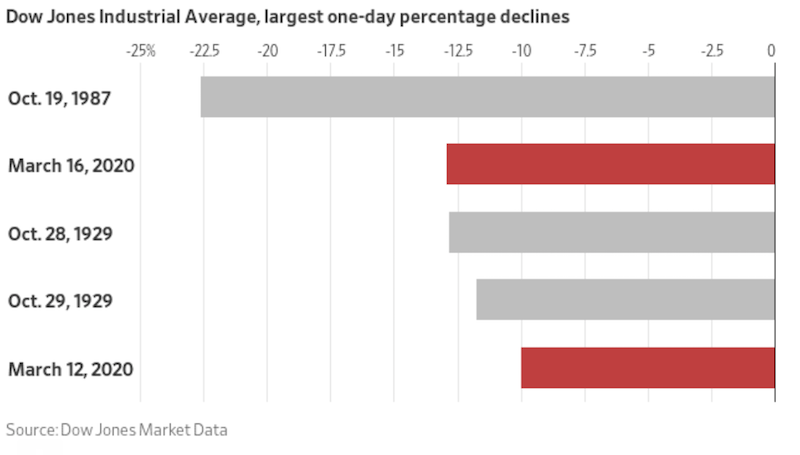
This is why the market sell-offs have been so sharp and enduring and worse than what we saw in 2008 and comparable to those during the worst moves of the Great Depression.
During the financial crisis, the Federal Reserve could cut rates from a point of more than 5 percent. When it started the first round of quantitative easing – which got stocks to finally bottom in March 2009 – the 10-year US Treasury was around 3 percent. Interest rates could be lowered and there was enough of a liquidity premium in Treasury bonds and mortgage-backed securities such that it could be stimulative to the economy. Namely, their yields were still materially above zero, unlike now.
It also meant that this prevented a lot of further debt defaults. This was good, but it also meant that the economy had to start the next expansion with a high debt base. But that high debt base also meant growth would slog along at a very moderate pace and the risks over a further dip in the economy were going to be high with that type of debt overhang.
Consumer balance sheets largely improved.
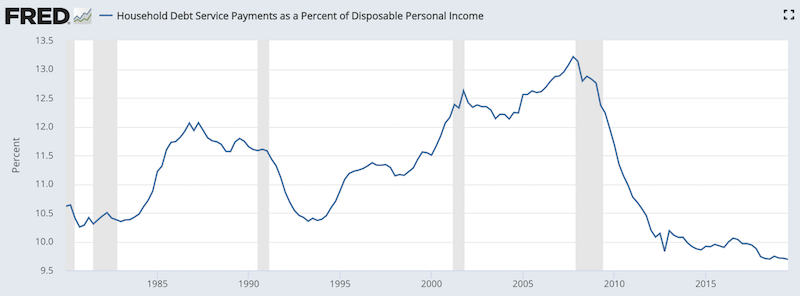
(Source: Board of Governors of the Federal Reserve System (US))
But cheap credit also meant that corporations went on a borrowing binge.
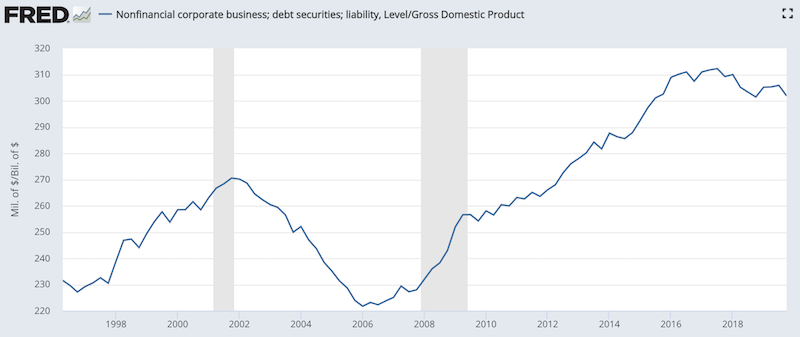
(Sources: BEA, Board of Governors)
In particular, because the rate they could borrow at was so cheap relative to the return on equity, this led to a wave of share buybacks. This boosted equity prices. But it also leveraged corporate balance sheets to a point where they’re vulnerable to a trigger that sends the economy down and hurts revenue.
When interest rates are at zero or a bit below zero, there isn’t much stimulative capacity left. Then the central bank goes into buying bonds, but those are already very close to zero.
When central banks are out of room on both policies, that means essentially all asset classes will get hit because the positive effects from lowering interest rates are no longer available.
Central banks can take front-end interest rates negative, but it won’t accomplish much in making people move out of cash. Buying more bonds can push bond yields negative.
There’s a limitation to how low bond yields can go. People still need safety and liquidity. If the central bank “prints” money and uses that buy bonds, it’s not going to push the entities they’re buying those bonds from into the assets of riskier entities with rockier financial situations.
Yield curve control won’t accomplish much, where the central bank pegs the front-end of the curve at some level and a longer-duration level at a higher (but still low) yield. This helps keep a positive spread between short-term interest rates and longer-term interest rates to help lenders, but has limited use.
Moreover, because of lower commodity prices, economic weakness, and additional credit trouble, this will bring in additional deflationary pressures. Because rates can’t be lowered much below zero, this will cause real (i.e., inflation-adjusted) interest rates to increase and potentially cause the currency to rise where this occurs. A rising currency acts like a tightening of monetary policy.
A brief aside on currencies
From the US point of view, it would be of benefit, on a macro level, to have a dollar devaluation relative to current levels. That would help get US pricing in line with the rest of the world. This is virtually true of all other major developed economies. When debt is high relative to income, you generally don’t want a higher currency.
We were already in a disinflationary environment due to a confluence of different factors – not only high debt, but also sluggish productivity, declining growth (effect of the washout of the 2017 tax cut), and various technological innovations and labor arbitrage behaviors that have kept pricing pressures under control.
So, US policymakers should be content to see the currency settle downward in terms of the equilibrium point. But one currency’s depreciation affects other countries and jurisdictions as well. This incentivizes other policymakers to prevent an appreciation in their own currencies.
The US also has a lot of external debt denominated in dollars – roughly 45 percent of domestic GDP.
To get relief on this front, the US would want to see the dollar depreciate. A declining currency is helpful for anyone with liabilities denominated in it.
Foreign exchange devaluations also help risk asset markets, holding all else equal. One of the best ways to help keep a floor under stocks is to devalue the currency.
The coronavirus crash and its effect on credit spreads
Credit spreads widen when revenues and earnings decline. This is because the likelihood of companies being able to pay their debt back on time becomes less likely.
That means borrowing becomes more expensive at the same time credit lending is pulled back. This makes debt service payments increase at the same time paying them becomes more difficult.
This becomes a type of negative feedback loop that exacerbates the credit tightening, negative growth and deflationary pressures. A rising currency makes matters worse. This is true for a country like the US, as a rising currency squeezes foreign borrowers by making their debt payments more expensive.
The coronavirus crash and its impact on unfunded liabilities
In previous articles we talked about the unfunded liabilities facing governments and other entities (e.g., pension funds, insurance companies). When companies (and countries) suffer hits to their revenue and have trouble meeting their obligations, they’re likely to have to sell assets to meet their payment obligations.
For oil producers, which is as much a big corporate business globally as it is a national and state-sponsored business, this shock to their revenue means they will have to cut spending and sell off assets to cover their shortfall. Big swings in commodity prices rarely cause recession for large developed economies because of their degree of diversification, but it can be part of the equation and swing GDP to an extent.
Other types of businesses will be in similar types of situations where their expenses are now in excess of their assets – particularly assets that are readily able to be turned into cash – which leads to sales and deepening problems in asset markets and economies.
Moreover, many of these assets are financed through debt, which makes the situation worse because they were bought with money they didn’t have. This only aggravates the effect and means more expense slashing, more selling of assets, and more credit tightening.
It can get out of hand if not handled appropriately.
What policymakers have to do
We covered this very recently, so we will defer to other articles that listed this out more in full. But the market is likely to bottom when policymakers bring about a stimulus package that is adequate relative to the scale of the crisis.
The Trump administration recently brought out a package that could be up to $850 billion in total spending. Based on the figures we have, there’s going to be about a $400 billion gap in missing output in Q2.
If appropriately targeted, $850 billion should be enough to cover the shock to Q1, Q2, and some extra insurance for Q3. It depends on how long the coronavirus scare lasts and the economic impacts. It could not be enough. The market liked it, moving up 6 percent.
Until something is finalized, the market is likely to trade off rumors and actions pertaining to any such stimulus package – both the size and who it’s targeted toward.
This means bridge loans and direct targeted support to entities most in need. While some decry these moves as “bailouts”, the cost of not providing support to otherwise viable entities is greater than the cost of providing support.
The Fed’s announcement to put interest rates back at zero wasn’t adequate because interest rates were already priced to be there in the first place. Its intention to buy up to $700 billion in US Treasuries and mortgage backed securities also wasn’t sufficient because it won’t materially lower rates to ease debt servicing burdens or get investors into the type or risky assets that will help out financially troubled businesses. Investors still need safety and liquidity.
This is why, as discussed in a different article, it’s essentially to move onto tertiary policy options that can help provide a floor under the economy when a trigger hits at some point.
Currently, the bond market is the constraint when it comes to easing monetary policy further. Namely, asset buying no longer works. This occurs when spreads further out on the rate curve hit close to zero, as is happening currently.
They could theoretically buy stocks. But it would likely require Congressional approval and may not be politically acceptable. Democrats would likely be almost unanimously against it; and Republicans, largely being against excessive centralized control of the economy, would also likely mostly be against such a proposal.
This means spending has to be separated from borrowing. There are different ways to do it that follow a spectrum. It could mean the central government (i.e., the fiscal arm) controls the spending while the central bank directly provides the funding.
What would otherwise require the issuance of a lot bonds to support a fiscal deficit would effectively be directly monetized by the central bank “printing” money.
On the other side of the spectrum, this could mean the central bank printing money and putting it directly in the hands of spenders and tying it to spending incentives, such as having it disappear if not spent after a certain amount of time. This is also known as “helicopter money”. The legality of this depends on where you go.
And how this would work exactly depends. Do you means-test it? Does it go to all adults, or adults and children equally? Would it be one-off? Continued throughout time? Directed toward certain business accounts?
How much would be spent would be dependent on the scale of the crisis.
These all seem like unusual policies. But like QE (i.e., asset buying) at the time in 2009, they only seem unusual because they haven’t happened in our own lifetimes. They have happened throughout history.
What’s happened so far
So far, there have been some measures taken in the US, amounting to $9.2 billion in aid.
But it’s been too small and not targeted enough to make much of a difference.
President Trump offered the idea of a payroll tax cut, but won’t adequately target where the problems are.
If we take the 2011-12 payroll tax cut, this amount to about 60bps of GDP, which would amount to 75-80bps of GDP today.
But this is unpopular among Democrats and some Republicans because payroll tax cuts benefit higher earners more than lower earners and cut into Social Security funding. Moreover, some consider the business part of the cut as too friendly to business.
This does means that Trump is thinking of ways to produce a big stimulation (see the $850 billion mentioned above), particularly as he faces re-election and the effects of the coronavirus will still be on the minds of people in November.
However, will the size of such stimulus be appropriately targeted and of sufficient size to get the markets and economy to bottom?
It’s hard enough to respond quickly and boldly as things are being thrown at you (i.e., double-digit-percentage daily drops in the stocks).
It’s even harder when political fighting is high and they don’t know how bad the problem really is because it’s not just “virus hysteria” that’ll go away, but something that’s bled into the credit system and has knock-on effects that can get out of hand.
When policymakers are slow to respond, as they are now, it makes the downturn worse because there is nothing to offset the downward pressures, which become self-reinforcing.
Are we in a recession?
Likely, though the exact nature of the move isn’t certain and can only be imperfectly measured.
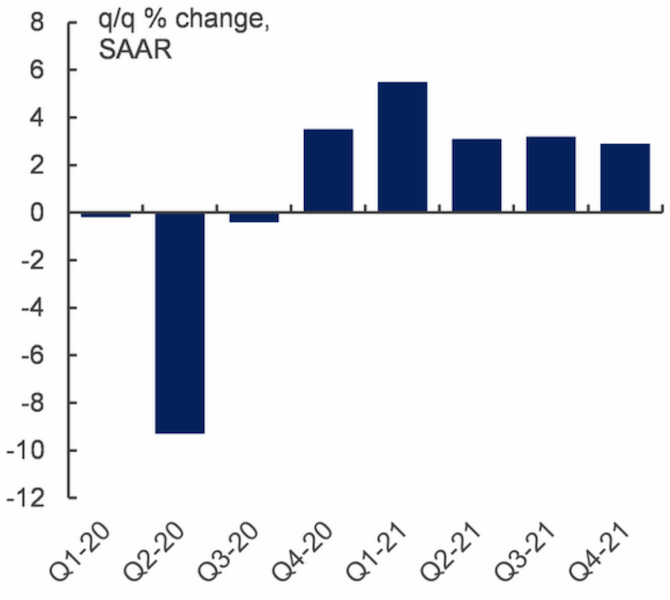
Here is Scotia Bank’s estimation and future estimates of US economic activity on a quarter-over-quarter basis.
Moody’s Analytics estimates on a year-over-year basis:
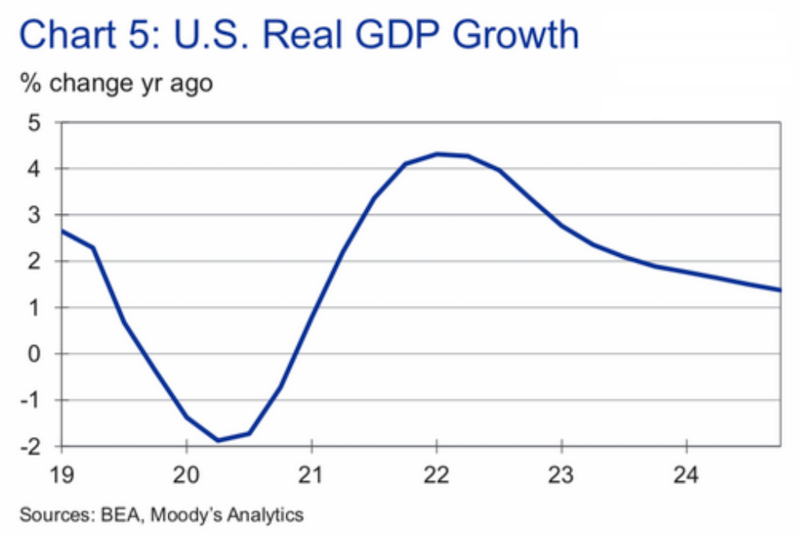
How this differs from the Q4 2018 drop
In Q4’18, there was a 20 percent drop in the US stock market. While the NASDAQ fell 20 percent, the S&P 500 fell 19.8 percent, which meant that the bull market was still technically alive.
But let’s back up a bit to provide context.
In 2008, the economy’s major debt problems came to a head. There was a lot of debt coming due and not enough income to service it. Stock markets lost about half their value in the US. In some countries, they were nearly wiped out completely (e.g., Iceland).
Central banks drove interest rates down to zero and started asset buying programs. That got a floor under the economy and we had that stimulation from 2008 to 2017. Then central banks felt more comfortable about trying to normalize interest rates, particularly after fiscal stimulation in the US.
However, because the economy started from such a large debt overhang, growth was low, deflationary pressures were still there, so nominal growth was sluggish. That means low interest rates became the norm.
Some had their mindsets set on what was “normal” in the past – interest rates of above 5 percent. But that’s not the right way to think about it when the conditions are different.
When central bankers tried to tighten policy in 2017 and later in 2018, there was a lack of realization that the traditional output-inflation dynamic was virtually a non-factor.
Instead there was a lack of attention to the debt to income situation, which remained high. Central bankers tried to tap the brakes on the economy – the Fed began rolling down the balance sheet and started raising interest rates. The ECB stopped buying bonds to wind down its asset buying program, and there was macro prudential tightening in China to reduce the leverage in its own system.
Because of the high debt, they found that tightening worked better than they anticipated.
At the same time, fiscal stimulation through tax cuts and deregulation was put into law in December 2017. That produced a growth pop in the economy. But as soon as the productivity effects pass through, the spending won’t stop, so once you get on the backside of that it can actually slow things down.
The fiscal stimulation began rolling over at the same time the monetary tightening began kicking in.
The tightening in policy and the removal of liquidity pushed risk premiums up, produced about a 20 percent decline in the stock market. The US dollar went up because real interest rates were higher in the US, the yield curve flattened because short-term rates were pushed up near long-term rates.
It was all very classical in the way traditional bear markets occur.
But it was unnecessary because the debt overhang meant inflation in the traditional way wouldn’t happen. Namely, when there’s a shortage of labor supply and a higher demand for it, that’s when you typically get a rise in inflation (i.e., a higher price for labor). Because of the deflationary elements from the debt and various forms of labor arbitrage and overstated effects of labor market tightness, the Fed overtightened, which led to the stock market correction.
This led to an understanding by policymakers that this cycle was different and we wouldn’t have that type of dynamic. In 2019, central bankers largely gave up on the notion that interest rates could be normalized.
In other words, the way this cycle would end would not be through the normalization of interest rates, but probably due to a different type of trigger – or else a big slog in the economy would take hold absent a trigger.
The coronavirus crash is a different type of dynamic where it was no longer about the equilibrium of the operating capacity of the economy – i.e., the output-inflation trade off – but about a different type of equilibrium where we know that debt can’t rise faster than output.
We went through this topic more in the article covering the markets main three equilibriums.
The financial sector
Unlike 2008, we don’t see a systemic risk in the financial sector. The banking sector, due to capitalization requirements, has deleveraged.
Normally, toward the end of a cycle, the financial sector is over-leveraged. Usually, toward the later innings, banks are funding in the wholesale markets to fund loan demand. When the central bank raises interest rates, their spread ends up getting squeezed due to the extra short-term funding costs. That creates the pullback in credit and triggers the downturn.
But since the financial crisis, the financial sector has deleveraged. Their funding is heavily in core deposits instead of in hot money.
Because of their better capital adequacy, banks were still in a position toward the latter stages to continue providing the liquidity that would keep credit flowing in an economy. So, the dynamics of a tightening were a bit different than they would sometimes be in a normal economy where the banks become increasingly leveraged.
While this doesn’t take away from the reality that stocks have lost 30 percent of their value in a few weeks and have had some of the worst days in history, an overleveraged banking sector would have made this sell-off even worse.
In a more normal environment, a bigger risk for financial markets was the over-extrapolation of strong earnings growth despite margins being around secular highs. What matters most for markets is what’s already discounted in. It was already likely that earnings would fall short of expectations.
Companies had extrapolated forward a lower cost base than what was probably likely. If you combine that with a slowdown in the economy, which was likely regardless, then the operating leverage means that any drop in revenue would have magnified impact on the bottom line.
And, of course, the latent risk to the economy was the continued high debt relative to output. Whenever there’s a lot of leverage in the system, even if it’s no longer concentrated in key entities like banks and large financial institutions, this could produce a sharp drop in risk assets if anything were to pop up that could damage revenue and earnings.
We got this with the coronavirus public health scare.
Final Thoughts
Whenever there’s a sell-off, there’s the tendency for many investors to think “buy the dip”. It’s worked for the past eleven years.
However, each situation is different. This is not merely just a highly infectious version of the flu. It’s something that has spilled over into producing big economic effects, which in turn has had big knock-on effects in extended credit markets that were already vulnerable to a shock in output.
Investors need to be careful because this sell-off is not so much about the virus but a function of much more endemic problems – in particular, high debt relative to income. The virus was just the trigger.
When interest rates hit zero, you’re out of room on the primary form of monetary policy, which is the adjustment of short-term interest rates.
Then you turn to quantitative easing, or asset buying. When those spreads hit zero or a bit below, you’re also out of room. And if you flatten the curve, that’s a constraint on lending because lenders no longer have that spread to work with to lend profitably.
How will policymakers get a floor under the economy and markets? They need fiscal and monetary coordination. This is effectively how such periods have been handled well historically.
The fiscal arm directs spending and investment programs and the central bank provides the money, or in effect monetizes the spending. This has an impact on the currency (weakens it, holding all else equal).
For those concerned about inflation, what’s really happening through such monetary easing measures is negating deflation. This is why the purchase of over $15 trillion in financial assets by central banks since the financial crisis didn’t produce much in the way of inflation. There was a severe debt overhang. So, the purchase of financial assets created an inflation in financial asset prices but not much in the way of inflation in the real economy.
Below is a comparison of the year-over-year growth rates of financial assets versus that of inflation since the financial crisis.
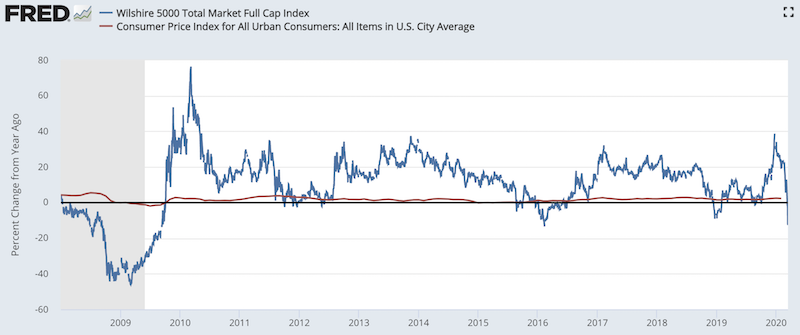
(Sources: U.S. Bureau of Labor Statistics, Wilshire Associates)
As can be observed, the inflation in asset prices (blue line) has greatly exceeded inflation in real goods and services (red line).
The central bank will eventually need to monetize the spending of the central government.
If they can’t get nominal interest rates below nominal growth rates the credit problems will magnify and you’ll keep hitting lower lows in the market. Their actions so far have been inadequate, though the preliminary $850 billion proposal has been encouraging and effectively amounts to 4 percent of GDP. Coming to a resolution is a problem when there’s greater than normal disunity in the political system.
Several of credit metrics for a lot of companies look really ugly. Their expenses and payments on their liabilities swamp their revenue. Naturally, they need to respond to this by slashing spending and selling assets to meet their obligations.
The assets businesses buy are typically financed by debt. Over the past decade-plus, the rate on debt was low relative to the return on equity. This led to a corporate borrowing binge, some of it on investment but a lot of it on financial engineering, such as share buybacks to improve the valuation of their companies.
Now they’ve gotten a trigger – a global health scare of all things – that’s caused their revenue to take a hit, and they need to cut spending and sell off assets to tap liquidity. And at a time when everybody else is in the same boat trying to sell off assets as well. Liquidity is often not there when you need it most.
As a consequence, you have rising credit spreads increasing debt service payments at the same time credit lending is being pulled back. This can develop into a dangerous feedback loop and it’s why we’re seeing days in the stock market where we’re down 10-13 percent, and more among some countries and among certain themes (e.g., like small cap stocks).
This is where companies with clean balance sheets and not much in the way of liabilities will perform best. They are the most likely to see V-shaped recoveries. Leveraged companies with debt coming due are going to have problems.