Macro Momentum Strategy


This article is based on AQR’s paper A Half Century of Macro Momentum (PDF download), which tests a systematic global macro strategy running from 1970 to 2016, using backtested data.
Instead of momentum based on price trends of the assets themselves, it applies momentum concepts to macroeconomic indicators (business cycles, monetary policy, trade, and risk sentiment) across four asset classes:
- stocks
- currencies
- long-term bonds, and
- short-term rates
By building 32 long-short and directional sub-portfolios, equally weighted and rebalanced annually, the strategy delivered ~13% CAGR versus the S&P’s 8.4%, with higher Sharpe (1.2), low correlation to traditional assets, and strong performance in bear markets and rising yield environments, making it a potential diversification strategy to consider.
Key Takeaways – Macro Momentum Strategy
- Macro momentum applies momentum logic to macroeconomic indicators instead of price charts (i.e., the standard strategy).
- It evaluates growth, inflation, trade, monetary policy, and risk sentiment across equities, bonds, currencies, and short rates.
- The strategy builds 32 long-short and directional “mini-portfolios,” then blends them into one balanced system. This comes from the 8 sub-portfolios constructed for each of the 4 asset classes, which we cover below.
- From 1970-2016, it produced roughly 13% annualized returns, outpacing the S&P 500’s 8.4%.
- Sharpe ratio of 1.2 shows better risk-adjusted returns than stocks or bonds, which traditionally have Sharpes in the 0.3-0.4 range.
- Low or negative correlation with traditional assets means genuine diversification.
- Outperformed in crises: gained when equities crashed or real yields spiked.
- Complements trend-following and style premia. Reduces drawdowns when combined.
- Offers systematic exposure that discretionary global macro funds often miss.
Introduction to Macro Momentum
Most investors are familiar with momentum in stocks. Namely, when prices rise, they often keep rising for a while, and when they fall, the trend can continue.
Many trading strategies are based on the momentum concept.
Macro momentum takes this concept into a bigger arena.
Instead of tracking individual stock prices, it looks at broad economic forces (things like growth, inflation, monetary policy, and global trade).
It then uses these shifts to guide trading or investment decisions across many asset classes.
From Forecasts to Opportunities
The strategy begins by recognizing that markets often react slowly to new information.
Algorithms are getting better, but they aren’t perfect and plenty of market activity is still driven by human-based order.
For instance, when economic forecasts point to stronger growth or looser monetary policy, it can take time for traders/investors to adjust their portfolios.
Macro momentum tries to take advantage of that lag.
Sometimes in markets you see systematic (algorithmic) strategies price things in right away, but they either undercapture or overcapture the move based on the discretionary flows that follow after.
From going long on assets tied to improving fundamentals and short on those linked to deteriorating ones, the approach attempts to stay ahead of the curve.
Beyond Equities
Unlike traditional stock-picking, macro momentum has a far wider playing field.
It covers equities, government bonds, currencies, and short-term interest rate products. This diversification means the strategy isn’t tied to the fortunes of one market.
For example, if economic growth supports equities but hurts bonds, the portfolio adjusts accordingly. The goal is to remain flexible and resilient across different environments.
Why It Matters
Global macro investing has long been associated with legendary trades like, e.g., Soros/Druckenmiller‘s shorting of the British pound in 1992, or betting on interest rate moves.
But those were often based on bold, discretionary calls.
In modern trading, position sizes tend to be a lot more granulated to reduce the individual impact of trades and focus more on the whole of the portfolio.
This is similar to how a sports manager might think of a team. No one player has all the skills to succeed, yet by taking advantage of their strengths and having other players to compensate for or offset their weakness, the whole has a chance to succeed.
Macro momentum tries to bring discipline to this world.
Applying systematic rules tries to remove guesswork and emotional bias and turns macro trading into something measurable and repeatable.
Building a Macro Momentum Portfolio
1) Choose the playing field
Start with four liquid asset groups so you can act on global shifts:
- major equity indexes
- developed-market government bonds
- liquid currency pairs (e.g., G-7 or G-10 currencies) and
- short-term interest rate futures or bills
Aim for broad coverage across the US, Europe, and Asia so no single country drives results.
2) Pick the macro “dials” you’ll read
Track four timely, intuitive forces:
- business cycle tone (growth and inflation)
- international trade competitiveness (currency moves vs. trading partners)
- monetary policy stance (front-end yield changes), and
- risk sentiment (recent equity performance).
These are simple to measure and available monthly or quarterly.
3) Convert data into clean signals
For each country or market, calculate one-year changes for each dial.
Rising growth or falling inflation strengthens the business cycle signal. Falling growth/rising inflation do the opposite.
A currency that has weakened against an export-weighted basket improves trade competitiveness.
Higher two-year yields signal tighter policy, and strong equity returns mark improving sentiment.
4) Map signals to expected asset behavior
Decide the sign of each relationship before looking at returns.
Stronger growth helps equities and currencies, but usually hurts bonds and short rates.
A looser policy stance supports equities and bonds, while it tends to pressure the currency.
Write these rules down so the process stays consistent.
5) Build two portfolios per dial and asset
For every combination of dial and asset class, make:
- Long-short (market-neutral) – Rank markets by the signal, go long the top group and short the bottom group. This isolates the macro effect.
- Directional – Go long where signals are positive and short where they are negative. This allows net long or short exposure when fundamentals align.
6) Size positions for stability
Target a similar risk level for every sleeve so no single idea dominates.
A common approach is scaling each sleeve to a fixed forecast volatility (may be done through futures or derivatives, and generally requires “financial engineering” experience), then capping position sizes for liquidity.
Equal risk, not equal dollars, keeps diversification real.
For example, in a standard 60/40 portfolio, stocks are more volatile than bonds, so stocks still dominate 85-90% of a portfolio’s value.
7) Combine the building blocks
First, average the eight sleeves within each asset class to form an equities, currencies, bonds, and short-rates composite.
Then average the eight sleeves within each dial to form four thematic composites.
Finally, you take an equal-weighted blend of all sleeves to create the aggregate macro momentum portfolio.
Here are the eight sleeves:
- Business Cycle – Long-Short – Ranks markets by growth and inflation signals. Go long those with stronger outlooks and short those with weaker ones.
- Business Cycle – Directional – Takes outright long positions where fundamentals look positive and short where they look negative, regardless of averages.
- International Trade – Long-Short – Compares how currencies and markets stack up on trade competitiveness. Buy the strong, sell the weak.
- International Trade – Directional – Hold longs in assets benefiting from favorable trade signals and shorts in those facing headwinds.
- Monetary Policy – Long-Short – Positions relative to policy shifts, such as easing or tightening. Take longs in supportive regimes and shorts in restrictive ones.
- Monetary Policy – Directional – Directly bet on policy trends. Buy assets where central banks are loosening and shorting where they’re tightening.
- Risk Sentiment – Long-Short – Focuses on cross-sectional differences in recent equity performance. Go long the markets showing strong momentum; go short the laggards.
- Risk Sentiment – Directional – Takes broad positions aligned with improving or deteriorating risk appetite, long when sentiment is up, short when it’s down.
You then take these 8 and then do them in each of the 4 asset classes.
This gives you 32 sub-portfolios, which are then equal-weighted.
8) Rebalance on a sensible schedule
Update signals and weights on a regular cadence, such as monthly for data and annual for major weights, so you capture new information without over-trading.
Rebalancing should be such so that the benefit to the portfolio exceeds the transaction costs.
9) Risk checks and reality
Monitor correlations, drawdowns, and turnover.
Expect the strategy to help most when fundamentals deteriorate or real yields rise, and to behave differently from pure trend followers.
Keep costs low, stick to liquid instruments, and let the rules work through cycles.
Performance Since 1970
In AQR’s paper, macro momentum has been tested across nearly five decades of market history. This period covers recessions, wars, inflation spikes, the tech boom, and the Global Financial Crisis.
Despite those challenges, the strategy produced strong and steady returns.
From 1970 to 2016, the aggregate portfolio delivered about 13% annualized excess returns with a Sharpe ratio of 1.2, far stronger than equities or bonds on their own.
Stability Across Decades
What stands out is how consistently the approach worked. Every decade showed positive returns and had healthy Sharpe ratios.
The 1980s were especially strong, with high double-digit gains, while the 2010s were weaker but still profitable. Importantly, results weren’t tied to a single asset class or signal; equities, currencies, bonds, and rates all contributed.
Diversification Benefits
Correlation with US equities was slightly negative, and near zero with bonds. Accordingly, the strategy did well when traditional portfolios struggled.
In the ten worst quarters for equities since 1970, macro momentum gained an average of nearly 14%. This showed its value as a hedge during downturns.
It also handled rising real yields effectively, as it had positive average returns in eight out of ten such periods.
Performance Table
| Period | Excess Return (Annualized) | Volatility | Sharpe Ratio | Correlation to US Equities | Correlation to US Bonds |
| 1970–2016 (Full) | 13.0% | 10.7% | 1.2 | -0.22 | 0.03 |
| 1970s | 10.2% | 11.4% | 0.9 | -0.45 | -0.22 |
| 1980s | 16.7% | 9.7% | 1.7 | -0.01 | -0.09 |
| 1990s | 14.1% | 10.1% | 1.4 | -0.46 | -0.20 |
| 2000s | 15.4% | 12.2% | 1.3 | -0.45 | 0.25 |
| 2010–2016 | 6.5% | 9.6% | 0.7 | 0.04 | 0.02 |
Relationship with Traditional Asset Classes
Diversification Beyond 60/40
Traditional portfolios often rely on a 60% equity and 40% bond mix.
While this blend has worked historically, it suffers in two environments:
- deep equity drawdowns (since equity beta dominates the portfolio, so the 40% bonds doesn’t help much) and
- rising real yields
Macro momentum shows its strength in precisely those situations.
Because it positions long assets with improving fundamentals and short those with weakening ones, it tends to thrive when traditional markets struggle.
Equity Market Drawdowns
During the ten worst quarters for US equities between 1970 and 2016, stocks lost nearly 20% on average.
Macro momentum, however, gained close to 14% in those same quarters.
Its “smile-shaped” relationship with equities means it captures modest gains when markets rise but shines when equities crash.
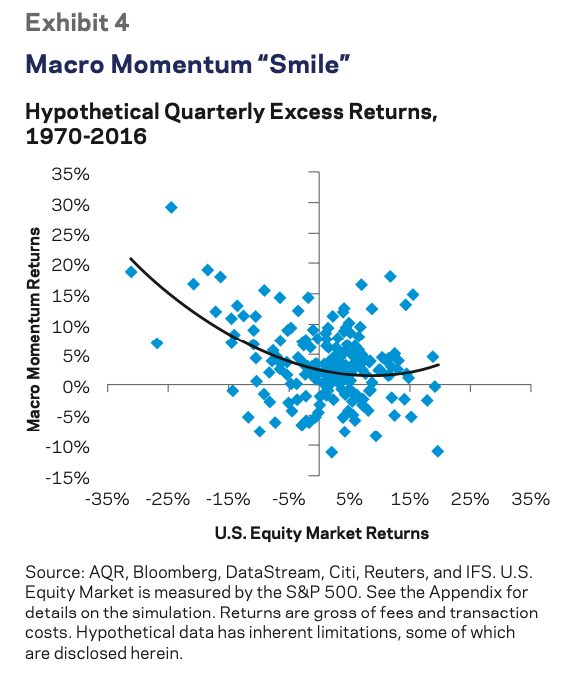
That negative beta in stress periods makes it a useful hedge.
Rising Real Yields
Rising real yields, which often hurt both bonds and balanced portfolios, have historically been another test.
They can even hurt stocks in some cases, if earnings don’t increase commensurately to offset the rise in yields (which give lower prices via the higher rate at which future cash flows are discounted).
Across ten major episodes where real yields spiked, Treasuries lost an average of 14% and even a 60/40 mix barely broke even.
Macro momentum outperformed in eight of those ten cases, averaging 12% annualized excess returns.
Why This Matters
These results suggest macro momentum isn’t just another return source, but can serve as a form of portfolio insurance when conventional assets or regular strategies falter.
Unlike equities or bonds, the idea is that it feeds on shifts in growth, trade, policy, and sentiment, and therefore better makes it resilient across cycles.
Performance in Stress Periods
| Environment | US Equities | US Bonds | 60/40 Portfolio | Macro Momentum |
| 10 Worst Equity Quarters | -19.9% | N/A | N/A | +13.7% |
| 10 Rising Real Yield Episodes | +11.3% | -14.2% | +1.1% | +12.0% |
Comparison with Trend-Following Strategies
Shared Foundations
Both macro momentum and trend-following start from the same insight – namely, markets digest information slowly.
This lag creates opportunities to profit by riding ongoing trends.
Trend-following does this by looking at price patterns; namely, buying assets that have been rising and shorting those that have been falling.
Macro momentum instead looks beneath the surface, basing its bets on shifts in economic fundamentals like growth, inflation, policy, and trade.
Key Differences
Price-based trend-following reacts to how markets move.
If equity prices have been climbing, the strategy will typically keep buying until the trend reverses.
Macro momentum doesn’t rely on past prices.
Instead, it asks whether the economic backdrop is improving or worsening for each asset.
That difference means macro momentum can sometimes anticipate turning points where trend-following lags.
When They Diverge
Turning points highlight the contrast.
During the late 1990s tech bubble, macro momentum was positioned for weakening fundamentals and lost money, while trend-following rode the upward price surge.
When the bubble burst, the tables turned: macro momentum profited from bearish fundamentals while trend-following was caught flat-footed.
Similarly, in fast crashes like 1987, trend-following suffered heavy losses, but macro momentum, guided by tight policy signals and slowing growth, made gains.
Working Together
Despite their differences, the two strategies complement each other.
Over 1970 to 2016 their correlation was only about 0.4 – i.e., it’s high enough to show they’re related, low enough to diversify one another.
A portfolio combining them improved Sharpe ratios and reduced drawdowns compared to either strategy alone.
Importantly, when one faced a major setback, the other often produced positive returns.
This complementarity makes macro momentum not a replacement for trend-following but a powerful partner, enhancing resilience across market environments.
Considerations
At the same time, if more people know about this, won’t the edge erode?
It’s fair to question.
And if information moves through markets slowly, won’t this become less true as algorithmic trading takes over more of the market?
Many approaches have worked less well once they became broadly known.
Comparison with Other Alternative Strategies
Macro Momentum vs. Style Premia
One natural comparison is with diversified style premia strategies, which use long-short portfolios built on value, momentum, and carry across major asset classes.
Both approaches are systematic and market-neutral on average, but they differ in focus.
Style premia rely on relative characteristics within assets (cheap vs. expensive, high vs. low carry), while macro momentum positions directly on shifts in economic conditions.
Risk and Return Profile
From 1970-2016, macro momentum delivered stronger results than a diversified style premia portfolio.
It produced a higher Sharpe ratio (about 1.2 vs. 1.0) and similar volatility. This showed that fundamentals-based signals can add an extra layer of predictive power.
Importantly, the correlation between the two strategies was just 0.2, meaning they behave quite differently.
And, of course, correlations are not static.
Blending them improved performance: a 50/50 mix raised the Sharpe ratio to roughly 1.4 and cut maximum drawdowns nearly in half.
How It Differs from Global Macro Managers
Another benchmark is the universe of discretionary global macro hedge funds.
These managers often make bold bets on currencies, rates, or equity indexes, sometimes guided by intuition (though that’s more old-school) or “big picture” views.
Analysis of large funds in the Dow Jones Credit Suisse Global Macro index suggests their returns load heavily on equities, bonds, and monetary policy shifts, but not much on trade, growth, or sentiment.
That concentration leaves gaps that a systematic macro momentum strategy can fill.
Complement, Not Substitute
Taken together, the evidence shows macro momentum isn’t a copy of existing alternatives, but offers distinct exposures, steadier long-run returns, and protection in stressed environments.
When combined with style premia or traditional macro managers, it diversifies sources of return and strengthens overall portfolio resilience.
Conclusion
Macro momentum brings discipline to global macro investing by applying a simple rule: go long assets with improving fundamentals and short those with weakening ones.
Tested over nearly five decades, the strategy has shown strong performance, averaging 13% annualized excess returns with a Sharpe ratio higher than either equities or bonds.
Its edge lies in diversification. Unlike a traditional 60/40 portfolio, which suffers in equity crashes or rising yield environments, macro momentum tends to thrive in those exact scenarios. As such, it can offer meaningful downside protection.
Compared to price-based trend-following, it reacts to shifts in economic conditions rather than market-/price-/chart-based movements, which allows it to anticipate turning points where trend followers often lag.
At the same time, the two strategies complement each other: when one underperforms, the other frequently steps in with gains.
Against other alternatives, like style premia or discretionary macro managers, macro momentum provides unique exposures, since most managers focus narrowly on monetary policy while ignoring equally profitable signals from growth, trade, and sentiment.
Taken together, the evidence suggests macro momentum is a potential core allocation. It diversifies traditional portfolios and pairs well with both systematic and discretionary alternatives.