Filtering Theory in Finance, Markets & Trading


Filtering theory is rooted in statistical and probabilistic methodologies and used in understanding and analyzing the dynamic, uncertain situations and environments in finance, markets, and trading.
At its core, filtering theory is concerned with the problem of estimating the state of a dynamical system from noisy observations (i.e., separating signal from noise).
It’s used in signal processing but has applications in finance, especially in areas requiring the extraction of the underlying state or signal from observed data that is contaminated with noise.
Key Takeaways – Filtering Theory in Finance, Markets & Trading
- Enhances Signal Detection
- Filtering theory helps in distinguishing meaningful information (signals) from market noise.
- Enables traders to make more informed decisions based on underlying asset trends and fundamentals.
- Improves Predictive Models
- By applying filters to historical data, traders can refine predictive models for asset prices and market movements (for more accurate forecasts and better trading strategies).
- Supports Risk Management
- Filtering theory helps in tracking and forecasting the evolution of risk factors over time.
- Allows for dynamic adjustments to risk management practices and portfolio allocations in response to detected changes in economic/market conditions.
Key Concepts in Filtering Theory
Bayesian Filtering
This involves updating the probabilities of hypotheses as more evidence or information becomes available.
In the context of finance, this could mean updating the estimation of a security’s true value as new market data comes in – with quarterly earnings reports being the most common.
Kalman Filter
Perhaps the most well-known filtering technique, the Kalman Filter is used for linear dynamical systems with Gaussian noise.
It provides a means to infer the state of a linear system from indirect and noisy measurements.
It’s widely used in the tracking of market prices and for optimizing portfolios.
Particle Filter
For non-linear and non-Gaussian processes, particle filters, which use a set of particles (samples) to represent the posterior distribution of some stochastic process, are more suitable.
This method can be used to estimate the hidden states in a stock market series, for example.
Hidden Markov Models (HMMs)
These models are used to predict future states of a market or to identify regimes in financial time series.
They assume that market conditions (states) are not directly observable (hidden) and must be inferred from observable variables such as stock prices.
Math Behind Filtering Theory
Here’s a basic overview of the math behind filtering theory:
Key Goal
Estimate an unobserved signal or state x(t) from a related observation process y(t).
Models
State equation:
- dx(t) = f(x(t),t)dt + dW(t)
Observation equation:
- dy(t) = h(x(t),t)dt + dV(t)
Where:
- f and h are system dynamics and observation functions
- dW(t) and dV(t) are noise processes
Key Techniques
As discussed a bit above:
- Kalman Filter – Uses linear Gaussian assumptions to optimally estimate mean and covariance of x(t)
- Particle Filter – Samples from posterior distribution p(x(t)|y(t)) to characterize full state distribution
- Bayesian Filtering – Uses Bayes’ rule to update probability of x(t) based on y(t)
The math involves stochastic calculus, dynamical systems, probability theory, and statistical estimation to recursively estimate x(t) from streaming y(t).
Filters can be highly useful techniques for real-time state estimation and signal processing under uncertainty.
Filtering Theory Applications in Finance
Asset Pricing and Valuation
Filtering theory helps in estimating the fundamental value of assets by filtering out the noise from market data.
This is useful in algorithmic trading where accurate, real-time estimations of an asset’s value are important.
Risk Management
By estimating the latent variables that drive market movements, filtering theory helps in better understanding and managing the risks associated with portfolios.
Market Microstructure Analysis
Traders can use filtering techniques to analyze the microstructure of markets, which involves understanding the impact of order flow and trade dynamics on price movements.
Economic Indicators Estimation
Filtering methods are used to estimate economic indicators from noisy data, which can help in macroeconomic forecasting and analysis.
How Traders Can Use Filtering Theory
Algorithmic Trading Strategies
Traders can incorporate filtering algorithms to refine their trading signals.
This removes noise from market data to identify true trends and opportunities for arbitrage.
Portfolio Optimization
Portfolio optimization in filtering theory involves using algorithms to continuously update and adjust asset allocations based on real-time data filtering.
The idea is to maximize returns or minimize risk based on the understanding of market dynamics and asset behaviors.
Regime Detection
Identifying market regimes (bullish momentum, bearish momentum, volatility, stable, etc.) using filtering methods can help traders adjust their strategies according to the market state.
Sentiment Analysis
Filtering theory can be applied to social media and news sentiment analysis to filter out irrelevant information and focus on signals that have a genuine impact on the market.
Adaptive Strategies
Filtering methods enable the development of strategies that adapt to changing economic/market conditions by continuously updating the estimates of the state of the market.
Coding Example – Filtering Theory in Finance
Implementing filtering theory in finance using Python can be demonstrated with a simplified Kalman filter example.
The Kalman filter is widely used for tracking and forecasting in time series data where there are unknowns in both measurements and the underlying model dynamics.
Kalman Filter Python Example
This example uses a basic Kalman filter to estimate a hidden state (e.g., the true price or value of an asset) from noisy observations (e.g., observed market prices).
import numpy as np
# Number of time steps
n_timesteps = 100
# True initial state
x_true = np.zeros(n_timesteps)
# Initial state estimate
x_est = np.zeros(n_timesteps)
# Observation vector
y_obs = np.zeros(n_timesteps)
# System parameters
f = 1.0 # State transition factor
h = 1.0 # Observation model factor
q = 0.1 # Process noise covariance
r = 0.1 # Observation noise covariance
p = 1.0 # Initial estimate error covariance
# Generate true state & observations
true_value = 20.0
for t in range(1, n_timesteps):
x_true[t] = f * x_true[t-1] + np.random.normal(0, np.sqrt(q)) # State equation
y_obs[t] = h * x_true[t] + np.random.normal(0, np.sqrt(r)) # Observation equation
# Kalman filter
for t in range(1, n_timesteps):
# Prediction step
x_pred = f * x_est[t-1]
p_pred = f * p * f + q
# Update step
K = p_pred * h / (h * p_pred * h + r) # Kalman gain
x_est[t] = x_pred + K * (y_obs[t] - h * x_pred)
p = (1 - K * h) * p_pred
# Plot results
import matplotlib.pyplot as plt
plt.figure(figsize=(10, 6))
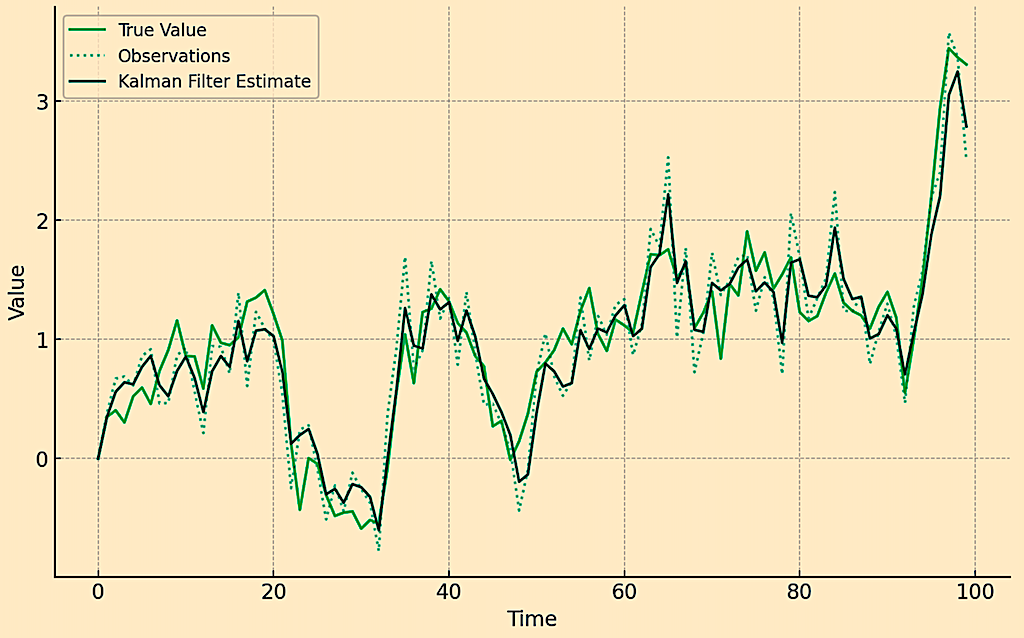
plt.plot(x_true, label='True Value')
plt.plot(y_obs, label='Observations', linestyle=':', alpha=0.5)
plt.plot(x_est, label='Kalman Filter Estimate')
plt.legend()
plt.xlabel('Time')
plt.ylabel('Value')
plt.title('Kalman Filter for State Estimation')
plt.show()
Explanation
- State and Observation Models – We assume a simple model where the true state (x_true) evolves over time with some process noise (q), and we make noisy observations (y_obs) of this state with observation noise (r).
- Kalman Filter Steps – For each time step, we predict the next state (x_pred) and then update this prediction based on the new observation to get our estimate (x_est).
- The Kalman gain (K) determines how much weight to give to the new observation versus the prediction.
- Plotting – The script plots the true value, the noisy observations, and the Kalman filter’s estimate of the true state over time.
Kalman Filter Estimate
Conclusion
Filtering theory offers an analytical framework for traders and financial analysts to extract meaningful information from noisy data, which can help with better decision-making in trading, portfolio management, and risk assessment.