Consolidation Stocks


Consolidation in stocks refers to a period where a stock’s price moves within a relatively stable range without a clear trend for an extended time.
This phase is characterized by a balance in supply and demand, indicating that investors are in agreement on the stock’s price, leading to sideways movement in the price chart.
Consolidations can occur after significant price movements as the stock “takes a breather” before possibly continuing the prior trend or reversing direction.
Key Takeaways – Consolidation Stocks
- Consolidation stocks exhibit stable price ranges with no clear trend. Reflects a balance between supply and demand.
- Characteristics – Low volatility, and often trade within a defined price band.
- Trading Strategies
- Range trading between support and resistance levels.
- Identifying and acting on breakout or breakdown signals with volume confirmation.
- Utilizing technical indicators to predict movement.
Tactical trading strategies for dealing with stocks in a consolidation phase primarily aim to identify breakout or breakdown points for entry or exit, or trading around support and resistance levels.
These strategies include:
Range Trading
Involves identifying the upper resistance and lower support levels that the stock has been trading within during the consolidation period.
Traders buy near the support level and sell near the resistance level, or short sell at resistance and cover at support.
This capitalizes on the stock’s price fluctuations within this range.
Breakout/Breakdown Trading
Traders wait for the stock price to break out of its consolidation range with increased volume, which could indicate the start of a new trend.
A breakout above the upper resistance level may be seen as a buy signal, while a breakdown below the support level may be viewed as a sell or short-sell signal.
It’s important to make sure the move is supported by volume, as false breakouts are common.
Using Technical Indicators
Indicators such as Bollinger Bands, Average True Range (ATR), and Moving Averages can help identify the strength of the consolidation and potential breakout points.
For instance, a contraction in the Bollinger Bands often precedes a significant price move.
Volume Analysis
Volume is a key factor in confirming breakouts or breakdowns.
An increase in volume during the move out of the consolidation range provides validation of the new trend’s strength.
Options Strategies
Traders might employ options strategies such as straddles or strangles during consolidation phases.
These strategies allow traders to profit from a stock’s volatility without having to predict a specific direction for the breakout.
Characteristics of Consolidation Stocks
Consolidation stocks often referred to as “low volatility” or “stable” stocks.
Here’s a breakdown of their common characteristics:
Typical Features
- Dividend-Paying – Many low-volatility stocks pay consistent dividends, providing investors with a steady income stream. This attracts investors seeking stability over rapid growth.
- Established Businesses – These companies tend to be mature, with reliable revenue streams and a proven track record.
- Defensive Sectors – They often operate in sectors considered essential or less prone to economic downturns, such as:
- Utilities (water, electricity, gas)
- Consumer Staples (food, beverages, household products)
- Healthcare
- Telecommunications
- Low Beta – Beta is a measure of a stock’s volatility relative to the broader market. Low volatility stocks typically have a beta below 1, meaning they move less dramatically than the overall market.
- Low Debt – Companies with minimal debt are less susceptible to fluctuations in interest rates or economic downturns, making them more stable.
Additional Factors
- Large Market Capitalization – Large-cap stocks are generally less volatile than small-cap stocks due to their size and established presence.
- Brand Recognition – Companies with strong brands and customer loyalty tend to have more predictable earnings and are less prone to disruption.
Examples of Consolidation Stocks
Think of “boring” but dependable companies:
- Coca-Cola (KO)
- Procter & Gamble (PG)
- Johnson & Johnson (JNJ)
- AT&T (T)
- Duke Energy (DUK)
We recommend looking at stock screeners or looking at stocks in low-volatility ETFs as potential targets.
Important Considerations
- Lower Potential Growth – The trade-off for stability is often lower potential for rapid price appreciation compared to higher-growth stocks.
- Interest Rate Sensitivity – Some low-volatility sectors, like utilities, can be sensitive to changes in interest rates. Rising rates can make their dividends less attractive relative to fixed-income options, causing a drop in their prices (less appealing to long-term holders but potentially appealing to tactical traders).
- Not Immune to Risk – While less volatile, these stocks can still experience declines during market downturns or face company-specific challenges.
How to Find Them
- Stock Screeners – Use screeners to filter for attributes like high dividend yield, low beta, and specific sectors (utilities, consumer staples). Many financial websites offer these tools.
- Low-Volatility ETFs – ETFs specifically target low-volatility stocks, providing an easy way to gain exposure to a basket of such companies.
FAQs – Consolidation Stocks
What exactly is a consolidation phase in stocks?
A consolidation phase in stocks is a period where the stock’s price moves within a confined range, showing little to no significant upward or downward trend.
It’s characterized by a balance between supply and demand, leading to sideways price action.
This phase typically occurs after a significant price movement as the market “digests” previous gains or losses and investors assess the stock’s value.
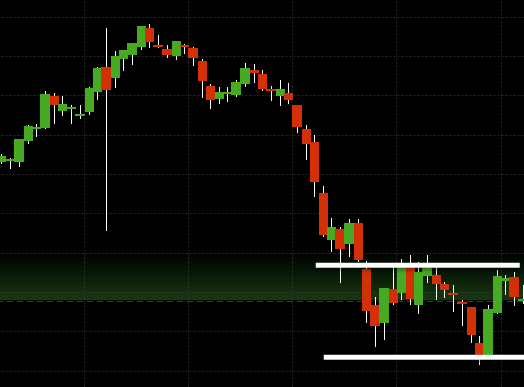
How can one identify a consolidation phase on a stock chart?
A consolidation phase can be identified on a stock chart by observing a period where the price fluctuates within a narrow and well-defined range, forming a sideways rectangle pattern.
This is accompanied by a decrease in trading volume, indicating a lack of strong sentiment toward buying or selling.
Why is volume important in confirming breakouts or breakdowns from a consolidation phase?
Volume is an important indicator for confirming breakouts or breakdowns because it reflects the strength and conviction behind a price move.
A breakout or breakdown with high volume suggests a strong consensus among traders about the stock’s new direction.
This makes it more likely that the price will continue to move outside of the consolidation range.
What are some common technical indicators used to analyze stocks in a consolidation phase?
Common technical indicators used to analyze stocks in consolidation include:
- Bollinger Bands, to gauge volatility and potential breakouts
- Average True Range (ATR), to understand the stock’s volatility level; and
- moving averages, to detect potential shifts in momentum within the consolidation phase
These tools help traders identify when the consolidation might end and a new trend begins.
Can you explain the difference between range trading and breakout/breakdown trading strategies in the context of consolidation stocks?
Range trading involves buying at or near the lower support level of the consolidation range and selling at or near the upper resistance level. It capitalizes on the stock’s price movement within the consolidation range.
Breakout/breakdown trading, on the other hand, focuses on identifying and acting upon a price move outside of the consolidation range with significant volume. It indicates the start of a new trend.
While range trading bets on the continuation of the consolidation, breakout/breakdown trading bets on the end of consolidation and the start of a new directional movement.
How do options strategies like straddles or strangles work in the context of consolidation phases?
Options strategies such as straddles or strangles are used during consolidation phases to profit from potential volatility without having to predict the direction of the breakout.
A straddle involves buying both a call and a put option at the same strike price and expiration, betting the stock will move significantly in either direction.
A strangle involves buying a call and put option with different strike prices but the same expiration, typically out-of-the-money, also betting on significant movement.
Both strategies profit if the stock breaks out of the consolidation phase with sufficient volatility, regardless of the direction.
Conclusion
When trading consolidation stocks, it’s essential to have strict risk management practices in place, including setting stop-loss orders to protect against losses from false breakouts or unexpected reversals.
Additionally, traders should remain informed on macroeconomic indicators and news events that could affect the stock’s price and cause it to exit the consolidation phase.