Small Cap Stocks Trading Strategies


Stocks are roughly divided into three camps when it comes to size.
Large-cap stocks are heavily researched, highly liquid, and dominated by institutional and systematic capital. Because they’re so heavily picked over and covered, persistent alpha can be difficult to extract. (It’s not easy to have a unique insight on the world’s most covered stocks.)
Mid caps ($2 billion to $10 billion in market capitalization) strike a balance between liquidity and inefficiency. There are coverage gaps and liquidity is lower, but for traders looking to really take advantage of any inefficiencies related to size, they still might leave something to be desired.
Small caps go a step further. They sit at the edge of institutional feasibility. Sell-side coverage is sparse because these companies – generally considered to be in the sub-$2 billion market cap range – aren’t generally big enough to generate revenue for the bank to merit analyst coverage.
They’re less liquid, tend to be more domestically focused, and have less favorable financing (e.g., higher rates, more floating-rate debt) than large caps (which makes them more rate-sensitive, on average).
That makes small caps one of the most plausible areas to generate alpha in the equity universe, but also one of its most risk-intensive.
Here, we’re going to go into the core trading strategies that work best in small caps, why they work, and the risks that come with them.
(For our article on mid cap trading strategies, we have that here.)
Key Takeaways – Small Cap Stocks Trading Strategies
- Small caps offer greater informational and behavioral inefficiencies than mid or large caps. This creates more alpha potential but higher risk.
- Discretionary traders will generally find more pockets of opportunity, given systematic traders don’t have as much liquidity to go off of – and don’t compete as much in this space, in general.
- Liquidity and inefficient informational flow is the primary constraint and driver of returns in small-cap trading.
- Strategies we cover here tend to work best over short to medium horizons rather than long-term buy-and-hold (in risk-adjusted terms, not necessarily raw returns).
- Small-cap trading performs best during risk-on, early-cycle environments with easy financial conditions.
- Undergoing a recovery (early cycle)
- Financial conditions are loose
- Equity volatility is low to moderate
- Risk appetite is rising
- Liquidity is abundant
- They struggle during tightening cycles, recessions, and risk-off phases.
- Drawdowns are deeper and recoveries more uneven than in larger cap stocks.
- Traders benefit most when small-cap exposure is diversified, joined with other factors (value), and paired with more stable large-cap exposure (and other asset classes ideally) to smooth drawdowns and improve compounding.
Why Small Caps Are Distinct
Small caps are typically defined as companies with market capitalizations below roughly $2 billion.
They differ structurally from larger stocks in several ways:
- Limited analyst coverage and institutional ownership
- Lower average liquidity and wider bid-ask spreads
- Higher sensitivity to incremental capital flows
- Greater exposure to idiosyncratic business risk
This creates more dispersion across fundamentals, technicals, and outcomes. The opportunity set is wider, but the error margin is thinner.
Size Factor & Influence
In financial markets, isolated exposures or characteristics are commonly called factors.
For example, value, growth, momentum, size, quality, volatility, and other isolated characteristics.
The size factor is the empirical tendency for smaller companies to earn higher long-run returns than larger companies.
It matters because it represents a distinct source of equity return that’s not fully explained by broad market beta.
Historically, small caps have tended to outperform large caps because they’re structurally riskier and harder to arbitrage, so traders/investors expect compensation for bearing that risk.
Risk
On the risk side, smaller firms usually have more volatile earnings, weaker balance sheets, more limited access to credit, and higher sensitivity to recessions and liquidity shocks.
Investors demand a higher expected return as compensation for bearing these risks.
Behavioral and Market Structure
On the behavioral and market-structure side, small firms receive less analyst coverage and investor attention, and their stocks are often less liquid.
Wider bid-ask spreads, higher market impact, and periodic “air pockets” in liquidity mean that even if mispricings are identified, scaling capital into them is difficult.
This helps the size effect persist.
Weakening Size Factor Premium?
Over time, however, the size premium has weakened and become more conditional.
Since the early 2000s, small caps have not reliably outperformed, and in some stretches large caps have led due to better scale, diversification, and control over key technologies, platforms, and resources.
We’ll also show below that small caps have actually underperformed large caps by around 2% per year since the financial crisis.
There’s also improved market efficiency. Lower trading costs, better information dispersal, and broader institutional access have reduced the easiest inefficiencies.
Another issue is “junk small caps,” where low-quality, unprofitable, highly levered firms dilute the premium.
Identifying these is nonetheless difficult because many of them have value because they’re turnaround stories.
Many eventually fail or have their assets swallowed up by other companies acquiring or merging with them, but some eventually become
Research and practitioner frameworks increasingly show size works best when paired with quality, profitability, and value filters. These tend to shine through over the long-run.
Some ETFs have tried to appeal to both size and value frameworks – e.g., VBR.
Size also tends to perform strongest in early-cycle recoveries when liquidity and risk appetite rebound.
Related: Factor Statistics
Core Small Cap Trading Strategies
We’ll review each strategy by explaining why it works, typical expressions, and key risks.
1. Momentum and Short-Term Trend Strategies
Why it works
In small caps, price is often driven more by flows than by valuation anchoring.
Once a stock starts moving, limited float and thin liquidity can reinforce trends.
Typical expressions
- Short- to intermediate-term momentum (3-12 month lookbacks)
- High-volume breakouts from consolidation
- Relative strength vs. small-cap indices
Key risk
Momentum reversals can be violent. Liquidity is less readily available in small caps, so the movements can be larger.
2. Earnings Surprises and Information Gaps
Why it works
Small-cap earnings information diffuses more slowly.
If you’re used to large caps you generally know that information gets discounted fairly quickly. There’s enough liquidity for this to occur.
Small caps, on the other hand, don’t have as much liquidity, as much analyst coverage, or the ability for institutional traders to move in and out in sufficient size.
Many participants learn about results well after the initial release.
Typical expressions
- Long strong earnings beats with improving guidance
- Short severe misses with balance-sheet stress
Hold periods are generally measured in days to a few weeks
Key risk
Gaps are common and often untradeable given there’s no liquidity.
Stops may not protect against overnight repricing.
3. Liquidity-Driven Volatility Breakouts
Why it works
Small caps frequently move from inactivity to extreme volatility as new buyers enter thin markets or holders sell.
Typical expressions
- Average True Range (ATR) compression followed by volume spikes
- Range breakouts with multiple-day follow-through
- Opening range breakouts after prolonged illiquidity, where small caps break above narrow pre-market or early-session ranges with strong volume.
- Often marks the start of a volatility expansion phase.
- Social or retail-driven attention surges
- Float rotation breakouts, where a large percentage of the public float trades hands in a short period.
- This suggests repositioning and the potential for sustained momentum.
Key risk
False breakouts are frequent. Volume confirmation is essential.
4. Event-Driven and Corporate Action Trades
Why it works
Corporate events matter more in small caps because businesses are less diversified.
Typical expressions
- Management changes
- Capital raises
- Debt restructurings
- Asset sales, spin-offs, or strategic reviews
Key risk
Events can worsen fundamentals instead of improving them. Outcomes are binary.
5. Mean Reversion After Forced Selling
Why it works
Small caps can experience forced selling due to fund redemptions or index removals.
Typical expressions
- Buying extreme drawdowns without fundamental impairment
- Short-term rebound trades
- Oversold technical conditions
Key risk
Distinguishing temporary dislocations from genuine business deterioration is difficult. For example, tariffs can be genuinely bad for small caps given their domestic focus. But how much of it is serious versus being dragged down due to tied liquidity?
6. Insider Buying and Ownership Signals
Why it works
In small caps, insiders often represent a meaningful share of ownership and information advantage.
Institutions tend to be less than they are in large caps.
Institutional ownership by capitalization range:
- Large cap = 65-70%
- Mid cap = 55-65%
- Small cap = 30-50%
Typical expressions
- Look for insider purchases after selloffs for valuation-based signals
- Look at what specialized small-cap funds own (e.g., via 13F). Don’t treat 13F’s as gospel, as they’re submitted with a 45-day lag and you don’t necessarily know positions built around them or the context of a trade (e.g., pair trade, capital structure arbitrage, etc.) that can make it something less than a pure long.
Key risk
Insiders may be early or overly optimistic.
7. Buyout/M&A Candidates
Why it works
Most large caps aren’t prime candidates for M&A because they’re simply too large to buy.
For private equity and strategic buyers, they’d create too much concentration risk to pay a premium to take over a company.
Usually these larger companies are the ones using their financial power to buy other companies.
Small caps, on the other hand, can be more realistically bought, which often comes with the benefit of getting paid a 20-30%+ premium for the company over the unaffected list price.
Companies that have the following characteristics are generally good candidates for M&A:
- Stable and recurring revenue
- Predictable revenue model with limited customer concentration risk
- Strong free cash flow conversion
- Defensible niche or leadership position within a fragmented industry
- Clean or underlevered balance sheet that can support additional leverage
- Operational inefficiencies that a strategic buyer or private equity/financial buyer could realistically improve
- Scalable platform potential through add-on acquisitions or geographic expansion
- Valuation below strategic or private market comparables
This isn’t something to expect, as nobody can predict exactly if a company will be bought out, but it’s something that becomes a greater likelihood.
Typical expressions
- Owning companies with the above-listed characteristics
Key risk
Traders shouldn’t go into a company with the thesis that it’s a good buyout candidate.
Risk Management Specific to Small Caps
Risk management matters more than signal quality in small-cap trading.
Liquidity Risk
Small caps trade with limited depth.
Slippage can make up more of returns than one would like.
Position Sizing
Positions are typically much smaller than mid or large caps, especially for institutions.
Gap Risk
Overnight repricing is fairly common. Stop losses are imperfect as protection.
Leverage
Leverage is generally avoided.
Small caps already embed leverage through operating risk and their balance sheet (companies have debt).
Portfolio Construction Angle
Small-cap strategies work best when:
- Generally used as a “satellite” sleeve, not a core allocation. Retail is generally not a major holder of small caps (generally large caps).
- Diversified across many names and setups.
Most professionals cap small-cap exposure well below mid-cap allocations.
Large Caps, Small Caps, or Both?
Like we did in our mid caps piece, let’s use 3 portfolios:
Portfolio 1
- 100% Large Caps
Portfolio 2
- 100% Small Caps
Portfolio 3
- 50% Large Caps
- 50% Small Caps
The outcome:
Performance Summary
| Metric | Portfolio 1 | Portfolio 2 | Portfolio 3 |
|---|---|---|---|
| Start Balance | $10,000 | $10,000 | $10,000 |
| End Balance | $2,649,598 | $3,437,793 | $3,218,814 |
| Annualized Return (CAGR) | 10.89% | 11.42% | 11.29% |
| Standard Deviation | 15.27% | 19.57% | 16.79% |
| Best Year | 37.45% | 55.13% | 46.04% |
| Worst Year | -37.02% | -36.07% | -36.55% |
| Maximum Drawdown | -50.97% | -53.95% | -52.11% |
| Sharpe Ratio | 0.46 | 0.43 | 0.46 |
| Sortino Ratio | 0.68 | 0.62 | 0.67 |
The 100% large-cap portfolio gives the lowest long-term return but the most stable profile.
Its annualized return of 10.89% comes with the lowest volatility and the best downside-adjusted metrics. The Sharpe ratio of 0.46 and Sortino ratio of 0.68 mean smoother compounding, even though the maximum drawdown still reached roughly 51%. This portfolio prioritizes relative stability more over upside.
The 100% small-cap portfolio produces the highest absolute return, ending with the largest final balance and a higher CAGR of 11.42%.
But this comes at a cost. Volatility rises by around 25% (mid caps, by comparison, are around 20% more volatile than large caps), standard deviation jumps to nearly 20%, and the Sharpe and Sortino ratios fall to 0.43 and 0.62.
Small caps can provide nice upside in strong years, evidenced by a 55% best year, but they also suffer deeper and more frequent drawdowns, which reduces their risk-adjusted efficiency.
The 50/50 blended portfolio strikes the most balanced outcome. It gives most of the return benefit of small caps, with an 11.29% CAGR, while reducing volatility relative to an all small-cap allocation. Its Sharpe ratio matches large caps at 0.46, and its Sortino ratio remains close to large caps as well. Maximum drawdown is lower than small caps, though still deeper than pure large caps.
There’s not a clear additive benefit to the 50/50 mix, though, from a reward-risk perspective.
Generally, there’s some small diversification benefit where the higher reward helps net out the higher volatility in better risk-adjusted terms.
Overall, the data suggest that while small caps improve raw returns, they do so inefficiently on a standalone basis.
Combining large and small caps can deliver a better balance between growth and risk control, and improve compounding consistency without fully sacrificing upside.
So, in terms of highest return while keeping the same risk-adjusted metrics, the 50/50 portfolio slightly wins, but not by much.
Let’s look at some deeper statistics:
Risk and Return Metrics
| Metric | Large Caps | Small Caps | 50/50 Large/Small |
|---|---|---|---|
| Arithmetic Mean (monthly) | 0.96% | 1.07% | 1.01% |
| Arithmetic Mean (annualized) | 12.18% | 13.59% | 12.87% |
| Geometric Mean (monthly) | 0.86% | 0.91% | 0.90% |
| Geometric Mean (annualized) | 10.89% | 11.42% | 11.29% |
| Standard Deviation (monthly) | 4.41% | 5.65% | 4.85% |
| Standard Deviation (annualized) | 15.27% | 19.57% | 16.79% |
| Downside Deviation (monthly) | 2.81% | 3.71% | 3.16% |
| Maximum Drawdown | -50.97% | -53.95% | -52.11% |
| Benchmark Correlation | 0.99 | 0.91 | 0.98 |
| Beta(*) | 0.97 | 1.14 | 1.06 |
| Alpha (annualized) | 0.33% | -0.43% | -0.05% |
| R2 | 98.08% | 83.27% | 96.34% |
| Sharpe Ratio | 0.46 | 0.43 | 0.46 |
| Sortino Ratio | 0.68 | 0.62 | 0.67 |
| Treynor Ratio (%) | 7.32 | 7.30 | 7.30 |
| Calmar Ratio | 2.76 | 0.83 | 1.54 |
| Modigliani–Modigliani Measure | 11.71% | 11.13% | 11.63% |
| Active Return | 0.03% | 0.56% | 0.43% |
| Tracking Error | 2.17% | 8.32% | 3.33% |
| Information Ratio | 0.01 | 0.07 | 0.13 |
| Skewness | -0.43 | -0.53 | -0.59 |
| Excess Kurtosis | 1.86 | 2.57 | 2.34 |
| Historical Value-at-Risk (5%) | 6.70% | 7.96% | 6.85% |
| Analytical Value-at-Risk (5%) | 6.29% | 8.23% | 6.96% |
| Conditional Value-at-Risk (5%) | 9.55% | 12.25% | 10.75% |
| Upside Capture Ratio (%) | 96.84 | 115.36 | 106.31 |
| Downside Capture Ratio (%) | 95.66 | 116.85 | 106.08 |
| Safe Withdrawal Rate | 4.15% | 5.34% | 4.90% |
| Perpetual Withdrawal Rate | 6.30% | 6.75% | 6.64% |
| Positive Periods | 408 out of 648 (62.96%) | 397 out of 648 (61.27%) | 405 out of 648 (62.50%) |
| Gain/Loss Ratio | 1.02 | 1.04 | 1.03 |
| * US Stock Market is used as the benchmark for calculations. Value-at-risk metrics are monthly values. | |||
From a trader’s perspective, the most important takeaway is that small caps amplify both opportunity and error, while blends improve efficiency.
Some important individual lessons:
Volatility Is Dominant with These Portfolios
First, volatility dominates outcomes. Portfolio 2’s (small caps) annualized vol near 20% pushes downside deviation, Value at Risk, and Conditional Value at Risk materially higher.
So, trade timing, position sizing, and exit discipline matter more. A good idea held too large in small caps can overwhelm a portfolio, even if the long-term return is attractive.
Small Caps = Lower Correlation, Higher Beta
Second, beta and correlation behavior differ. Small caps run with a beta well above one and a lower R² (i.e., more idiosyncratic movement).
That creates more alpha opportunity. But also less predictability during market stress. Traders relying on index hedges or broad market signals should expect weaker protection when operating purely in small caps.
Balance Beats Concentration for Risk-Adjusted Performance
Third, risk-adjusted efficiency favors balance. Despite higher upside capture, small caps deliver inferior Sharpe, Sortino, and Calmar ratios.
This tells traders that small caps reward aggression as is, but improving in terms of risk-adjustment will take more work.
The blended portfolio achieves comparable Sharpe to large caps while maintaining better upside participation. This makes it structurally easier to trade across regimes.
Tail Risk Considerations
Fourth, tail risk is nontrivial. Small caps have worse skewness, higher kurtosis, and materially larger CVaR.
For traders, this means gap risk and liquidity shocks are recurring.
Stop-losses might give you exposure controls. But they won’t be guaranteed exits, especially with overnight or after hours gaps.
Expect Exaggerated Moves Relative to the Market in Small Caps
Fifth, flow sensitivity is exploitable but dangerous.
Small caps show higher upside and downside capture ratios. You see exaggerated responses to market moves.
You can see this by looking at 3-year and 5-year rolling returns. (These help to see more than the year to year trends, which tend to be noisy.)
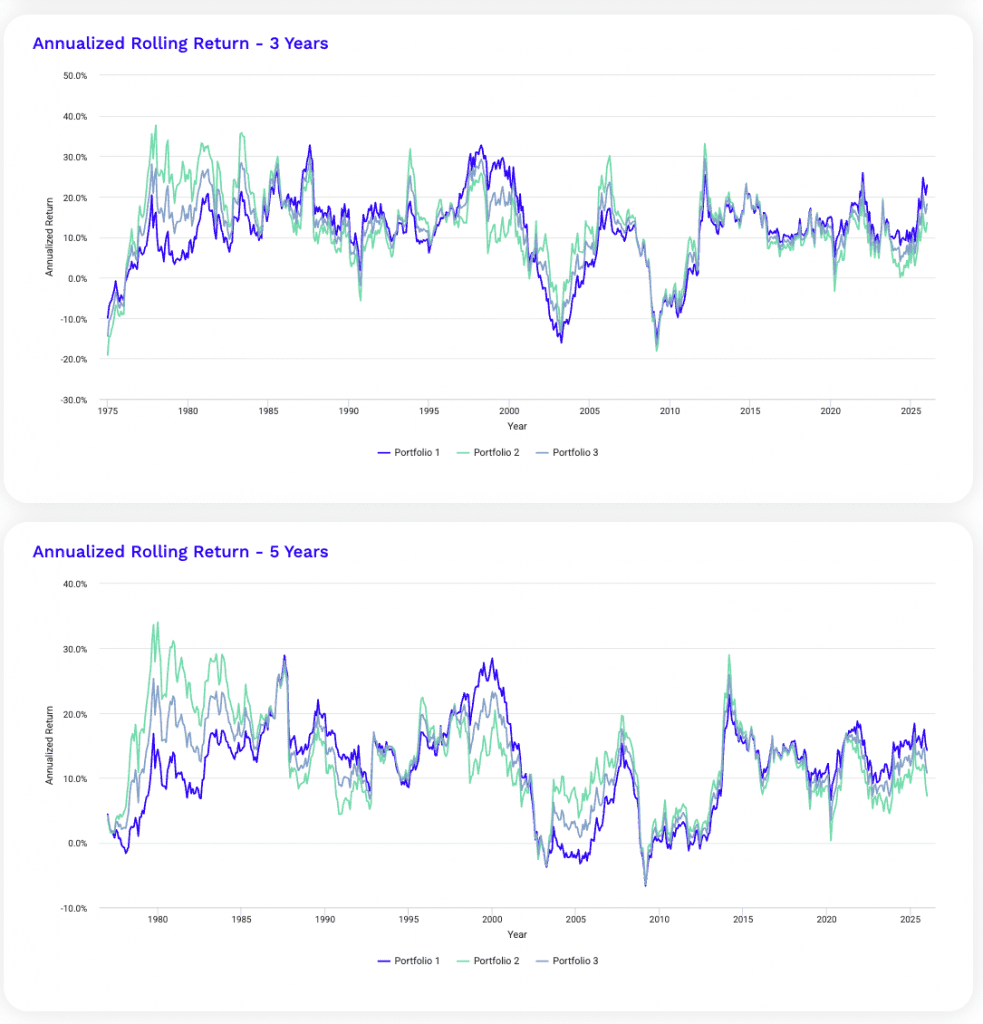
You can see the green line (small caps) as above and below the blue line (large gaps) and gray line (blended). This shows the bigger up and down moves.
This favors momentum, breakout, and event-driven strategies. Static positioning generally sees worse risk-adjusted concerns.
Correlations
When looking at correlations we see that US large cap and small cap are +0.86 correlated.
Monthly Correlations
| Name | US Large Cap | US Small Cap | Portfolio 1 | Portfolio 2 | Portfolio 3 |
|---|---|---|---|---|---|
| US Large Cap | 1.00 | 0.86 | 1.00 | 0.86 | 0.95 |
| US Small Cap | 0.86 | 1.00 | 0.86 | 1.00 | 0.97 |
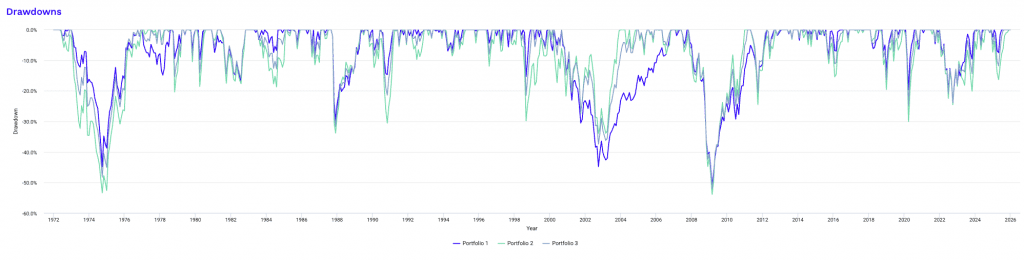
Drawdowns
Small caps generally have deeper drawdowns, but not always.
The dot-com crash was one example where the largest companies fell by more than the smallest companies because that’s where the concentrated risks were.
Historical Market Stress Periods
| Stress Period | Start | End | Portfolio 1 | Portfolio 2 | Portfolio 3 |
|---|---|---|---|---|---|
| Oil Crisis | Oct 1973 | Mar 1974 | -13.05% | -18.56% | -14.56% |
| Black Monday Period | Sep 1987 | Nov 1987 | -29.78% | -33.84% | -31.74% |
| Asian Crisis | Jul 1997 | Jan 1998 | -5.61% | -4.93% | -3.89% |
| Russian Debt Default | Jul 1998 | Oct 1998 | -15.38% | -25.73% | -20.25% |
| Dotcom Crash | Mar 2000 | Oct 2002 | -44.82% | -33.95% | -37.48% |
| Subprime Crisis | Nov 2007 | Mar 2009 | -50.97% | -53.25% | -52.11% |
| COVID-19 Start | Jan 2020 | Mar 2020 | -19.63% | -30.10% | -24.87% |
Drawdowns for Portfolio 1 (Large Caps)
| Rank | Start | End | Length | Recovery By | Recovery Time | Underwater Period | Drawdown |
|---|---|---|---|---|---|---|---|
| 1 | Nov 2007 | Feb 2009 | 1 year 4 months | Aug 2012 | 3 years 6 months | 4 years 10 months | -50.97% |
| 2 | Jan 1973 | Sep 1974 | 1 year 9 months | Sep 1976 | 2 years | 3 years 9 months | -44.87% |
| 3 | Sep 2000 | Sep 2002 | 2 years 1 month | Nov 2006 | 4 years 2 months | 6 years 3 months | -44.82% |
| 4 | Sep 1987 | Nov 1987 | 3 months | May 1989 | 1 year 6 months | 1 year 9 months | -29.78% |
| 5 | Jan 2022 | Sep 2022 | 9 months | Dec 2023 | 1 year 3 months | 2 years | -23.95% |
| 6 | Jan 2020 | Mar 2020 | 3 months | Jul 2020 | 4 months | 7 months | -19.63% |
| 7 | Dec 1980 | Jul 1982 | 1 year 8 months | Oct 1982 | 3 months | 1 year 11 months | -17.00% |
| 8 | Jul 1998 | Aug 1998 | 2 months | Nov 1998 | 3 months | 5 months | -15.38% |
| 9 | Jan 1977 | Feb 1978 | 1 year 2 months | Aug 1978 | 6 months | 1 year 8 months | -14.86% |
| 10 | Jun 1990 | Oct 1990 | 5 months | Feb 1991 | 4 months | 9 months | -14.70% |
| Worst 10 drawdowns included above | |||||||
Drawdowns for Portfolio 2 (Small Caps)
| Rank | Start | End | Length | Recovery By | Recovery Time | Underwater Period | Drawdown |
|---|---|---|---|---|---|---|---|
| 1 | Jun 2007 | Feb 2009 | 1 year 9 months | Dec 2010 | 1 year 10 months | 3 years 7 months | -53.95% |
| 2 | May 1972 | Sep 1974 | 2 years 5 months | Dec 1976 | 2 years 3 months | 4 years 8 months | -53.43% |
| 3 | Mar 2000 | Sep 2002 | 2 years 7 months | Dec 2003 | 1 year 3 months | 3 years 10 months | -33.95% |
| 4 | Sep 1987 | Nov 1987 | 3 months | Apr 1989 | 1 year 5 months | 1 year 8 months | -33.84% |
| 5 | Oct 1989 | Oct 1990 | 1 year 1 month | Mar 1991 | 5 months | 1 year 6 months | -30.61% |
| 6 | Jan 2020 | Mar 2020 | 3 months | Nov 2020 | 8 months | 11 months | -30.10% |
| 7 | May 1998 | Aug 1998 | 4 months | Dec 1999 | 1 year 4 months | 1 year 8 months | -29.82% |
| 8 | May 2011 | Sep 2011 | 5 months | Dec 2012 | 1 year 3 months | 1 year 8 months | -24.56% |
| 9 | Nov 2021 | Sep 2022 | 11 months | Mar 2024 | 1 year 6 months | 2 years 5 months | -24.54% |
| 10 | Sep 1978 | Oct 1978 | 2 months | Apr 1979 | 6 months | 8 months | -20.35% |
| Worst 10 drawdowns included above | |||||||
Drawdowns for Portfolio 3 (50/50 Large/Small Cap Blend)
| Rank | Start | End | Length | Recovery By | Recovery Time | Underwater Period | Drawdown |
|---|---|---|---|---|---|---|---|
| 1 | Nov 2007 | Feb 2009 | 1 year 4 months | Feb 2011 | 2 years | 3 years 4 months | -52.11% |
| 2 | Jan 1973 | Sep 1974 | 1 year 9 months | Sep 1976 | 2 years | 3 years 9 months | -48.30% |
| 3 | Sep 2000 | Sep 2002 | 2 years 1 month | Nov 2004 | 2 years 2 months | 4 years 3 months | -37.48% |
| 4 | Sep 1987 | Nov 1987 | 3 months | May 1989 | 1 year 6 months | 1 year 9 months | -31.74% |
| 5 | Jan 2020 | Mar 2020 | 3 months | Aug 2020 | 5 months | 8 months | -24.87% |
| 6 | Jan 2022 | Sep 2022 | 9 months | Dec 2023 | 1 year 3 months | 2 years | -23.86% |
| 7 | May 1998 | Aug 1998 | 4 months | Dec 1998 | 4 months | 8 months | -21.49% |
| 8 | Jun 1990 | Oct 1990 | 5 months | Feb 1991 | 4 months | 9 months | -21.45% |
| 9 | May 2011 | Sep 2011 | 5 months | Mar 2012 | 6 months | 11 months | -20.49% |
| 10 | Sep 2018 | Dec 2018 | 4 months | Jul 2019 | 7 months | 11 months | -16.39% |
| Worst 10 drawdowns included above | |||||||
Overall Interpretation
Small caps offer some of the highest alpha potential in public equities.
But they also come with the highest execution and risk-management demands.
They reward traders who are disciplined, selective, and liquidity-aware.
For those who can manage drawdowns and volatility, small caps can be a part of your strategy.
FAQs – Small Cap Stocks Trading Strategies
What defines a small-cap stock, and how does it differ from mid-cap and large-cap stocks?
A small cap stock is generally defined as having a market cap of under $2 billion.
A mid cap stock is generally between $2 billion to $10 billion in market cap.
A large cap stock is $10 billion in market cap or above.
Why do small-cap stocks have more pricing inefficiencies than larger-cap stocks?
Small-cap stocks have more pricing inefficiencies due to a mix of factors:
- limited analyst coverage
- lower institutional participation
- thinner liquidity, and
- slower information diffusion
As a result, mispricings will tend to last longer than in heavily traded large-cap markets.
How does liquidity risk shape small-cap trading strategies?
Liquidity risk generally means:
- constricting position sizes
- sometimes longer trade horizons (so transaction costs aren’t as much of an influence)
- strict exit discipline (be careful with market orders that don’t fill at the price you want)
- more reliance on volume confirmation in small-cap trading
Why are small caps more sensitive to incremental order flow and volume surges?
Small caps have thinner liquidity and smaller floats. So modest buying or selling moves prices sharply.
What types of traders are best suited to small-cap markets?
Small-cap markets are generally suitable for disciplined discretionary traders, swing traders, and event-driven traders who can manage liquidity risk and volatility.
They’re less suitable for high-frequency traders and day traders.
They’re nonetheless attractive to those drawn to trading strategies involving momentum, sentiment shifts, and information gaps.
Why is information diffusion slower in small-cap stocks?
Information diffuses slower in small caps due to limited analyst coverage, fewer institutional participants, and lower overall attention paid to these markets.
What is the historical risk premium of small-cap stocks relative to large caps?
In what we covered above, we found about a 50-bp (0.50% annualized) risk premium of small caps over large caps, from 1972 forward.
Since 2000, it’s been about the same (60bps):
Performance Summary
| Metric | Portfolio 1 | Portfolio 2 | Portfolio 3 |
|---|---|---|---|
| Start Balance | $10,000 | $10,000 | $10,000 |
| End Balance | $73,035 | $85,013 | $79,961 |
| Annualized Return (CAGR) | 7.95% | 8.58% | 8.32% |
| Standard Deviation | 15.16% | 19.64% | 16.80% |
| Best Year | 32.18% | 45.63% | 37.07% |
| Worst Year | -37.02% | -36.07% | -36.55% |
| Maximum Drawdown | -50.97% | -53.95% | -52.11% |
| Sharpe Ratio | 0.46 | 0.42 | 0.45 |
| Sortino Ratio | 0.66 | 0.62 | 0.65 |
If we go after the 2008 financial crisis, large caps have outperformed small caps by around 2%, and even better in risk-adjusted terms:
Performance Summary
| Metric | Portfolio 1 | Portfolio 2 | Portfolio 3 |
|---|---|---|---|
| Start Balance | $10,000 | $10,000 | $10,000 |
| End Balance | $102,455 | $75,548 | $88,667 |
| Annualized Return (CAGR) | 14.67% | 12.63% | 13.70% |
| Standard Deviation | 14.88% | 19.24% | 16.67% |
| Best Year | 32.18% | 37.62% | 34.90% |
| Worst Year | -18.23% | -17.72% | -17.98% |
| Maximum Drawdown | -23.95% | -30.10% | -24.87% |
| Sharpe Ratio | 0.91 | 0.65 | 0.78 |
| Sortino Ratio | 1.46 | 1.01 | 1.23 |
How do small-cap stocks typically perform across different economic cycles?
Small-cap stocks tend to outperform during early economic recoveries when there’s a lot of incentive to get more liquidity into the system. Risk appetite rises and credit conditions ease.
They often lag during late-cycle slowdowns and recessions.
In these cases, financing becomes restrictive and you see traders/investors favor larger, more diversified companies with more international/geographic exposre.
During deep risk-off phases, small caps typically have larger drawdowns.
But they can rebound sharply once conditions are better.
Why do small caps tend to experience sharper momentum moves than mid and large caps?
Small caps tend to have stronger momentum because of their limited liquidity and smaller floats.
Concentrated ownership also amplifies the impact of new buyers or sellers once trends start trending.
How should traders think about position sizing in small-cap trades versus larger caps?
You have higher volatility, wider spreads, and gap risk in small caps.
As such, risk is defined by liquidity and exit capacity rather than notional exposure.
Why is gap risk more common in small-cap stocks?
Thin liquidity means prices don’t adjust as smoothly to new information.
Why do small caps experience more extreme drawdowns (usually)?
Small caps have more extreme drawdowns as they’re more sensitive to liquidity shocks, credit tightening (smaller firms tend to have higher interest rates and more floating rate debt), and shifts in risk appetite.
There’s thinner trading depth. Business risk is higher.
Wider bid-ask spreads and reduced buyer participation are also factors.
In terms of the price action, you accordingly see steeper drawdowns and recoveries that are more uneven than in larger-cap stocks.
How do insider buying signals differ in small caps compared to mid caps?
Insider buying in small caps is often more informative because insiders are a larger ownership share.
As such, trades may meaningfully show conviction – as opposed to routine compensation activity.
But it’s nuanced, so it depends on the situation.
What types of corporate events most strongly impact small-cap stock prices?
Corporate events like:
- earnings surprises
- capital raises
- debt restructurings
- regulatory decisions
- management changes, and
- strategic reviews…
…tend to impact small-cap stocks most.
This is because they directly affect survival and growth prospects.
Are options strategies practical or efficient in small-cap stocks?
Options strategies are generally less practical in small-cap stocks. It’s a big drawback for many traders interested in the small-cap space.
This is due to wide bid-ask spreads, low open interest, and limited strike availability.
When they’re usable, it’s usually in the most popular and liquid small-cap names. (Some small caps are somewhat popular for trading purposes and demand enables a wider variety of options with tighter bid-asks.)
For most traders, index options or mid-cap options will generally offer better execution and pricing efficiency – and risk control for those hedging equity risk.
Why do valuation-based strategies struggle more in small-cap universes?
Liquidity constraints and uneven information flow make it more difficult for mispricing to predictably correct.
How do institutional ownership levels influence small-cap trading dynamics?
Lower institutional ownership in small caps has to do with the way the smaller markets incur greater transaction costs (easy to drag a market against you).
They tend to amplify volatility, trends, and flow-driven mispricings.
What risks come from low float and concentrated ownership structures in small caps?
When large holders trade, low float and concentrated ownership increase:
- volatility
- gap risk
- manipulation risk, and
- reversals
How should small-cap exposure be incorporated into a broader trading portfolio?
Small-cap exposure can be used strategically – e.g., 5% of a broader diversified portfolio.
Or it could be used as a tactical, alpha-seeking, “play the cycle” type of sleeve (e.g., coming out of recessions or steep market falls).
It works best when:
- position sizes are capped
- strategies are diversified, and
- exposure is balanced with more liquid large- or mid-cap positions
This helps control drawdowns and execution risk.
What are the most common mistakes traders make when trading small-cap stocks?
Common mistakes include:
- oversizing positions
- ignoring liquidity and slippage
- relying too heavily on stop losses
- chasing hype without volume confirmation
- underestimating gap risk, and
- treating small caps like large caps despite the very different execution/volatility/risk dynamics