Calmar Ratio (Calculation, Significance)


The Calmar Ratio is a performance metric used in the finance industry to evaluate the risk-adjusted return of an investment portfolio, particularly focusing on downside risk.
Named after its creator, Terry W. Young, the “Calmar” in Calmar Ratio stands for California Managed Accounts Reports.
This ratio is often used by hedge funds and other investment portfolios to demonstrate their risk-adjusted performance over a specified period, usually three years.
Key Takeaways – Calmar Ratio
- Risk-Adjusted Performance Measure
- The Calmar Ratio is a key performance metric used in finance to evaluate the risk-adjusted return of an investment portfolio.
- Useful for comparing the performance of hedge funds and other alternative investments.
- Calculation Method
- The ratio is calculated by dividing the annualized return of a portfolio by the maximum drawdown experienced over a specified period.
- This provides a measure of return per unit of downside risk.
- Interpretation and Application
- A higher Calmar Ratio indicates a more favorable risk-return profile.
- Suggests that the portfolio has achieved higher returns with lower drawdowns.
- It’s valuable for traders/investors seeking to understand the trade-off between risk and reward in their trading/investment strategies.
Calculation & Formula
The Calmar Ratio is calculated as follows:
Calmar Ratio = Maximum Drawdown / Annualized Return
Where:
- Annualized Return refers to the average annual return of the portfolio over a specified time period.
- Maximum Drawdown represents the largest peak-to-trough decline in the portfolio’s value over the same period.
Interpretation
- A higher Calmar Ratio indicates a more favorable risk-adjusted performance. It suggests that the portfolio has achieved higher returns with a lower maximum drawdown.
- A lower ratio indicates either lower returns, a higher drawdown, or both.
Significance
Risk Management
The Calmar Ratio is particularly valued for its focus on downside risk.
It directly relates the portfolio’s return to its worst-case scenario loss (drawdown).
Long-Term Performance Evaluation
It’s typically used for evaluating the long-term performance of investment portfolios – i.e., those with a multi-year investment horizon.
Hedge Fund Assessment
The ratio is a popular metric in assessing hedge fund performance, where managing downside risk is often a key objective.
Advantages
Emphasis on Severe Losses
The Calmar Ratio is particularly useful in assessing how well an investment manager navigates and minimizes significant market downturns.
Simplicity and Clarity
It provides a straightforward and easily interpretable measure of how much return the portfolio has generated per unit of its worst risk.
Limitations
Sensitivity to Time Frame
The Calmar Ratio can be highly sensitive to the chosen time frame.
A period marked by a significant downturn can drastically alter the ratio.
Not Suitable for Short-Term Analysis
Given its emphasis on long-term performance, the Calmar Ratio is less suitable for short-term investment strategies.
Maximum Drawdown as a Sole Risk Measure
Reliance on maximum drawdown as the sole measure of risk might not fully capture the breadth of risk factors affecting a portfolio.
Calmar Ratio – Python Code
To calculate the Calmar Ratio in Python, you’ll typically need to:
- Determine the annualized return of the investment portfolio.
- Calculate the maximum drawdown experienced by the portfolio over the specified period.
- Divide the annualized return by the maximum drawdown.
Here’s a Python function to calculate the Calmar Ratio:
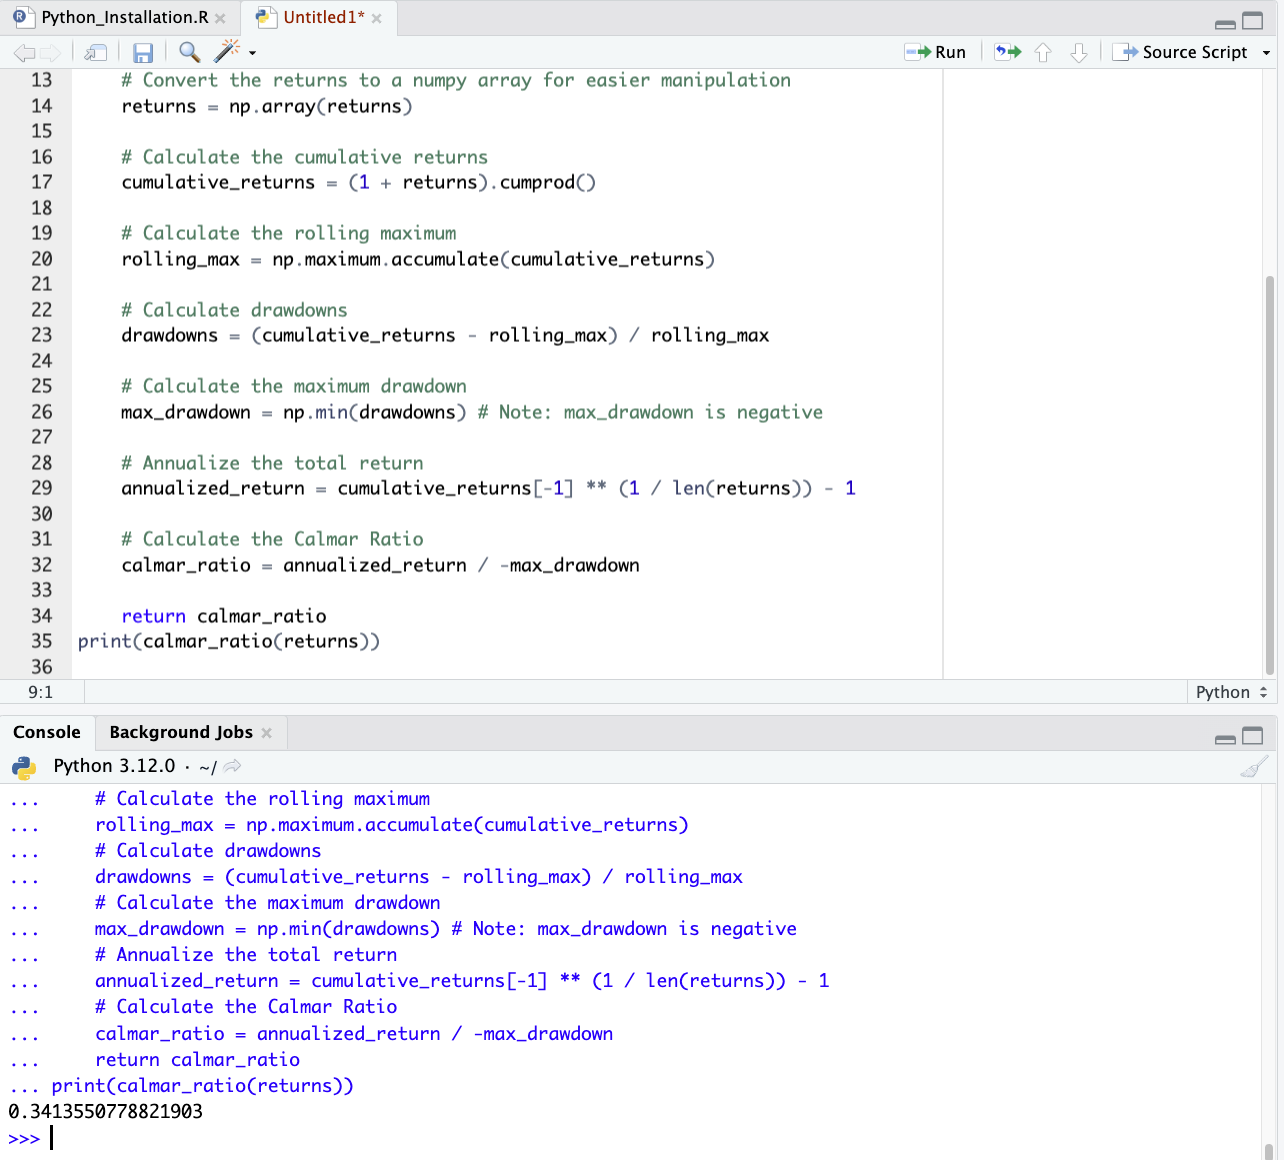
import numpy as np

def calmar_ratio(returns):
"""
Calculate the Calmar Ratio for a series of investment returns.

Parameters:
returns (array-like): A list or array of periodic returns.

Returns:
float: The Calmar Ratio.
"""
# Convert the returns to a numpy array for easier manipulation
returns = np.array(returns)

# Calculate the cumulative returns
cumulative_returns = (1 + returns).cumprod()

# Calculate the rolling maximum
rolling_max = np.maximum.accumulate(cumulative_returns)

# Calculate drawdowns
drawdowns = (cumulative_returns - rolling_max) / rolling_max

# Calculate the maximum drawdown
max_drawdown = np.min(drawdowns) # Note: max_drawdown is negative

# Annualize the total return
annualized_return = cumulative_returns[-1] ** (1 / len(returns)) - 1

# Calculate the Calmar Ratio
calmar_ratio = annualized_return / -max_drawdown

return calmar_ratio
print(calmar_ratio(returns))
Before using this code, be sure to use indentations (as shown below), given this is an important part of Python syntax.
In this function, you pass in a series of periodic returns (daily, monthly, etc.) and it calculates the Calmar Ratio.
The function assumes the input returns are in a format that can be directly converted to a NumPy array.
The annualized return calculation here assumes the returns aren’t already annualized and the period length is the same as the length of the returns array.
So be sure to adjust accordingly if your data differs.
Conclusion
The Calmar Ratio is used for evaluating the risk-adjusted returns of investment portfolios, particularly focusing on how well portfolios handle significant market downturns.
Its emphasis on maximum drawdown makes it especially relevant for long-term investors and hedge funds concerned with downside risk.
However, its effectiveness is dependent on the selection of an appropriate evaluation period and should be considered alongside other performance and risk metrics for a comprehensive investment analysis.
Related