Mid Cap Stocks Trading Strategies


Large caps are often highly picked over by human traders, systematic traders, and large institutions of all kinds.
As a result, they’re among the hardest markets to generate alpha in.
If you go down to small caps and micro caps, there’s often an issue with a lack of ideal liquidity and information dispersion. Options traders also have less to work with.
Mid caps – generally considered a valuation of $2 billion and $10 billion – take up the middle ground that appeals to a lot of traders.
We’ll explore specific mid cap trading strategies in this article.
Key Takeaways – Mid Cap Stocks Trading Strategies
- Mid caps are generally more suitable for more alpha-generative discretionary trading than large caps due to less institutional coverage and less broadly known information.
- This can make them appealing to smaller traders looking for pockets of greater opportunity/less competition.
- Mid-cap trading naturally works best when macro volatility is contained. It allows stock-specific fundamentals to matter more. (Broader market shocks tend to hit them harder.)
- Stable/easing credit conditions support mid caps because these companies rely more on external financing than large caps (and hence benefit more readily from improving funding terms).
- Rising dispersion across fundamentals creates opportunity for relative value trades. Valuation gaps, earnings trajectories, and balance sheet quality diverge meaningfully within mid-cap universes.
- Institutional capital flows into and rotates more selectively in mid cap environments. This can reinforce trends and post-earnings drift.
- Mid-cap strategies tend to struggle during risk-off phases due to their poorer liquidity and less global/diversified businesses.
Why Mid Caps Are a Distinct Trading Universe
Mid caps sit in a structural sweet spot:
- Large enough to have institutional participation and liquidity
- Small enough to have information inefficiencies
- More volatile than large caps, but less fragile than small caps (and especially micro caps)
This creates a level of tradable dispersion across fundamentals, flows, and technicals.
Core Mid-Cap Trading Strategies
We’ll go through each of these core mid cap trading strategies by looking at why it works, typical expressions or ways to trade it, and key risks.
1. Trend and Momentum Strategies
Why it works
Mid caps often experience multi-quarter re-ratings as they transition from niche to mainstream ownership.
Typical expressions
- Time-series momentum (3-12 month lookback).
- Typically excludes the most recent month to avoid short-term noise.
- Breakout systems on relative strength vs. indices.
- These involve buying a stock when its performance relative to a benchmark like the S&P 400 (a mid cap index) or Russell Midcap Index breaks above a prior range or high.
- The trade targets sustained outperformance driven by improving fundamentals and institutional flows rather than broad market beta.
- Moving average regime filters.
- Moving average regime filters use one or more moving averages to define whether a stock is in an uptrend or downtrend.
- The most popular here is the 50-/200-day MA. Shorter-term traders and day traders will also use 50-/200-period MAs, which fit whatever time period they’re trading.
- Trades are only taken in the direction of the prevailing trend/regime.
- Moving average regime filters use one or more moving averages to define whether a stock is in an uptrend or downtrend.
Key risk
Trends reverse faster than large caps due to thinner liquidity.
The amount of incremental capital flows needed to influence the price is naturally lower.
2. Earnings Drift and Post-Earnings Moves
Why it works
Mid-cap earnings surprises diffuse slower than in mega caps.
Sell-side coverage is thinner, and institutions scale positions over time.
Discretionary traders are a bigger part of the market and they can’t react as fast as systematic “algo” systems.
Typical expressions
- Long positive EPS surprise with raised guidance
- Short negative surprise with margin compression
- Hold 1-8 weeks post-earnings
Key risk
Earnings gaps can be violent. Account for gap risk.
3. Relative Value Within Industry Groups
Why it works
Mid-cap peer groups show large valuation dispersion due to uneven capital access and analyst attention.
Typical expressions
- Long quality balance sheets, short weakest peers
- Low debt, quality assets that produce FCF vs. high debt, lower-quality assets
- Trade FCF yield dispersion
- Trading free cash flow yield dispersion means going long relatively cheap stocks and short relatively expensive peers within the same industry. (Related: Value Factor)
- The goal is to profit as valuation gaps narrow through earnings, re-rating, or mean reversion.
Key risk
Factor crowding can temporarily override fundamentals.
4. Index Inclusion and Flow-Driven Trades
Why it works
Mid caps are sensitive to forced buying from index reconstitutions and ETF flows.
Typical expressions
- Buy ahead of Russell 2000 or S&P MidCap 400 additions
- Know the criteria and which companies are likely to meet it by the time of the next inclusion.
- Sell removals (harder to anticipate and already tend to be beaten down)
Key risk
Time-sensitive.
Also, can you stay ahead of the crowd?
It’s a niche strategy and one that could feasibly be accomplished by non-professional traders if they are on top of things ahead of other traders.
5. Liquidity and Volatility Compression Breakouts
Why it works
Mid caps frequently move from low-liquidity consolidation into volatility expansion phases.
Typical expressions
- Bollinger Band squeezes
- ATR compression with volume expansion.
- This describes a setup where price volatility contracts to unusually low levels, then breaks out as trading volume surges. This signals new participation and a higher probability of a sustained directional move.
- Options-implied vs. realized volatility divergence
Key risk
False breakouts are common, especially without volume confirmation.
6. Insider and Institutional Accumulation Signals
Why it works
Insider buying and 13F changes are more informative in mid caps than in large caps.
Typical expressions
- Cluster insider buys and more institutional ownership after drawdowns.
- This is one strategy that many like because management teams are the most knowledgeable about the business relative to outside traders/owners.
- Combine with improving fundamentals.
Key risk
Insiders can be early and wrong in cyclical turns. Even the most knowledgeable about a business may not necessarily be the most insightful on when the right time to buy/sell is.
7. M&A and Strategic Optionality Trades
Why it works
Mid caps are frequent acquisition targets due to manageable deal sizes and strategic tuck-in potential.
Large caps are not as frequently bought out by other companies because of how large they are.
Mid caps bring that optionality and the attraction of being paid a 20-30%+ premium for what they’re worth.
We say “optionality” because it’s not something you can rely on, but it’s something you can have in your back pocket whereas it’s almost entirely off the table with most large caps. (They’re the ones doing the acquiring and trying to make sure they work.)
Typical expressions
- Long companies with clean balance sheets and niche dominance
- If you’re specifically looking for good M&A targets, private equity (an example of a common type of financial/sometimes strategic buyer) typically favors companies with stable cash flows, predictable revenue, defensible market positions, operational inefficiencies to optimize, and balance sheets that can support leverage without impairing long-term value creation.
- Leverage is popular to increase the IRR achieved and to reduce the amount of equity that has to be used to buy the business.
- If you’re specifically looking for good M&A targets, private equity (an example of a common type of financial/sometimes strategic buyer) typically favors companies with stable cash flows, predictable revenue, defensible market positions, operational inefficiencies to optimize, and balance sheets that can support leverage without impairing long-term value creation.
- Long undervalued platforms in consolidating industries
Key risk
Optionality – i.e., the idea that they could be good M&A targets – can remain dormant for long periods.
Risk Management Specific to Mid Caps
Mid-cap stocks generally trade with less depth than large caps.
Below we can look at correlations (+0.90 large cap/mid cap correlation) as well as return and volatility metrics since 1995:
| Name | Ticker | SPY | MDY | Annualized Return | Daily Standard Deviation | Monthly Standard Deviation | Annualized Standard Deviation |
|---|---|---|---|---|---|---|---|
| State Street SPDR S&P 500 ETF | SPY | 1.00 | 0.90 | 10.60% | 1.21% | 4.35% | 15.08% |
| SPDR S&P MIDCAP 400 ETF Trust | MDY | 0.90 | 1.00 | 11.03% | 1.36% | 5.13% | 17.78% |
Mid caps generally see 18% annualized vol compared to 15% for US large caps.
The extra volatility increases the impact of sudden order flow and news-driven volatility.
As a result, position sizing is typically kept below large-cap norms.
Smaller allocations help limit drawdowns. As we’ll explore a bit later in the article, the max drawdown for large cap equities since 1972 is 51.0% vs. 54.1% for mid caps.
Hard Stops and Gap Risk
Gap risk is more pronounced in mid caps. Particularly true around earnings, guidance changes, or corporate events.
Prices can move sharply without trading through intermediate levels.
Liquidity Awareness Around Macro Events
Major macro events (e.g., central bank decisions, inflation releases, geopolitical matters) can cause disproportionate volatility in mid-cap stocks because they tend to be less diversified.
Traders often avoid illiquid names during these periods, as entries and exits may become costly.
Conservative Use of Leverage
Leverage naturally magnifies both returns and risks, but in mid caps the downside tends to outweigh the positives.
Without leverage – though technically stocks are already leveraged because companies have debt – they already have large down moves.
For this reason, leverage is used cautiously, if at all, and with well-defined risk parameters.
Portfolio Construction Angle
Mid-cap trading works best when:
- You diversify across strategies (like those mentioned above), not just names
- You cap exposure per name and per sector
- You avoid over-concentration in speculative companies
- Focus on the highest-quality names – e.g., quality earnings relative to the price, lower leverage
Many professionals treat mid caps as a return-enhancing sleeve, not a core beta engine.
Large Caps, Mid Caps, or Both?
Let’s run a backtest where we have the following portfolios:
Portfolio 1
- 100% Large Caps
Portfolio 2
- 100% Mid Caps
Portfolio 3
- 50% Large Caps
- 50% Mid Caps
Which performs best (going back to 1972)?
Performance Summary
| Metric | Portfolio 1 | Portfolio 2 | Portfolio 3 |
|---|---|---|---|
| Start Balance | $10,000 | $10,000 | $10,000 |
| End Balance | $2,649,598 | $4,035,904 | $3,390,385 |
| Annualized Return (CAGR) | 10.89% | 11.75% | 11.39% |
| Standard Deviation | 15.27% | 17.32% | 16.01% |
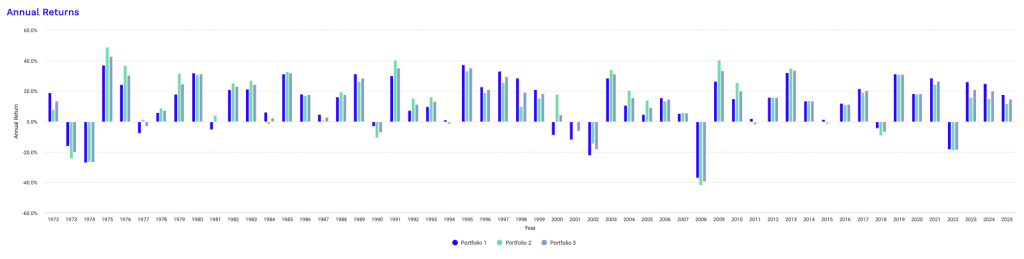
| Best Year | 37.45% | 48.69% | 42.82% |
| Worst Year | -37.02% | -41.82% | -39.42% |
| Maximum Drawdown | -50.97% | -54.14% | -52.25% |
| Sharpe Ratio | 0.46 | 0.47 | 0.48 |
| Sortino Ratio | 0.68 | 0.70 | 0.71 |
If we look at the risk-adjusted metrics (green font), the Mid Caps do slightly better in risk-adjusted terms (Sharpe, Sortino).
The combined portfolio of 50% of each, does best of all from this perspective. Not by much, but still a slight winner because of the diversification effect (a wider asset base).
That means, volatility-adjusted, it would perform best at around 12.3% annualized returns.
Some deeper statistics:
Risk and Return Metrics
| Metric | Portfolio 1 | Portfolio 2 | Portfolio 3 |
|---|---|---|---|
| Arithmetic Mean (monthly) | 0.96% | 1.06% | 1.01% |
| Arithmetic Mean (annualized) | 12.18% | 13.44% | 12.83% |
| Geometric Mean (monthly) | 0.86% | 0.93% | 0.90% |
| Geometric Mean (annualized) | 10.89% | 11.75% | 11.39% |
| Standard Deviation (monthly) | 4.41% | 5.00% | 4.62% |
| Standard Deviation (annualized) | 15.27% | 17.32% | 16.01% |
| Downside Deviation (monthly) | 2.81% | 3.20% | 2.95% |
| Maximum Drawdown | -50.97% | -54.14% | -52.25% |
| Benchmark Correlation | 0.99 | 0.96 | 0.99 |
| Beta(*) | 0.97 | 1.06 | 1.02 |
| Alpha (annualized) | 0.33% | 0.35% | 0.36% |
| R2 | 98.08% | 92.14% | 98.32% |
| Sharpe Ratio | 0.46 | 0.47 | 0.48 |
| Sortino Ratio | 0.68 | 0.70 | 0.71 |
| Treynor Ratio (%) | 7.32 | 7.72 | 7.55 |
| Calmar Ratio | 2.76 | 1.12 | 1.78 |
| Modigliani–Modigliani Measure | 11.71% | 11.88% | 11.95% |
| Active Return | 0.03% | 0.90% | 0.54% |
| Tracking Error | 2.17% | 4.96% | 2.09% |
| Information Ratio | 0.01 | 0.18 | 0.26 |
| Skewness | -0.43 | -0.51 | -0.50 |
| Excess Kurtosis | 1.86 | 2.34 | 2.16 |
| Historical Value-at-Risk (5%) | 6.70% | 7.22% | 6.87% |
| Analytical Value-at-Risk (5%) | 6.29% | 7.17% | 6.59% |
| Conditional Value-at-Risk (5%) | 9.55% | 10.73% | 10.04% |
| Upside Capture Ratio (%) | 96.84 | 108.18 | 102.64 |
| Downside Capture Ratio (%) | 95.66 | 106.01 | 100.70 |
| Safe Withdrawal Rate | 4.15% | 4.92% | 4.59% |
| Perpetual Withdrawal Rate | 6.30% | 7.03% | 6.73% |
| Positive Periods | 408 out of 648 (62.96%) | 391 out of 648 (60.34%) | 402 out of 648 (62.04%) |
| Gain/Loss Ratio | 1.02 | 1.13 | 1.08 |
| * US Stock Market is used as the benchmark for calculations. Value-at-risk metrics are monthly values. | |||
What can we gain from all this?
Return Profile and Compounding Quality
Portfolio 2, the all mid cap portfolio, gives you the highest arithmetic and geometric returns, both monthly and annualized. This has to do with the stronger long-term growth profile of mid-cap equities.
Portfolio 3 still gives a compelling balance, capturing most of that upside while better smoothing the return path.
Portfolio 1 shows the lowest returns, consistent with large caps’ more mature growth dynamics.
Importantly, the gap between arithmetic and geometric returns is widest for mid caps, which has to do with the greater volatility drag inherent in Portfolio 2.
Volatility and Drawdown Characteristics
Risk metrics are clearly different.
Portfolio 2 shows the highest standard deviation (often what we call volatility) and downside deviation. Mid caps experience larger and more frequent swings, some 20% more than large caps.
As mentioned, it has a deeper maximum drawdown (~54%). Portfolio 1 is the least volatile, relatively speaking.
Portfolio 3 meaningfully reduces volatility and drawdown by some amount relative to pure mid caps.
Market Exposure and Beta Behavior
Portfolio 2 carries a beta above one, so there’s some amplified sensitivity to broad market movements.
Portfolio 1 is more or less 1 (large cap stocks are mostly thought of as having a beta of 1, as they’re the reference point), while Portfolio 3 lands in between.
Correlations are naturally high across all portfolios, but Portfolio 2’s lower R² suggests more idiosyncratic behavior and dispersion.
This implies greater opportunity for alpha, but also less predictability during market stress.
Risk-Adjusted Performance
On traditional risk-adjusted metrics, differences are nuanced.
Sharpe and Sortino ratios are modestly higher for Portfolios 2 and 3, suggesting improved compensation for risk.
The Calmar ratio strongly favors Portfolio 1, as that’s drawdown-focused, and Portfolio 3 again sits between the extremes.
From a downside-risk perspective, the blended portfolio offers a more efficient trade-off than pure mid caps.
Tail Risk and Distribution Shape
All portfolios display negative skewness and positive excess kurtosis, meaning losses tend to be sharper than gains and tails are fat.
This is standard with equity-focused portfolios, especially when other assets aren’t added to them (e.g., bonds, gold, commodities).
Portfolio 2 shows the most pronounced tail risk because of the mid cap concentration, with the highest Value-at-Risk and Conditional Value-at-Risk metrics.
Portfolio 3 moderates these tail risks without eliminating them, so you get a bit of diversification benefits even within equities.
It’s not much, since we’re all in the same asset class, but it makes slight differences that can compound over time.
Capture Ratios and Long-Term Sustainability
Portfolio 2 gives you more upside in strong markets but also more downside during drawdowns.
Portfolio 1 undercaptures both.
Portfolio 3 achieves near-market upside capture with some improved downside containment.
This translates into higher safe and perpetual withdrawal rates than Portfolio 1, while avoiding the volatility burden of Portfolio 2.
Overall Interpretation
The results show a classic trade-off.
Large caps offer stability, mid caps deliver growth, and the blended portfolio provides the most balanced risk-adjusted profile.
For those focused on long-term compounding with manageable drawdowns, Portfolio 3 (large cap/mid cap mix) is the strongest overall structure due to having the widest possible asset base.
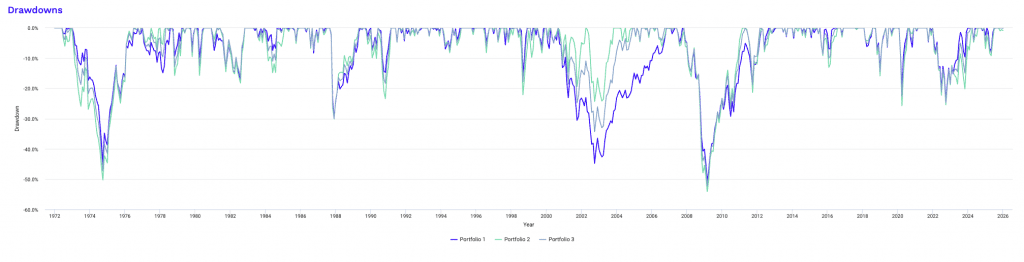
Drawdowns over time:
Year-by-year performance:
Top 10 Drawdowns for Large Caps:
Drawdowns for Portfolio 1
| Rank | Start | End | Length | Recovery By | Recovery Time | Underwater Period | Drawdown |
|---|---|---|---|---|---|---|---|
| 1 | Nov 2007 | Feb 2009 | 1 year 4 months | Aug 2012 | 3 years 6 months | 4 years 10 months | -50.97% |
| 2 | Jan 1973 | Sep 1974 | 1 year 9 months | Sep 1976 | 2 years | 3 years 9 months | -44.87% |
| 3 | Sep 2000 | Sep 2002 | 2 years 1 month | Nov 2006 | 4 years 2 months | 6 years 3 months | -44.82% |
| 4 | Sep 1987 | Nov 1987 | 3 months | May 1989 | 1 year 6 months | 1 year 9 months | -29.78% |
| 5 | Jan 2022 | Sep 2022 | 9 months | Dec 2023 | 1 year 3 months | 2 years | -23.95% |
| 6 | Jan 2020 | Mar 2020 | 3 months | Jul 2020 | 4 months | 7 months | -19.63% |
| 7 | Dec 1980 | Jul 1982 | 1 year 8 months | Oct 1982 | 3 months | 1 year 11 months | -17.00% |
| 8 | Jul 1998 | Aug 1998 | 2 months | Nov 1998 | 3 months | 5 months | -15.38% |
| 9 | Jan 1977 | Feb 1978 | 1 year 2 months | Aug 1978 | 6 months | 1 year 8 months | -14.86% |
| 10 | Jun 1990 | Oct 1990 | 5 months | Feb 1991 | 4 months | 9 months | -14.70% |
| Worst 10 drawdowns included above | |||||||
Top 10 Drawdowns for Mid Caps:
Drawdowns for Portfolio 2
| Rank | Start | End | Length | Recovery By | Recovery Time | Underwater Period | Drawdown |
|---|---|---|---|---|---|---|---|
| 1 | Jun 2007 | Feb 2009 | 1 year 9 months | Feb 2011 | 2 years | 3 years 9 months | -54.14% |
| 2 | Dec 1972 | Sep 1974 | 1 year 10 months | Jun 1976 | 1 year 9 months | 3 years 7 months | -50.32% |
| 3 | Sep 1987 | Nov 1987 | 3 months | Apr 1989 | 1 year 5 months | 1 year 8 months | -30.12% |
| 4 | Jan 2020 | Mar 2020 | 3 months | Aug 2020 | 5 months | 8 months | -25.74% |
| 5 | Jan 2022 | Sep 2022 | 9 months | Mar 2024 | 1 year 6 months | 2 years 3 months | -25.49% |
| 6 | Apr 2002 | Sep 2002 | 6 months | Oct 2003 | 1 year 1 month | 1 year 7 months | -24.36% |
| 7 | Sep 1989 | Oct 1990 | 1 year 2 months | Feb 1991 | 4 months | 1 year 6 months | -23.38% |
| 8 | Apr 1998 | Aug 1998 | 5 months | Apr 1999 | 8 months | 1 year 1 month | -22.10% |
| 9 | May 2011 | Sep 2011 | 5 months | Dec 2012 | 1 year 3 months | 1 year 8 months | -21.40% |
| 10 | Sep 2000 | Sep 2001 | 1 year 1 month | Mar 2002 | 6 months | 1 year 7 months | -19.33% |
| Worst 10 drawdowns included above | |||||||
Monthly Correlations
| Name | US Large Cap | US Mid Cap | Portfolio 1 | Portfolio 2 | Portfolio 3 |
|---|---|---|---|---|---|
| US Large Cap | 1.00 | 0.93 | 1.00 | 0.93 | 0.98 |
| US Mid Cap | 0.93 | 1.00 | 0.93 | 1.00 | 0.98 |
When Mid-Cap Trading Works Best
Mid-cap strategies outperform when:
- Macro volatility is moderate, not extreme.
- Credit conditions are stable or easing. Smaller firms tend to have more restrictive credit access than large caps.
- Dispersion across fundamentals is rising.
They struggle during risk-off phases. Large cap value generally does best in the stock sphere during this phase. (They also fall, just less.)
FAQs – Mid Cap Stocks Trading Strategies
What defines a mid-cap stock, and how does it differ from large-cap and small-cap stocks?
A mid-cap stock typically means a company with a market cap between roughly $2 billion and $10 billion.
These firms are larger and more established than small caps (sub-$2 billion), yet less mature and less efficiently priced overall than large-cap companies ($10+ billion).
What types of inefficiencies are most common in mid-cap stocks?
Mid-cap stocks commonly have information inefficiencies due to thinner analyst coverage, slower earnings information diffusion, and less efficient institutional pricing.
Valuation dispersion, delayed reactions to earnings surprises, uneven liquidity, and flow-driven mispricings are also common.
In turn, this can create more opportunities for momentum, relative value/pairs trading, and event-driven trading strategies.
How does liquidity in mid caps compare to large caps and small caps?
Mid-cap stocks will generally offer you adequate but uneven liquidity.
They trade with less depth and wider bid-ask spreads than large caps.
At the same time, they’re generally far more liquid than small caps.
It’s another one of those “middle ground” factors that appeals to many traders.
This allows institutional participation while still creating more price sensitivity to incremental order flow and news compared to what you see with large caps.
Some mid caps don’t have liquid options markets, which can be a deal breaker for some traders.
Why is generating alpha generally harder in large-cap stocks?
Generating alpha in large-cap stocks is harder because they’re heavily researched, highly liquid (easy for lots of participants to come in, which on net adds information to the market), and dominated by institutional and systematic trading.
All in all, this leaves fewer persistent inefficiencies to exploit.
What is the historical risk premium of mid-cap stocks relative to large-cap stocks?
Historically, mid-cap stocks have delivered a modest risk premium over large caps, typically around 0.5 to 1.5 percentage points annually.
This premium compensates investors for higher volatility, deeper drawdowns, and greater sensitivity to economic and liquidity conditions.
How do mid-cap stocks typically perform across different economic cycles?
Mid-cap stocks often outperform during early and mid-cycle expansions as growth and credit improve.
But they tend to underperform large caps during both late-cycle slowdowns and recessionary periods when liquidity tightens and risk aversion rises.
Larger, more diversified companies with quality cash flows also suffer during recessions, just less.
Why do mid caps tend to experience stronger earnings drift than large caps?
Mid caps experience stronger earnings drift because analyst coverage is thinner, institutional investors scale positions more gradually because of the lower liquidity, and information diffuses more slowly.
This allows positive or negative earnings surprises to be incorporated into prices over weeks rather than days.
This also makes such markets more amenable to discretionary traders over systematic traders.
How reliable are momentum and trend-following strategies in mid-cap stocks?
Momentum and trend-following strategies are generally reliable in mid-cap stocks because trends can last as institutional ownership builds.
Nonetheless, thinner liquidity means reversals can also be sharper.
So, following these strategies generally means tighter risk controls than in large-cap markets.
Why do valuation spreads persist longer in mid-cap peer groups?
Valuation spreads persist longer in mid-cap peer groups due to uneven analyst coverage, differing capital access, slower institutional rebalancing, and thinner liquidity.
So mispricings can remain unresolved for extended periods.
How should position sizing differ for mid-cap versus large-cap trades?
Position sizing in mid-cap trades should generally be smaller than large-cap trades to account for higher volatility.
With mid caps averaging roughly 20% higher annualized volatility (18% annualized vol vs. 15% annualized vol in large caps in US-focused market), equal-risk sizing requires either reducing mid-cap exposure or pairing it with cash or low-duration assets like short-term bonds.
Alternatively, large-cap exposure can be scaled up to match mid-cap risk.
But this nonetheless increases overall portfolio leverage and drawdown potential.
How can traders identify high-quality mid caps that bring the extra optionality of being good buyout/M&A candidates?
Here are generally the traits you’d look for:
- Stable and recurring revenue
- Predictable revenue model with limited customer concentration risk
- Strong free cash flow conversion
- Defensible niche or leadership position within a fragmented industry
- Clean or underlevered balance sheet that can support additional leverage
- Operational inefficiencies that a strategic buyer or private equity/financial buyer could realistically improve
- Scalable platform potential through add-on acquisitions or geographic expansion
- Valuation below strategic or private market comparables
Related: Private Equity Interview Questions
Are options strategies effective with mid-cap stocks?
Options strategies can be effective in mid-cap stocks, but liquidity is more uneven than in large caps.
An option with a 0.90-1.00 spread looks decent on the surface, but it’s still a 10% transaction cost. That makes it hard to win in an otherwise competitive market.
The best opportunities tend to be in index options or the most liquid mid-cap names.
Ultimately it’s best when the spreads and implied volatility are tradable.
How does mid-cap volatility affect long-term compounding?
Higher mid-cap volatility can increase volatility drag.
This widens the gap between arithmetic and geometric returns.
Strong performance requires either higher gross returns, better risk management, or diversification (the easiest) to prevent large drawdowns from impairing long-term compounding.
How to get better compounding is covered here.
How do mid-cap drawdowns compare historically to large-cap drawdowns?
Historically, mid-cap drawdowns have been deeper and more volatile than large-cap drawdowns.
In major market stress periods over the past 55+ years, mid caps have experienced peak-to-trough losses of roughly 54% versus about 51% for large caps.
Recoveries can be faster during rebounds, but the higher downside reflects greater sensitivity to liquidity shocks, earnings uncertainty, and general risk aversion.
What types of traders benefit most from focusing on mid-cap stocks?
Mid-cap stocks tend to benefit traders who operate between pure long-term investing and very short-term trading.
Swing traders, position traders, and medium-term systematic traders often find mid caps attractive because they combine enough liquidity with meaningful price dispersion.
Fundamental traders who focus on earnings trends, valuation gaps, balance-sheet quality, and such factors can exploit slower information diffusion than in large caps.
Event-driven traders also benefit, as mid caps respond more strongly to matters like earnings surprises, index changes, and M&A speculation. Incremental capital flows shift their prices more than large caps.
In contrast, high-frequency traders (quant systematic types) and ultra-short-term scalpers and day traders usually prefer large caps due to superior liquidity.
Purely passive investors may favor a variety of choices because transaction costs affect them less.