Large Deviation Theory in Finance, Markets & Trading


Large Deviation Theory (LDT) is a branch of probability theory that studies the asymptotic behavior of remote tails of sequences of probability distributions.
It’s useful in quantifying the probabilities of rare events in systems with many degrees of freedom, such as financial markets and trading activities.
In finance, these “rare events” can include extreme market movements, such as crashes, large downturns, or spikes, which, while unlikely, can have significant impacts on trading and risk management strategies.
Key Takeaways – Large Deviation Theory in Finance, Markets & Trading
- Predicts Rare Events
- Large Deviation Theory helps in quantifying the probabilities of rare events, such as extreme market crashes or surges.
- Enables traders to assess and mitigate risks of significant financial losses.
- Informs Risk Management
- By estimating the likelihood of substantial deviations from expected outcomes, traders can better design hedging strategies and manage portfolio risk efficiently.
- Enhances Stress Testing
- Provides a mathematical foundation for stress testing financial portfolios and institutions
- Ensures preparedness for low-probability, high-impact market scenarios.
Here are the key concepts, applications, and how traders can use Large Deviation Theory:
Key Concepts of Large Deviation Theory
Rate Function
A key concept in LDT is the rate function (explained more below), which quantifies the exponential decay of the probability of large deviations from the mean or expected value.
The rate function is a non-negative, lower semi-continuous function that often has a unique minimum at the expected value of the underlying random variable.
Principle of Large Deviations
This principle provides a way to estimate the probability of rare events through the exponential decay rate characterized by the rate function.
It essentially says that the probability of certain outcomes becomes exponentially small as the system size or the number of observations increases.
Cramér’s Theorem
One of the foundational results in LDT, Cramér’s Theorem, gives an explicit form of the rate function for sums of independent and identically distributed random variables under certain conditions.
This theorem is relevant in finance, where returns over time can be modeled as sums of random variables.
Math Behind Large Deviation Theory
Here is a basic overview of the mathematics behind Large Deviation Theory:
Key Idea
Characterize the asymptotic behavior of rare events as:
- P(Xn ∈ An) ≍ e^-nI(A)
Where:
- Xn = A sequence of random variables
- An = A sequence of rare event sets
- P(Xn ∈ An) = Probability of rare event An
- I(A) = Rate function that controls probability decay
- ≍ denotes asymptotic equivalence as n → ∞
Two Main Approaches
- Cramér Theorem – Use moment generating function to derive rate function I(x) for sample mean Xn
- Gärtner–Ellis Theorem – Derive rate function I(x) from limit of scaled cumulant generating function
Key Properties of Rate Function I(x)
- Convex and lower semi-continuous
- I(x) ≥ 0 with equality at most likely x
- Unlikely events have increasing I(x)
So in essence, Large Deviation Theory characterizes rare events through the exponential decay of probabilities governed by a rate function.
This provides a mathematically rigorous way to study tail events.
Applications of Large Deviation Theory in Finance, Markets & Trading
Risk Management
LDT can be used to assess the risk of extreme losses in portfolios.
By understanding the probabilities of rare but extreme market movements, risk managers can better prepare and hedge against potential losses.
Option Pricing
In options markets, the probabilities of significant movements in underlying assets are important for pricing.
LDT helps in estimating the tails of the distribution of asset returns, which is important for pricing out-of-the-money options.
Tail pricing matters a lot for OTM options because of how extreme events can cause them to return many multiples of the initial premium investment.
Portfolio Optimization
By quantifying the risks of rare events, LDT allows for better portfolio optimization and portfolios that are less vulnerable to extreme market movements.
Stress Testing
LDT can be used in stress testing financial institutions and their exposures to extreme market events.
By estimating the probability and impact of rare events, institutions can better understand their vulnerabilities.
How Traders Can Use Large Deviation Theory
Tail Risk Hedging
Traders can use LDT to identify and hedge against tail risks, or the risks of rare events that could lead to significant losses.
This might involve buying options or other financial instruments that pay off in extreme scenarios.
Diversifying
Learning how to diversify well and spreading out one’s funds in a balanced, efficient way can increase one’s return relative to their risk and better thin out the left tail of their distribution.
Strategic Positioning
Understanding the probabilities of large deviations in market prices can help traders position themselves to benefit from rare events – either by taking positions that will benefit from such events or by avoiding positions that are likely to suffer.
Modeling & Simulation
Traders can incorporate LDT into their models and simulations to better capture the risks of extreme price movements.
This can lead to more accurate modeling of potential outcomes and better decision-making.
Optimizing Order Execution
For large trades, LDT can be used to optimize order execution to minimize the market impact and the risk of significantly moving the price against the trader’s interest.
Coding Example – Large Deviation Theory
We can create a simplified Python example that illustrates how to estimate the probability of rare events (extreme market moves) using synthetic financial data that’ll give a basic demonstration relevant to finance.
Example: Estimating Extreme Market Moves Probability
We’ll use historical stock price data to estimate the probability of experiencing a significant price drop within a certain period, based on historical occurrences.
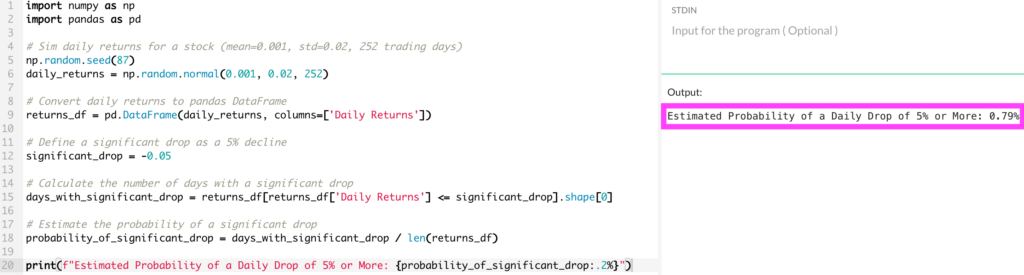
import numpy as np
import pandas as pd

# Sim daily returns for a stock (mean=0.001, std=0.02, 252 trading days)
np.random.seed(87) # For reproducibility
daily_returns = np.random.normal(0.001, 0.02, 252)

# Convert daily returns to a pandas DataFrame
returns_df = pd.DataFrame(daily_returns, columns=['Daily Returns'])

# Define a significant drop as a 5% decline
significant_drop = -0.05

# Calculate the number of days with a significant drop
days_with_significant_drop = returns_df[returns_df['Daily Returns'] <= significant_drop].shape[0]

# Estimate the probability of a significant drop
probability_of_significant_drop = days_with_significant_drop / len(returns_df)

print(f"Estimated Probability of a Daily Drop of 5% or More: {probability_of_significant_drop:.2%}")
Explanation
- We simulate daily returns for a stock to mimic historical data.
- In practice, you’d use actual historical returns data.
- We define a “significant drop” as a 5% decline in daily returns, though this threshold can be adjusted based on your criteria for what constitutes a rare event.
- We calculate the number of days that experienced this significant drop and then estimate the probability of such a drop occurring on any given day.
In our particular simulation, it came to 0.79% (so, 2 days out of 252 – the number of trading days in a year). It could be higher or lower.
Key Takeaways
- This example illustrates how to estimate the probability of rare market events (significant price drops) using historical data (or synthetic data), an important concept in Large Deviation Theory applied to finance.
- Highlights the importance of historical data analysis in understanding market risks and preparing for extreme market movements.
- While this doesn’t capture the mathematical rigor of LDT, it provides a practical approach to estimating rare event probabilities, which is useful for risk management and financial planning.
Conclusion
Large Deviation Theory is a framework for understanding and managing the risks associated with rare events in financial markets.
By quantifying the probabilities of these events, traders and risk managers can better hedge against potential losses, price options more accurately, and optimize portfolios against extreme risks.