How to Make $100,000 Per Year From the Markets Within 4 Years


People flock to the financial markets with the intention of making money and securing themselves financially.
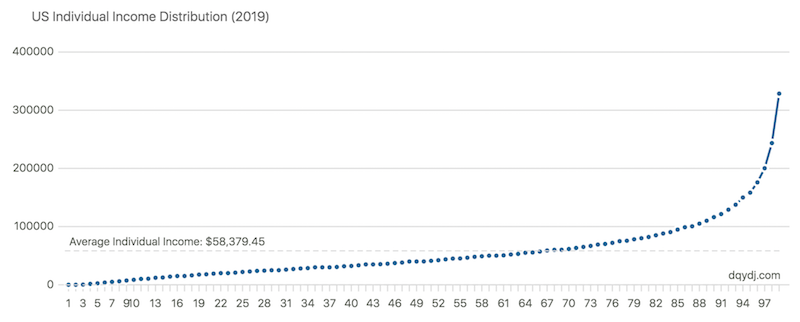
This article provides an illustrative example of how to make $100,000 per year from the markets. For most, this amount is enough to support a quality lifestyle. At the least, it’s a nice side income stream that alone would put you in the 90th percentile in terms of the US individual income distribution (i.e., pre-tax).
For many, being “financially free” might mean generating enough income off your assets such that you never have to touch the principal and ever worry about running out.
To run this exercise, you need to know a few pieces of information first and make reasonable assumptions.
1. What is the yield you’re going to be generating off your assets?
2. How much income do you want to generate per year?
3. Are you able to use leverage to help you achieve this goal?
4. If you can use leverage, what is the rate you’re able to borrow at?
5. To achieve this goal, how much do you have available right now to invest/trade and how much are you able to incrementally contribute going forward?
6. What are the associated risks?
7. What can you do to mitigate such risks and maximize your return to risk ratio?
Regarding question two, for purposes of this article, we’ve settled on $100,000.
For question five, we’ve assumed you’re starting at $0 and will save $6,000 per month. Yes, that’s a lot for somebody on a typical working salary to save each month. Saving $6,000 per year could make sense for someone who, for example, makes $100,000 per year after tax, and has a relatively frugal lifestyle with a “burn rate” (i.e., what you spend on non-discretionary spending) of $2,500 per month.
If saving $6,000 per month is not feasible and you can save a smaller amount, then either it will take you longer to generate this type of income stream (especially in terms of starting from scratch), or you will need to lower your expectations of what kind of income stream you can generate within this timeframe in terms of the total.
If you already have savings, that’s great because that speeds forward your timeline. For this article, we’re assuming a starting point of zero.
Let’s fill in our assumptions
– Asset or portfolio yield: 10 percent
– $100,000 in income per year (this is net, or after accounting for borrowing costs)
– Assume 4:1 borrowing capacity (similar to real estate), or a margin requirement of 25 percent
– Borrow rate of 1.5 percent
– Start with nothing and contribute $6,000 per month
Under these assumptions, how long would it take you to reach your $100,000 per year goal?
47 months, or just under four years.
Let’s go through the calculations
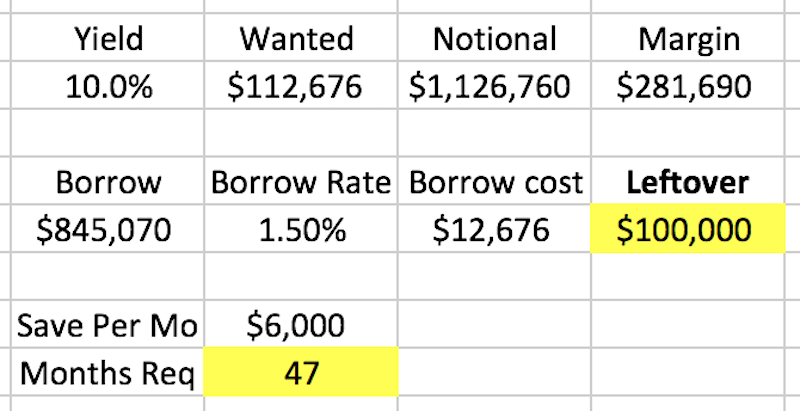
Yield is plugged in as 10 percent. Because we’re borrowing at 1.5 percent and have 25 percent margin, we need to recognize that our actual yield is just 8.5 percent, taking the difference between 10 and 1.5.
So, the actual amount we need to generate per year in income is actually above $100,000 because we’ll need to cover our borrowing costs. This number comes to $112,676.
How did we get this number?
Through some reverse engineering of the problem.
Your “income generation equation” is a function of the amount of yield you’re generating from your own money (equity) and borrowed money (margin or leverage) minus the cost of the borrowed money.
Therefore, we can represent this as:
Income Generated = (Equity + Borrowed) * Yield – Borrowed * Borrowing Cost
You know your yield is 10 percent, or 0.1 when expressed as a decimal. Your borrowing cost is 1.5 percent, or 0.015 when expressed as a decimal.
You want to make $100,000 per year, so filling in the blanks, your equation turns into:
$100,000 = (Equity + Borrowed) * 0.1 – Borrowed * .015
Now we still have too many variables to solve this equation.
But we do know that the amount of borrowed money will be three times as large as the amount of equity.
If your borrowing capacity is 4:1, or a 25 percent margin requirement, that means you’re financing the investment with 75 percent borrowed money and 25 percent equity (i.e., your own contribution).
That means your borrowed money is three times as large as your equity. Since we know the ratio, we can express our equity as a fraction of the borrowed money in our equation.
Equity is essentially borrowed money divided by three.
Accordingly:
$100,000 = (Borrowed/3 + Borrowed) * 0.1 – Borrowed * .015
Now we finally have a clean algebra problem. So, we can begin solving it.
$100,000 = (4/3 * Borrowed) * 0.1 – Borrowed * .015
$100,000 = 4/30 * Borrowed – 0.015 * Borrowed
$100,000 = 0.11833*Borrowed
Borrowed = $100,000/.11833
Borrowed = $845,070
So, we know we need to borrow $845,070.
Our equity is one-third of this amount, or $281,690. This is the margin requirement we’ll have to post. Namely, this is the amount we’ll need to save, also known as our equity contribution.
Adding the two together, this is $1,126,760.
At a 10 percent yield, that’s $112,676 generated per year.
Since we’re borrowing $845,070 and paying 1.5 percent interest, multiplying those two together comes to $12,676. (At a broker like IBKR, you can borrow at a 1 percent interest rate for dollar amounts between $100,000 and $1 million, but for the sake of simplicity, we’re assuming a 1.5 percent interest rate charged throughout.)
Subtracting $12,676 from $112,676 gets us to $100,000.
Since the amount we need to put down is $281,690 and we assume that saving $6,000 per month gets us there in 47 months dividing the two numbers.
But now we need to answer the obvious questions when it comes to turning this into a reality:
– What do we invest in?
– How do we borrow at 1.5 percent?
– What are the ever-important risks?
Identifying the risks
In trading and investing, you always need to identify what your risks are, how big they are, and what to do about them.
They come in various forms. You must then work toward minimizing them as best as possible to keep the big upside without having the unacceptable downside. Having to accept some risk is necessary, but you should never lose more than you can afford, and you especially want to avoid the “risk of ruin” or losing all your money altogether.
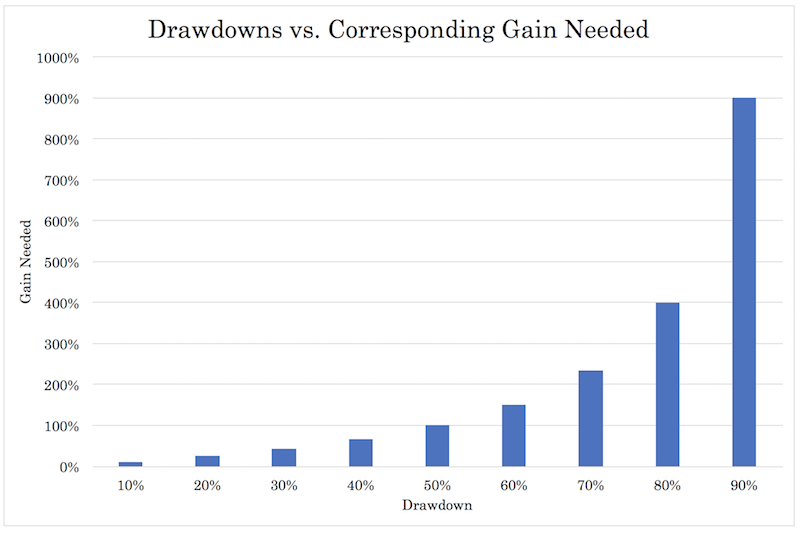
Big gains don’t offset big losses in percentage terms, so they need to be avoided. If you draw down 50 percent, you need a 100 percent gain just to get back to where you were.
In this case, we can identify plenty of risks that need to be identified in this situation and mitigated as best as possible.
How do we get to 10 percent annual returns?
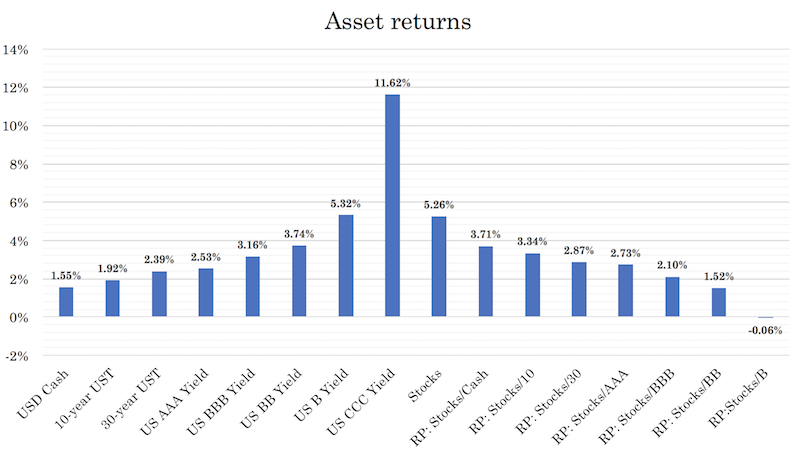
Based on our chart of where forward asset returns are right now, nothing is giving you 10 percent or better outside of CCC bonds, but many of these will default (and requires having credit selection skills, and picking winners and losers is not easy). Certain emerging markets will expectedly provide better returns if you give it enough of a time horizon, but the extra risk is discounted into the price.
When approaching what to invest in in the public markets, your starting point should be that most everything is roughly an equally good or bad bet. There are a lot of smart people trying to pick the winners and losers and it’s hard to generate alpha. Investing is hard for the same reason betting on sports is hard – the range of unknowns is so large relative to what can be known relative to what’s already discounted into the price.
While it’s pretty straightforward what companies are going to earn more relative to other companies, and which are growing more than others, it is not easy to convert this knowledge into winning bets because that consensus is already baked into the price.
Just as it’s fairly straightforward to pick the winners and losers of most sports contests ahead of time, it is hard to make money betting on this knowledge because of the handicapping process that gives favorites a higher point spread to cover or a lower payout for winning.
While efficient portfolio construction is a topic in itself and we will defer to other articles on this topic – and the process how to back out what the discounted future is – we can say that a well-diversified portfolio is much better than a concentrated one.
This does not mean simply investing in a bunch of stocks or whatever one’s favorite asset class is. Each asset class has its own environmental bias and will perform best in a particular type of setting.
While you don’t know which asset class is going to perform best or worst in the next day, month, year, or decade, you do know that they will act differently. Adding uncorrelated returns streams increases your return per each unit of risk.
Equities do best when growth is above expectation and inflation is low to moderate. Government bonds of reserve currency countries do best in times when growth and inflation are below expectation. Corporate credit is in a similar bucket to equities.
It is commonly said that diversification is famously the only free lunch in finance. This means proper diversification will increase your reward to risk ratio and, when done effectively, without lowering your long-term returns.
The chart below gives an example of what various asset types return on a risk versus reward grid.
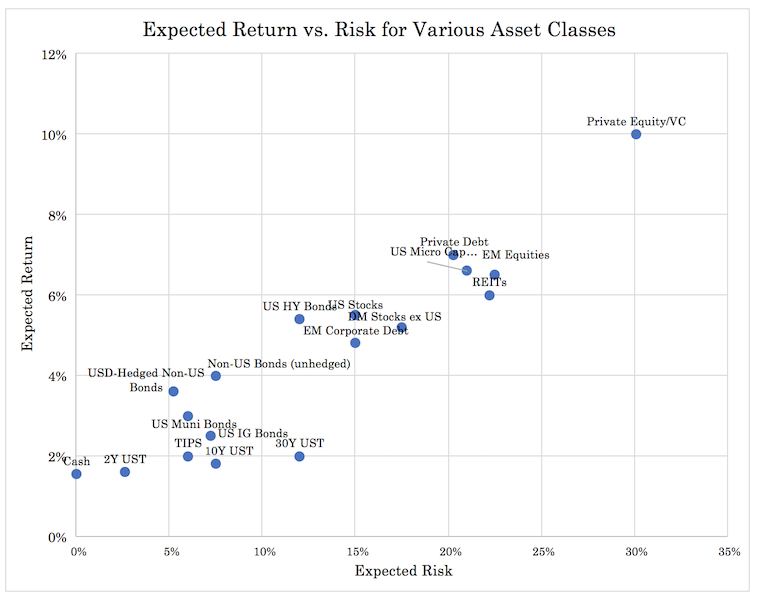
When taking asset class returns as they come at face value, you would see that it’s not very realistic to invest in anything that’s going to give you a very high annualized return going forward.
This is where leverage comes into play. Asset class returns can be made to exhibit the same risk through the use of leverage or leverage-like techniques. This is how a bond can be made competitive with a stock or piece of real estate, for example.
Some think of leverage in entirely binary terms – i.e., “no leverage is good and any leverage is bad” – rather than viewing it as a tool that can help you achieve your goals more efficiently and with genuinely less risk when used appropriately.
A moderately leveraged well diversified portfolio will have a better return to risk ratio than an unleveraged concentrated one. Equities are intrinsically leveraged instruments (companies have debt) and as a whole will have very bad drawdowns when growth expectations turn down and/or interest rates increase more than what’s discounted into the curve. Leverage is simply used to get each asset class to exhibit the same risk.
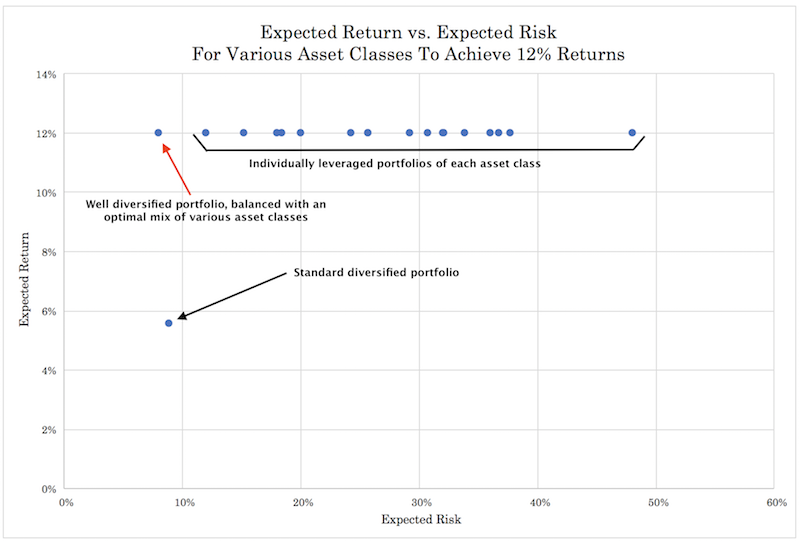
A standard diversified portfolio that balances risk without leverage will need t o overweight bonds relative to stocks because equities are 2x-3x more volatile. Because bonds have lower expected returns, this subtracts from long-run returns. When each asset class exhibits the same risk, you can diversify for all economic environments without the fear of forfeiting returns.
The diagram below illustrates the concept in getting each asset class to exhibit the same return if someone were to theoretically want 12 percent annualized returns. This shows each asset class leveraged individually (higher risk), the standard balanced portfolio (lower risk, but much lower return), and the well diversified, moderately leveraged portfolio:
Achieving your goal
Because this article is simply designed to give an illustrative example, and before we go into even more of a digression of how to build a portfolio, let’s keep it simple and say you’re investing in a portfolio that generates 10 percent per year.
What this portfolio would be is up to your imagination. Some investors like to target real estate investment trusts (REITs) for dividends, though there’s no guarantee of strong dividend payments. Their yields are often in the low double-digits (though they vary significantly) because they are legally obligated to pay out 90 percent of their earnings to retain advantageous tax status. It would ideally be a well diversified balanced portfolio, but each trader and investor has their own way of doing things.
We already did our calculations on how to generate $100,000 above. For this, we would need $281,690 in equity. This means we would need to borrow $845,070. Some brokers may offer this for you if you have a margin account. 4:1 is pretty standard for both intraday and overnight if you are classified as a Pattern Day Trader, otherwise 2:1 is typical for overnight equity holds.
Note, leveraged buy-and-hold strategies are high-risk. You could encounter account liquidation in the event of market corrections, which can and do happen.
How do you get 1.5 percent borrowing rates?
Currencies with 0.5 to 1.5 percent borrowing rates may be able to be found at firms like Interactive Brokers (which supports both individual traders and institutional clients), and includes are the zero-cash rate currencies, such as the Japanese yen (JPY), euro (EUR), and Swiss franc (CHF). US overnight interest rates are still 150-175bps higher and thus the US dollar is more expensive to borrow in (i.e., short sell).
That said, a broker’s margin rates are linked to central bank benchmark interest rates at the time in question, and these can fluctuate and are often higher than 1.5%, so this is just for illustrative purposes.
If you’re buying your assets in these currencies, this is straightforward. However, if you have your assets in one currency and your liabilities (i.e., margin balance) in another currency, you have a potentially dangerous situation. (This is how emerging market countries typically get themselves into trouble. They borrow too much in a foreign currency, and if that currency increases, the size of their liabilities grows and this can turn into a dangerous, self-perpetuating dynamic.)
If you have your portfolio totally or mostly in US dollars (USD) and your margin balance in JPY, if the yen goes up a lot, that’s effectively like having your borrowing rate increase. Another way to think about is that you’re putting on a short yen trade equal to three times your equity size. From a risk perspective, that’s very bad.
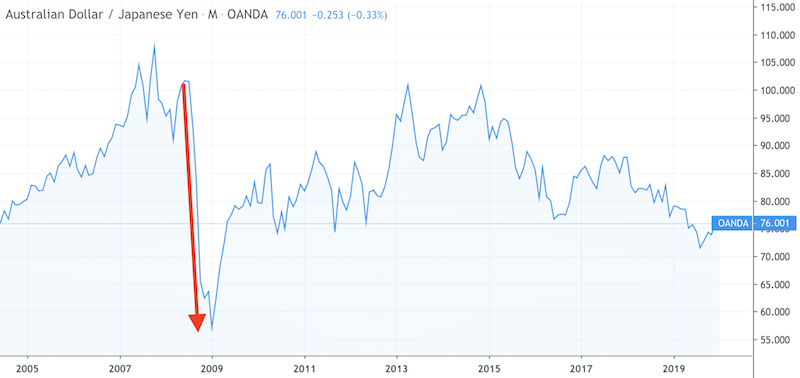
When 2008 happened, because so many traders use yen as a carry currency (short yen because to buy a higher yielding asset), when risk appetite was greatly pulled back, there was a lot of short covering in yen, causing a huge spike in its value.
If we look at a chart of AUD/JPY, we can see preceding the crisis that owning a pro-cyclical commodity currency like AUD against JPY (as the funding currency) made slow steady gains. But when the 2008 dislocation came, all those gains earned in the years leading up to the crisis were literally wiped out in about one week. The AUD lost about half of its value relative to the yen in the span of just 6-12 months altogether.
That’s why many traders consider any type of carry trade as essentially synthetic short gamma positions (i.e., like selling options premium) that has a certain level of upside that’s relatively fixed but a large amount of downside. And said downside is often underappreciated and lackadaisically hedged (if at all) because it’s experienced so infrequently.
Shorting shorter duration debt as a financing vehicle
Shorting Treasury bills is another possibility as your funding vehicle if your base currency is in USD.
In general, shorting shorter duration local currency debt is one method traders use to fund their investments. This could also mean bunds for EUR traders or JGBs for JPY traders. This way you aren’t dealing with the foreign currency issue.
When you borrow with basic cash financing, your broker will charge you much more than the actual rate because they want to make money on the spread. Often this rate is absurd, with the spread being 500bps or more between the cash rate the central bank sets and the rate you borrow at from your broker. With IBKR, it’s anywhere from 50-150bps depending on how much you borrow and the currency. But that’s still a spread you’d like to eliminate if possible.
Shorting short-term Treasury bills is one solution. But unfortunately, it’s not one that’s viable for many. On IBKR, to short Treasury bills, there is a minimum face value amount of $10 million. For any amount higher, it goes in additional increments of $1 million. Brokers institute these rules to make you borrow at their rates, not the rates you could do so using this method.
The margin requirements on this are 1 percent, or 100x, meaning a $10 million short of T-bills requires $100,000 in margin.
That would raise your cash balance in your brokerage account by $10 million.
You’d then have that $10 million in liquidity to invest into cash bonds, cash equities, and anything else that gives you a higher yield. The annual cost in interest would be $150,000 given a current rate of about 1.5 percent.
This financing cost would be locked in until the bond matures. The longer the duration of the bond, the longer it’ll be locked in, but the duration risk would be higher. In other words, the bond that you short will have more price movement associated with it. However, if you’re using this funding tactic, you’d be taking this borrowed money to invest in other securities that have duration. So, the swings in its price would probably not be a big issue. Longer duration funding vehicles also have higher margin requirements associated with them.
But given the high barrier to entry to doing this, you’d want to make a lot more money per year than what we’re shooting for in our example.
How do you hedge foreign currency?
Some traders like to hedge short currency positions by spreading their bets.
For example, some traders, if they want to fund a carry trade, will spread it out among various funding currencies – e.g., JPY, EUR, CHF, and any others that are liquid and available.
That way, you’re less susceptible to a spike against you in any given one.
Nonetheless, this is still very risky. So, some traders will buy gold.
Gold has a positive correlation to JPY, EUR, and CHF. Over time, it’s approximated a positive correlation of +0.20 to +0.40 for each currency on a scale from -1.00 to +1.00.
However, correlations can and will breakdown. It’s very feasible that you can own gold and all will go down simultaneously. Gold itself is volatile and has its own set of risks.
Some will buy call options in the currency they’re borrowing in. That way, if the currency goes up and it runs above the strike price, you’re covered.
However, this represents a material cost. Even with G-7 FX volatility at an all-time low as of early-2020, hedging one year’s worth of JPY (and similar currencies) through FX futures options costs 340bps. If you’re borrowing at 150bps, your total borrowing cost is now effectively 4.9 percent. It’s cost prohibitive to go that route.
The only surefire way to avoid this risk, and to do it in a reasonably cost-effective way, is to:
a) borrow in your own currency, or
b) borrow in a foreign currency and hedge it back into domestic currency
A common way to hedge foreign currency risk is through a cross currency basis swap, though it’s largely only available to institutional traders. Another way is through the futures market.
The futures market has its own set of issues because of what’s known an interest rate parity.
This means that currencies with lower interest rates are expected to trade at a higher exchange rate in the future. The market may anticipate a change in this relationship in the future, such as when one central bank eases relative to another, causing the slope of the curve to change.
JPY, EUR, and CHF are all in contango (upward-sloping futures curve) against the USD given they have lower cash interest rates.
The interest rate parity formula is as follows:
F = S * (1 + domestic interest rate) / (1 + foreign interest rate)
F = forward exchange rate
Example
If we compare the US and Germany, where the forward 1-year interest rates are 1.79 percent and minus-0.82 percent, respectively, and plug this into the interest rate parity formula:
F = 1.108 (1 + 0.0179) / (1 + -0.0082) = 1.137
What does this mean?
It means that if you short euros to fund your trade at 1.5 percent, then lock in a currency hedge one year forward, the cost of this hedge is the difference between the forward rate (1.137) and the spot rate (1.108), which is 2.61 percent (1.137 divided by 1.108 minus 1). This means your effective interest rate in this case is 4.11 percent, adding the 2.61 percent to the 1.50 percent you’re borrowing by shorting euros. That’s even worse than simply borrowing in your domestic currency at the cash rate plus 150bps.
Hedging via a cross currency swap is the best way to hedge currency liabilities. Most traders should, however, in terms of what’s most practical, hedge in their domestic currency to avoid a potential dangerous scenario from developing if their liabilities – leveraged to many times their equity – increase in value relative to their assets.
To generate the returns we want with a 10 percent return expectation, we needed $281,690 in equity and borrowed $845,070, which gives us a notional amount invested of $1,126,760, adding the two together.
You pay 1.5 percent on the $845,070, which will cost $12,676. Ten percent return on the $1,126,760 is $112,676 (the amount you “want” to make, or your income before expenses). Subtracting the two would leave a net income of $100,000.
If you save $6,000 per month, it would take 47 months or slightly less than four years, to build up this equity base to generate this type of annual income. If your goal is $50,000, then it would take about two years.
Conclusion
This article presents a stylized example of how you can begin generating $100,000 from the market within four years.
The process involves backing out what kind of numbers you need to make this work:
– What amount of your own capital do you need to achieve your goal?
– If this amount is currently insufficient, how much do you need to save in order to get to this amount? How long would it take you to save this amount?
– What will be the return on your investments?
– What will you invest in? Preferably you will adopt some type of strategic asset allocation mix that will improve your return to risk by having balance in the portfolio rather than having extreme environmental bias like in most portfolios.
– Can you use leverage? What amount will you use and what will be your borrowing rate? Remember that although leverage can be dangerous, if used appropriately and at cheap rates, it can actually reduce your risk and help you achieve your goals more efficiently than otherwise.
It’s important to develop goals, use reasonable assumptions, and establish a plan to execute it. Write them out and use spreadsheets to plot example numbers and projections.
If you do, you’re more likely to follow through and keep track of your progress along the way.