Safely Make $50,000 Per Year From One Stock? Exploring the Collar Option Strategy


Who doesn’t want to invest in the stock market and make a “full” passive income?
Everyone in the markets, from individual traders and investors to institutional funds, has the goal of generating income with the least risk.
For the sake of this article, we’ll assume a “full” income of $50,000 per year. We’ll also assume that this comes from one stock.
This is done out of simplicity, not because it’s necessarily prudent to do. Having multiple uncorrelated income streams, and diversification across asset classes, across countries, and across currencies is a wise thing to do.
In the markets the range of unknowns is high relative to the the range of knowns relative to what’s discounted in the price. You can never be too sure about any given trade or investment.
Diversification is not “for idiots”. When done well, it will improve one’s reward per unit of risk more than practically anything else you can do. It’s not practical for the average trader to win in the markets going off “hot tips”.
But to keep things simple and for illustrative purposes, we’ll use one stock.
How much money would it take and how do you do it by limiting your risk, and without relying on capital gains?
Let’s take a look.
Best fits for the collar option strategy: Companies with stable earnings and quality margins
Many consider dividend-paying stocks when looking at what to buy for the long-term.
A company that pays regular dividends (usually dispersed quarterly and in some cases monthly) is essentially saying that a portion of its earnings is guaranteed.
However, if a company is experiencing issues, the dividend is often one of the first things that is cut, partially or fully, in order to conserve cash.
If a company cuts its dividend, that usually punishes the stock harshly. So, not only is the dividend cut or gone, but capital losses on top of that.
What really matters is economic earnings, which is paid out in the forms of dividends, distributions, and/or capital gains (i.e., stock price increases).
The higher the earnings and the more stable, the better.
This is especially important in a zero interest rate environment. The ability to offset downward shocks in earnings is no longer there.
This makes stability in earnings even more important. These are likely to come from things like consumer staples and utilities.
Building a balanced stock portfolio is done well by finding the right mix of stable earnings growers, tech (for growth), and stocks across the size spectrum. Like different asset classes, certain types of stocks do better in some environments relative to others. Blending them well will improve returns relative to risk and help smooth out the bumps.
We showed in a previous article how this can be accomplished and provide somewhat of an edge over a standard market index like the S&P 500.
In this case, we’re going to use the example of a single stock. All of the numbers below are modeled off the shares of a real-life company (US tobacco company with a market cap of just under $100 billion, with around $20 billion per year in revenue).
It fits the general requirement of being a consumer staple and having pretty stable earnings while also paying a dividend that is typically covered by its earnings.
For purposes of this article, the name of the stock is “ABC” to avoid the idea that this article is an implicit recommendation of the company off which it’s based.
More important is the concept of the collar option strategy we’ll cover, not specific security selection.
Reverse engineering how much capital you need
We’ve selected a baseline of $50,000 per year. That comes to $4,167 per month or $12,500 per quarter.
Dividends are paid quarterly. ABC earns enough to pay its dividend plus a little bit leftover. It currently pays $3.36 in dividends per share per year, or $0.84 per quarter.
Investors can choose to receive this dividend in the form of share re-investments (commonly called DRIP, short for dividend re-investment plan) or cash dispensations. Those looking to grow their portfolio will normally choose the former while those looking to use it for income will choose the latter.
So, it’s a simple calculation in terms of how many shares to purchases. $50,000 per year divided by $3.36 in per-share annual dividends.
Number of shares = $50,000 / $3.36 = 14,881
To round to the nearest hundred, we can round to 14,900 shares.
Then it comes down to the price per share. As of now, ABC can be purchased for around $40 per share. Multiplied by 14,900 shares, that’s $596,000.
These particular numbers can be done for If someone is looking for a passive income of $1,000 per month, for example, then they would need to buy 24 percent of that amount (or $143,060).
Margin requirements
For those in regular margin accounts beyond a certain amount of money ($25k in US accounts), you can typically borrow up to around 4:1. That is, for every $1 put up in equity, the trader can borrow up to $3.
Those in portfolio margin accounts can usually borrow a bit more, sometimes 6:1 or more. The actual amount is subject to a formula based on risk concentrations, known as the OCC TIMS methodology.
If we take that 4:1, then a $596k cost for ABC would require $149k in account equity.
Borrowing costs
The cost of borrowing would represent the borrowed amount ($596k minus $149k, or $447k) multiplied by its cost. At some brokers, borrowing can be cost prohibitive.
But at a broker like Interactive, with a 1.5 percent borrowing cost in all the major currencies as this is being written (and down to just 0.5 percent depending on the amount being borrowed), this comes to a reasonable $4,970.
The first $100k is borrowed at 1.5 percent, with the remaining $347k borrowed at 1.0 percent.
That would reduce one’s annual returns from dividends to just over $45k.
Other ways to buy in
Let’s say the current price of the stock is too expensive and you want to buy it cheaper.
In this case, you can sell put options at the strike price where you’re willing to buy in.
These should be cash covered, meaning whatever amount of stock you’re willing to buy at that price (100 shares per contract), you should have available in cash or cash-like securities (e.g., short-term government bonds) in your account.
This prevents cash flow issues should the stock decline relative to the strike price or below it. If cash flow isn’t managed well, you can get squeezed out of the position.
Let’s say you want a $35 stock instead, so you sell 35 puts of a certain maturity.
There are 100 shares per contract, so that’s 149 contracts. Based on a four-month expiry of this particular stock, they cost around $88 per contract (or $0.88 per share).
That’s $88 multiplied by 149 for about $13k in premium, including expected commissions costs.
The amount of dividend foregone waiting on a cheaper stock is just under $17k (i.e., the $50k divided by three, given the four-month maturity). That’s close to $4k net in terms of the opportunity cost for the chance at picking up a cheaper stock price.
Risk management
This is a trade made with borrowed money, so there needs to be prudent risk management.
First, every portfolio should have a certain amount of cash. All portfolios go through drawdowns, so it’s important to have a buffer to avoid cash flow issues.
Buying put options can protect you from this.
Buying put options 25 percent OTM would protect your downside to the size of your full equity position (since you bought on 4:1 margin).
That prevents the trade from having a negative net worth, in effect. Real estate and private equity transactions are notorious for having negative net worths when things go awry, given the amount of the asset typically bought on leverage.
Something bought on 4:1 leverage needs just more than a 25 percent drawdown to have a negative equity position (20 percent for 5:1, ~17 percent for 6:1, and so on).
A 30 put option would protect 25 percent downside from $40 per share.
For an option six months out, this costs $44 per contract, including commissions. That total cost is $6,600.
For the entire year, when doing this again in another six months, this comes to a projected $13,200. That means your net income would be down to around $37k.
That’s a lot to pay for insurance.
So…
How can you help offset this expense?
Through covered calls.
The covered call involves selling call options while owning the underlying shares.
Owning 14,900 of the underlying stock can help sell 149 call option contracts. By doing this, we effectively cap our upside.
Our upside is extra income and also helping offset any capital losses to a degree.
Call options are generally cheaper in the equity markets than put options. This is because most people are net bullish on the market and use put options to hedge their long equity exposure.
Accordingly, there is typically more demand for puts than call options.
This is represented graphically in the “volatility smirk” (a subset of volatility skew), where further out-of-the-money (OTM) puts trade at higher implied volatilities (IV).
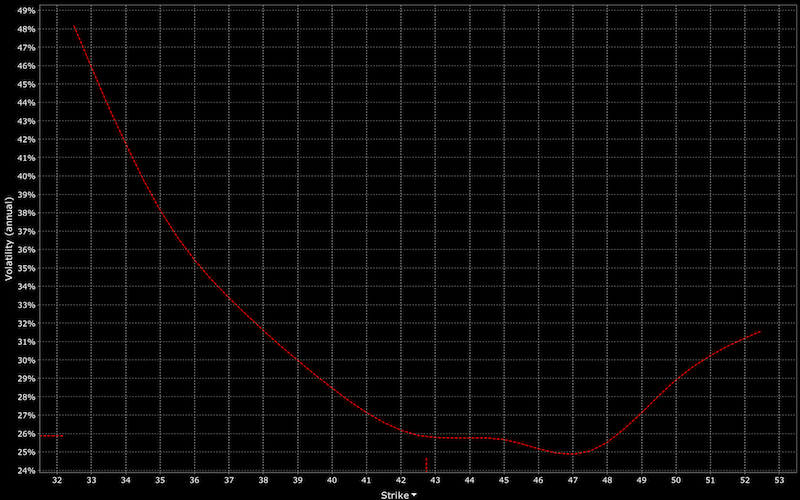
(Source: Interactive Brokers Implied Volatility Viewer)
As a result, oftentimes you may not be likely to offset your put option premium by selling covered calls, assuming relative OTM distance is comparable and adjusting for maturity.
In this case, we could buy 50 calls (20 percent OTM).
If we buy them four months out, we can multiply that premium by three to get some idea of the annualized return. (It won’t be perfect, but when making predictions about business outcomes, some reasonable assumptions and projections have to be made.)
These currently sell for around $30 per contract ($0.30 per share) on a four-month maturity, including commissions.
For 149 contracts, that’s $4,470. To annualize that amount, it’s around $13,410.
Adding that back to your net $37k, gets you back to around your $50k income requirement. Subtracting out borrowing fees, then about $45k.
Some or all of your investment may get called if options land in-the-money (ITM). This can happen for any reason, but on the call option side it’s most common when the upcoming dividend is higher than the premium paid.
In such a case it makes sense to take control of the underlying asset in order to take the dividend.
The trade-off of a long put/short call strategy while owning the underlying – called a collar or a bull call spread – is that your limited downside (at least in terms of capital losses) comes with offsetting capped upside.
Some prefer trade structures where the upside is unlimited, giving them the chance for outsized gains.
However, with an investment in a consumer staple with limited market growth, having big upside probably isn’t likely. Some will bet on it – everything is a probability – so that can make a market for selling covered calls when appropriate.
Diagrammatically, this is how the collar / bull call spread appears. It is also known as split strike conversion.
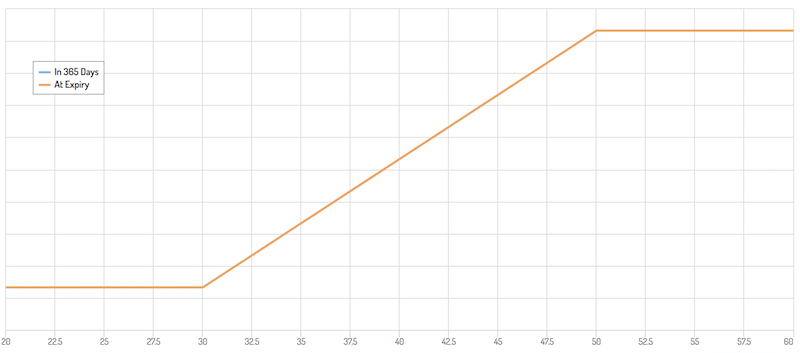
(Source: optioncreator.com)
The collar option strategy is beneficial in that the trader/investor knows the potential losses and gains from the outset of the trade.
They know they can gain up to a certain amount – i.e., the dividend plus any capital gains up to the call option strike (up to maturity).
They also have a fixed amount of downside in terms of capital losses.
If the stock runs higher, the profits may max out being short the calls. Traders can choose to cover their entire position with call options or only partially to potentially participate in some additional upside.
If the stock moves lower, the trader can protect some of the losses due to being long puts.
Multiple maturities can also be used for the long puts and short calls, which can adjust the risk and reward in piece-wise fashion.
Conclusion
This article provides one example of how to generate a full-time income from a single investment.
This is not a recommended investment strategy. It is simply to illustrate what is possible.
Diversifying well is going to improve your return per unit of risk better than practically any long-term strategy. Injudicious use of leverage is dangerous. The same goes for investing or trading money you can’t afford to lose.
Due diligence on any prospective trade or investment is imperative beforehand and throughout the holding period.
The collar is a common investment strategy that is well-known to those who are involved in options trading.
It involves owning the underlying stock while buying a put option (to protect downside) while selling a call option to fund some (or all) of the downside protection.
The idea is to help reduce volatility and reduce downside risk, while providing more consistent returns.
This comes at the cost or trade-off of limiting your upside. It will also not protect against the loss of the dividend or distributions that one may expect from the investment. Options are also inherently less liquid markets than the underlying stock.
Some traders will also place collars on their positions after a certain amount of gains have been accrued.
Collars are a more advanced trading and investing strategy and should ideally be used by more experienced traders.