Network Theory & Percolation in Finance & Trading


Network theory and percolation models offer a lens through which we can understand various phenomena in finance and trading.
These concepts, derived from mathematics and physics, provide quantitative frameworks for the interconnectedness and vulnerabilities within financial markets.
Below, we look into the key concepts, applications, and how traders can leverage network theory and percolation in their strategies.
The math behind network theory and percolation draws on graph theory, linear/matrix algebra, probability theory, group theory, stochastic processes, and statistical mechanics to study real-world complex networks.
The focus is on the topology and patterns that emerge from local node interactions.
Key Takeaways – Network Theory & Percolation in Finance & Trading
- Interconnectedness Analysis
- Network theory in finance highlights the interconnectedness of financial institutions and markets.
- Traders should be aware that assets aren’t isolated.
- The failure or success of one can rapidly affect others, akin to the domino effect in networked systems.
- Systemic Risk Identification
- Percolation theory helps identify thresholds at which localized financial distress can escalate into systemic crises.
- Understanding these tipping points enables traders to better assess and reduce systemic risks in their portfolios.
- Portfolio Diversification Strategy
- By analyzing the network structure of financial markets, traders can design better diversification strategies that account for hidden correlations and the potential for contagion (and improve portfolio resilience against market shocks).
Key Concepts in Network Theory
Network theory focuses on the study of graphs as representations of relationships and interactions in a complex system.
In finance, networks can represent various entities (such as individuals, institutions, markets, or countries) and the connections between them (such as financial transactions, dependencies, or correlations).
Nodes
Nodes represent entities in the network, such as banks, financial institutions, assets, or markets.
Edges
Edges represent the connections or relationships between these entities, such as loans, ownership, or trading relationships.
Centrality Measures
Centrality measures assess the importance of a node within the network, which can be indicative of systemic risk or influence.
Clustering Coefficient
The clustering coefficient measures the degree to which nodes in a network tend to cluster together.
This highlights potential market segmentation or concentration risks.
Percolation Theory
Percolation theory is a mathematical framework used to study the behavior of connected clusters in a random graph.
In finance, it can model the spread of information, crises, or defaults through a network.
It examines how small changes can lead to widespread effects due to the interconnectedness of the system.
Threshold Models
Threshold models are used in percolation theory to determine the critical point at which a small local shock can propagate through the network, and potentially leading to systemic failures.
Cascade Models
Cascade models describe how failures (or information) cascade through the network, identifying paths of contagion and points of vulnerability.
Math in Percolation Theory
Math involves studying connectivity in random graphs using:
- Stochastic processes and cascades
- Scaling laws and critical exponents
- Universality and renormalization group theory
Network Theory & Percolation Applications in Finance & Trading
Systemic Risk Assessment
By analyzing the financial network’s structure, regulators and participants can identify systemic risks and vulnerabilities.
Nodes with high centrality might be too interconnected, posing risks of contagion if they fail.
Portfolio Diversification
Network theory can help traders/investors better understand the interconnectedness of assets in their portfolio.
It allows for better diversification by identifying assets less likely to be affected by the same systemic shocks.
Crisis Prediction and Management
Percolation models can simulate how shocks propagate through financial networks, helping in predicting crises and developing strategies to mitigate their impact.
Market Structure Analysis
Understanding the network structure of markets can reveal information flow patterns, market segmentation, or concentration risks.
Network Theory & Percolation in the 2007-08 Financial Crisis
The 2007-08 financial crisis is a compelling case study for the application of network theory and percolation.
During this period, financial institutions were highly leveraged and interconnected, and some had excessive exposure to complex instruments like mortgage-backed securities and derivatives.
Network theory explained how these connections facilitated the rapid spread of distress from the subprime mortgage sector (i.e., too much concentrated debt and not enough income or new funding to service it) to global financial markets.
This demonstrated the systemic risk posed by tightly knit financial networks.
Percolation theory helps understand how the failure of key institutions (nodes) led to a cascading effect and severely impaired the network’s stability.
The crisis underscored the importance of understanding network structures and the “percolation threshold” – i.e., the point beyond which localized failures can risk or lead to widespread systemic collapse.
This event highlighted the need for better financial network analyses to predict and hopefully prevent the effects of such crises in the future.
How Traders Can Use Network Theory & Percolation
Identifying Correlation and Contagion Risks
Traders can use network analysis to identify assets or sectors that might be affected by contagion – and hence have their risks underestimated.
This allows them to hedge or adjust their positions accordingly.
Strategic Trade Placement
By understanding the network’s structure, traders can anticipate potential market movements based on the placement and influence of significant nodes and edges.
Liquidity Analysis
Network models can help traders understand liquidity dynamics in the market – i.e., identifying potential liquidity bottlenecks or opportunities for arbitrage.
Event-Driven Strategies
Using percolation theory, traders can model the likely impact of specific events (e.g., defaults, policy changes) on the market and adjust their strategies to exploit anticipated movements.
Coding Example – Network Theory & Percolation
Let’s do some Python code (with the help of the networkx Python library) to show the application of network theory and percolation in a synthetic financial network.
Here’s a brief overview of the steps and the initial observation:
Network Creation
A synthetic network of financial entities (like stocks, sectors, or banks) is generated using the Erdos-Renyi model.
Nodes represent entities and edges symbolize financial relationships.
Attribute Assignment
Random weights are assigned to:
- nodes (representing market importance) and
- edges (indicating the strength of financial relationships)
Network Visualization
The network is then visualized.
Showcases nodes and edges with varying sizes and widths proportional to their assigned importance and relationship strength.
Largest Connected Component
Initially, the size of the largest connected component is identified. (This represents the robustness of the market network.)
In this case, before any node removal, the largest connected component includes 29 out of 30 nodes, indicating high connectivity and potential robustness against isolated failures.
import networkx as nx
import matplotlib.pyplot as plt
import numpy as np

# Create synthetic financial network
# Nodes represent financial entities (e.g., stocks, sectors, banks)
# Edges represent financial relationships (e.g., ownership, correlation, lending)

G = nx.erdos_renyi_graph(30, 0.15)

# Assign random weights to nodes to represent their size or importance in the market
for node in G.nodes:
    G.nodes[node]['size'] = np.random.randint(50, 1000)

# Assign random weights to edges to represent the strength of financial relationships
for edge in G.edges:
    G.edges[edge]['weight'] = np.random.uniform(0.1, 1)

# Visualize the network
plt.figure(figsize=(12, 8))
pos = nx.spring_layout(G) # positions for all nodes

# Draw nodes with sizes proportional to their market importance
node_sizes = [G.nodes[node]['size'] for node in G.nodes]
nx.draw_networkx_nodes(G, pos, node_size=node_sizes, node_color="skyblue", alpha=0.6)

# Draw edges with widths proportional to the strength of financial relationships
edge_widths = [G.edges[edge]['weight'] for edge in G.edges]
nx.draw_networkx_edges(G, pos, width=edge_widths, alpha=0.4)

plt.title("Synthetic Financial Network")
plt.axis('off')
plt.show()

# Identify the largest connected component as a measure of market robustness
largest_cc = max(nx.connected_components(G), key=len)
print(f"Size of the largest connected component: {len(largest_cc)} / {G.number_of_nodes()}")

# Perform a basic percolation by progressively removing nodes and observing the effect on the network's connectivity
removed_nodes = 0
while len(largest_cc) > 1 and removed_nodes < len(G.nodes):
    # Randomly remove a node
    node_to_remove = np.random.choice(list(G.nodes))
    G.remove_node(node_to_remove)
    removed_nodes += 1

    # Recalculate the largest connected component
    if nx.is_connected(G):
        largest_cc = max(nx.connected_components(G), key=len)
    else:
        break # Stop if the network becomes disconnected

print(f"After removing {removed_nodes} nodes, size of the largest connected component: {len(largest_cc)} / {G.number_of_nodes()}")
The image generated from this code is below (shows one node separate from the rest):
Synthetic Financial Network
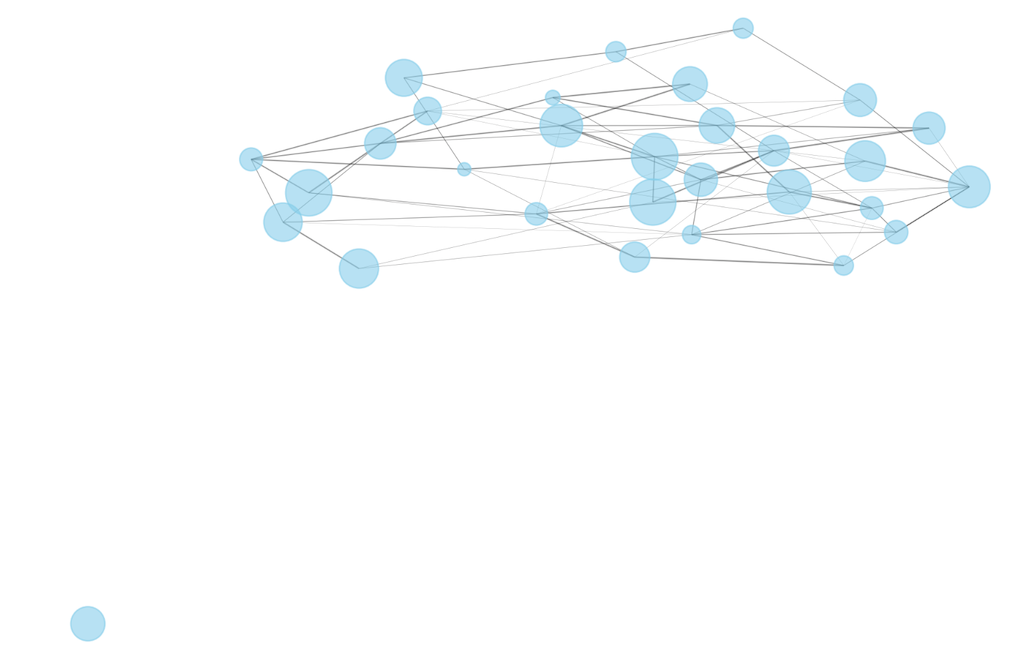
This setup provides a foundation for exploring how percolation (i.e., the progressive removal of nodes) affects network connectivity, which is an important aspect in understanding systemic risk and the spread of financial crises in interconnected markets.
If we did a percolation analysis, this would involve observing how the removal of nodes (simulating entity failures) impacts the overall connectivity and stability of the financial network.
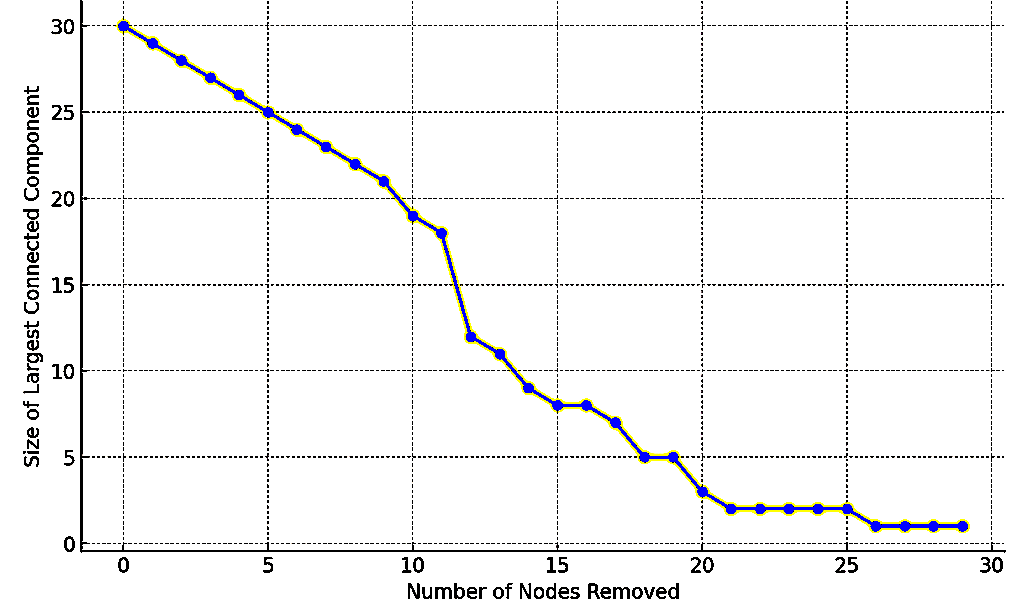
Coding Example – Percolation Analysis
The code performs a percolation analysis on a synthetic financial network.
Here’s a summary of the process + findings:
Network Re-initialization
A new Erdos-Renyi network is generated to simulate a financial network with random connections between entities.
Percolation Process
Nodes are randomly removed one at a time to simulate the failure or removal of financial entities from the network.
After each removal, the size of the largest connected component (indicative of the largest group of interconnected entities) is recorded.
Analysis Results
The plot we generate shows how the size of the largest connected component decreases as more nodes are removed.
Initially, the network is robust with a large connected component.
But as nodes are removed, the network’s connectivity deteriorates, which demonstrates the percolation effect.
# Continued from previous setup for percolation analysis
G = nx.erdos_renyi_graph(30, 0.15)
for node in G.nodes:
    G.nodes[node]['size'] = np.random.randint(50, 1000)

# Track the size of the largest connected component as nodes are removed
sizes_of_largest_component = [len(max(nx.connected_components(G), key=len))]

# Randomly remove nodes one by one and track the size of the largest connected component
np.random.seed(29)
nodes_to_remove = np.random.permutation(G.nodes())
for node in nodes_to_remove:
    G.remove_node(node)
    if len(G) == 0: # If all nodes are removed, stop
        break
    largest_cc_size = len(max(nx.connected_components(G), key=len))
    sizes_of_largest_component.append(largest_cc_size)

# Plot results of percolation analysis
plt.figure(figsize=(10, 6))
plt.plot(sizes_of_largest_component, marker='o', linestyle='-', color='b')
plt.title('Percolation Analysis in Financial Network')
plt.xlabel('Number of Nodes Removed')
plt.ylabel('Size of Largest Connected Component')
plt.grid(True)
plt.show()
The plot is shown below:
Percolation Effect in a Financial Network
Summary
This analysis helps in understanding the resilience of financial networks to shocks.
The critical point at which the network disintegrates (shown by a steep decline in the size of the largest connected component) can be considered a threshold for systemic risk, beyond which the network (or market) may no longer function effectively.
Conclusion
Network theory and percolation models are a way to understand and navigate the interdependencies of financial markets – mostly with respect to the entities operating within them.
By leveraging these concepts, traders and investors can gain insights into systemic risks, correlation patterns, and overall market dynamics, which can help with better decision-making and strategic positioning.
Nonetheless, these models, while insightful when done well, are simplifications of reality and should be used in conjunction with other analysis tools and market knowledge.