Dip and Rip Pattern


The Dip and Rip pattern is a common trading strategy used by traders to identify potential buy opportunities in the stock market.
It’s especially popular among day traders and those involved in momentum trading.
This pattern is characterized by a significant price dip shortly after the market opens, followed by a strong reversal and upward price movement (the “rip”).
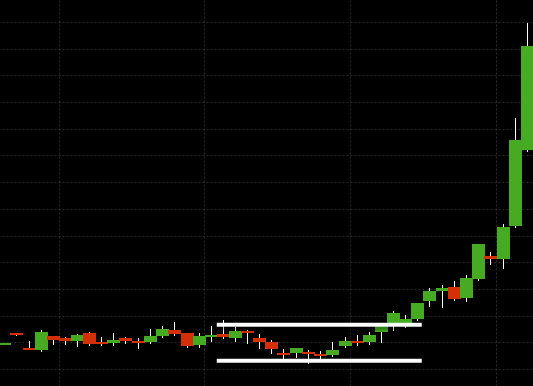
The initial dip often results from overnight or early morning selling pressure, leading to an overreaction that drives the price down.
The subsequent rip occurs as buyers step in, recognizing the oversold condition and pushing the price higher, often surpassing the initial opening price.
Key Characteristics of the Dip and Rip Pattern
- Initial Dip – Typically occurs in the first minutes to hours after the market opens, driven by sell-offs that might be reactions to overnight news, market conditions, or simply the culmination of pending sell orders.
- Reversal Point – This is where the pattern pivots; the price finds support, and selling pressure begins to wane. This level is important for traders, as entering trades near the reversal point can maximize potential gains while minimizing risks.
- Sharp Price Increase (Rip) – Following the reversal, there’s a sharp increase in price. This is often fueled by a combination of short covering, momentum buyers jumping in, and the initial sellers taking profits or cutting losses. It can also be in response to basic volume (e.g., slow markets in off hours “waking up”) or in response to news.
Trading the Dip and Rip Pattern
- Identification – Traders need to quickly identify the pattern as it develops, often using technical indicators such as volume/order flow, RSI (Relative Strength Index), and moving averages to ascertain the strength of the reversal. Sophisticated institutional traders will use metrics like book skew, liquidity models, and other strategies.
- Entry Point – The ideal entry point is as close to the reversal point as possible, after signs of the dip stabilizing and the beginning of the upward movement.
- Stop-Loss Orders – Setting a stop-loss just below the reversal point can help manage risk, protecting against the possibility of the dip continuing lower than anticipated.
- Profit Targets – Traders often set profit targets based on previous resistance levels, Fibonacci retracement levels, or a predetermined risk-reward ratio.
Risks and Considerations
While the Dip and Rip pattern can offer significant profit opportunities, it comes with risks.
False reversals can lead to losses, and rapid price movements require quick decision-making and execution.
Moreover, the pattern’s effectiveness can be influenced by broader market conditions, news events, and individual stock fundamentals.
Quantitative Analysis
Quantitative traders might develop algorithms to automatically detect and trade on the Dip and Rip pattern.
They might use historical data and/or synthetic forward simulation data to optimize entry, exit, and risk management parameters.
This could involve machine learning models trained on price, volume, and indicator data to predict the likelihood of a successful Dip and Rip occurrence.
FAQs – Dip and Rip Pattern
What causes the initial dip in the Dip and Rip pattern?
The initial dip is often caused by overnight news, early morning sell-offs, or accumulated sell orders that get executed at the market open.
It can be an overreaction from the market, setting the stage for a reversal if the fundamental value of the asset hasn’t changed.
How can a trader identify the reversal point in this pattern?
Traders can identify the reversal point by looking for signs of stabilization in the price after the initial dip.
This may include an increase in buying volume, price moving above key technical indicators like moving averages, or the formation of candlestick patterns indicating a reversal, such as hammers or dojis.
Can you use volume in confirming the Dip and Rip pattern?
Volume is a crucial confirmation signal in the Dip and Rip pattern. An increase in volume during the rip (upward movement) compared to the dip signals strong buying interest and supports the validity of the pattern.
High volume during the reversal and continuation phases indicates stronger conviction among traders, making the pattern more reliable.
How do traders determine the optimal entry and exit points when trading the Dip and Rip pattern?
The optimal entry point is as the price starts to reverse and move upwards after the dip, ideally after confirmation through volume or candlestick patterns.
Exit points or profit targets are often set based on previous resistance levels, a specific risk-reward ratio, or using technical indicators like Fibonacci retracement levels.
Stop-loss orders are placed just below the reversal point to minimize potential losses.
What are some common mistakes traders make when trading the Dip and Rip pattern?
Common mistakes include entering the trade too early before the reversal is confirmed, failing to set a stop-loss order, and holding onto the position for too long, expecting more profit even when reversal signals suggest exiting.
Another mistake is not accounting for broader market conditions or news that can affect the stock’s price action.
Can quantitative models be used to trade the Dip and Rip pattern?
Yes, quantitative models can be developed to trade the Dip and Rip pattern by using historical price and volume data to identify characteristic patterns of dips and rips.
Machine learning algorithms can be trained to predict the probability of a successful pattern based on these features, optimizing entry, exit, and risk management strategies.
Is the Dip and Rip pattern only applicable to stocks?
While the Dip and Rip pattern is most commonly associated with stock trading, it can theoretically be applied to any tradable financial instrument with sufficient liquidity and volatility, including cryptocurrencies, currencies, and futures.
The key is the asset’s ability to exhibit sharp price movements followed by a strong reversal.
Conclusion
The Dip and Rip pattern is a dynamic and potentially profitable trading strategy that requires careful analysis, swift decision-making, and disciplined risk management to successfully navigate and exploit.