Fibonacci


Named after 13th century mathematician Leonardo Fibonacci, the Fibonacci Theory consists of a sequence of numbers. Every number in the sequence (0, 1,1,2,3,5,8,13,21 etc) is obtained by adding up the two preceding numbers. Traders derive technical indicators from this sequence, through various mathematical artifices.
The Best Brokers For Trading With Fibonacci Strategies

No one knows why Fibonacci-derived technical indicators work, but they do seem to work. This bears repeating, because the actual science behind this theory does not really exist…
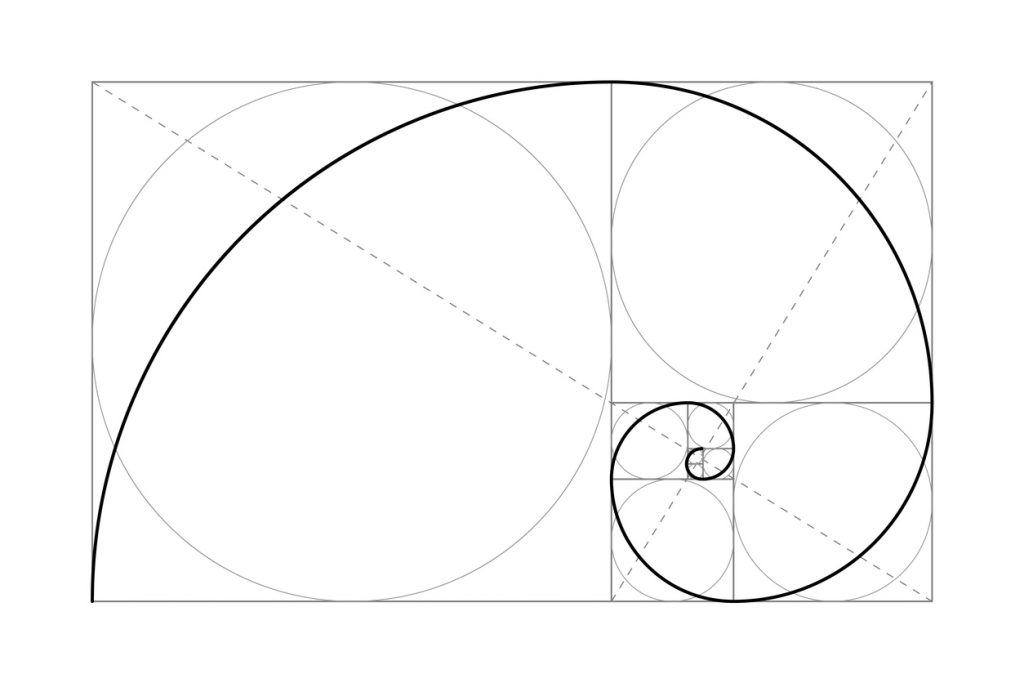
The Golden Ratio
The significance of this number-sequence extends beyond its apparently self-generating nature.
If you divide any Fibonacci number with the one that precedes it in the sequence, you get approximately 1.618 – the Golden Ratio. The first few numbers in the sequence are exempt from this rule.
One can obtain several other such ratios by dividing numbers from the sequence with numbers other than the one preceding them. Fibonacci ratios also used in technical analysis are: 0.236, 0.382, 0.618, 1.618, 2.618 etc.
The golden ratio of 1.618 is not just a mathematical artifice. It is a number present all over nature. From the petals of flowers to the veins in the leaves, it is quite ubiquitous.
Fibonacci Retracement Levels
Retracement levels and Fibonacci extensions represent some of the most popular uses of the theory for technical analysis.
The significant levels are: 23.6%, 38.2%, 50%, 61.8%, 78.6%, 100% etc. Horizontal lines drawn at these price levels act as support/resistance levels for price action.
How do you calculate these Fibonacci retracement levels?
To do it, you need two price points: usually a swing high and a swing low. Technical analysis platforms such as MT4 and Tradingview will automatically calculate the retracement levels for users. All one has to do is to click on the swing high and drag the cursor to the swing low.
If lacking such a platform, you can still calculate the levels using a simple formula. Let us consider the following example: your price rises from $10 to $20. $10 is thus your swing low, while $20 is your swing high.
Your 23.6% retracement level is located at: $20-($10×0.236) = $17.64. Your 38.2% level on the other hand is at: $20-($10×0.382) = $16.18.
How do you use these levels once you have them set?
The retracement levels tend to act as support levels as long as the price is above them. If the price drops, it will likely bounce off these levels. Once it breaks through them however, they become resistance levels for a subsequent upwards move.
Fibonacci Extensions
Unlike retracement levels, Fibonacci extensions predict where a strong price wave may end up.
Technical analysis platforms, which support a Fibonacci extension tool, will generate extensions automatically.
As mentioned, by dividing a number in the sequence with a previous number, one will get the golden ratio. By dividing it with a number that is two places to the left in the sequence, one will get an extension ratio. This can be expanded to divisions with numbers three and four places to the left etc.
Unlike the retracement levels, extension levels require three price points: a swing high, a swing low and a point in-between. This third price point is the pullback.
Other Fibonacci Theory-based Indicators
In addition to the above, technical analysis uses the Fibonacci theory in a number of different ways.
– Fibonacci Time Zones
– Fibonacci Arcs
– Fibonacci Fans
The Time Zones depict various points in the future, where major price swings can occur.
Fans are also areas of support/resistance. Unlike the retracement levels, these lines are diagonal.
Fibonacci Arcs are half circles, which also depict areas of likely price support and resistance.