Coefficient of Variation


What Is the Coefficient of Variation (CV)?
The coefficient of variation (often abbreviated CV or COV) is a statistical measure of the dispersion of data points around the mean. It is calculated as the ratio of the standard deviation to the mean, and can be expressed as a percentage.
In finance, CV is important as it allows investors to determine how much volatility, a component of risk, is taken on relative to the amount of return expected from investments.
The lower the ratio of the standard deviation to mean return, the better the return relative to the risk.
The CV is used to compare different data sets that may have different means and standard deviations.
For example, two data sets may have different means but similar standard deviations, in which case the CV would be higher for the data set with the smaller mean.
The CV can also be used to compare data sets with different units of measurement.
For instance, if one data set is measured in inches and another is measured in centimeters, the CV can be used to compare them.
Coefficient of Variation Formula
The coefficient of variation formula is as follows:
CV = Standard Deviation / Mean
Coefficient of Variation Example
To better understand how the coefficient of variation works, let’s look at an example.
Suppose there are two investment funds, A and B.
- Fund A has a return of 10 percent with a standard deviation of 20 percent.
- Fund B has a return of 5 percent with a standard deviation of 10 percent.
Using the coefficient of variation formula, we can calculate the CV for each fund:
- Fund A: CV = 20% / 10% = 2
- Fund B: CV = 10% / 5% = 2
As we can see, both funds have a CV of 2. This means that they have the same amount of volatility relative to their returns.
Understanding the Coefficient of Variation
The CV is used to compare different data sets that may have different means and standard deviations.
In trading, investing, and finance, this can be used to compare different investments and asset classes with different return and risk characteristics.
In pure statistical terms, two data sets may have different means but similar standard deviations, in which case the CV would be higher for the data set with the smaller mean.
So if Asset A had a mean return of 3 percent and a standard deviation of 15 percent and Asset B had a mean return of 5 percent and a standard deviation of 15 percent, Asset A would have the higher coefficient of variation with the smaller mean return.
The CV can also be used to compare data sets with different units of measurement.
For example, if one data set is measured in inches and another is measured in centimeters, the CV can be used to compare them.
If two data sets have the same mean but different standard deviations, the one with the larger standard deviation will have a higher coefficient of variation.
So if Asset X had a mean return of 5 percent and a standard deviation of 15 percent and Asset B had a mean return of 5 percent and a standard deviation of 20 percent, Asset B would have the higher coefficient of variation with the smaller mean return.
However, this doesn’t necessarily mean that the asset with the higher coefficient of variation is riskier overall.
The coefficient of variation can be useful in determining which investments or type of investments might be right for you and your risk tolerance.
Coefficient of Variation for Different Types of Investments
For example, the coefficient of variation is higher for tech stocks than it is for utility stocks, consumer staples stocks, and high-quality corporate bonds.
Tech stocks come with higher returns but also higher volatility, and generally more volatility per unit of return.
For those who are uncomfortable with the risk/reward characteristics of long-duration securities like tech stocks, they will likely want to concentrate in securities that have a lower coefficient of variation and in general have a more balanced approach to their portfolio.
On the other hand, for investors who are seeking higher returns and are willing to take on more risk or have a longer time horizon to bear such risk, a higher concentration in tech stocks may be a good choice.
The coefficient of variation can also be used to compare different asset classes.
For example, the coefficient of variation is higher for small cap stocks than it is for large cap stocks.
This means that small cap stocks tend to be more volatile relative to their returns than large cap stocks.
So an investor who is looking for stability and income might want to invest in large cap stocks, while an investor who is looking for growth might want to invest in small cap stocks.
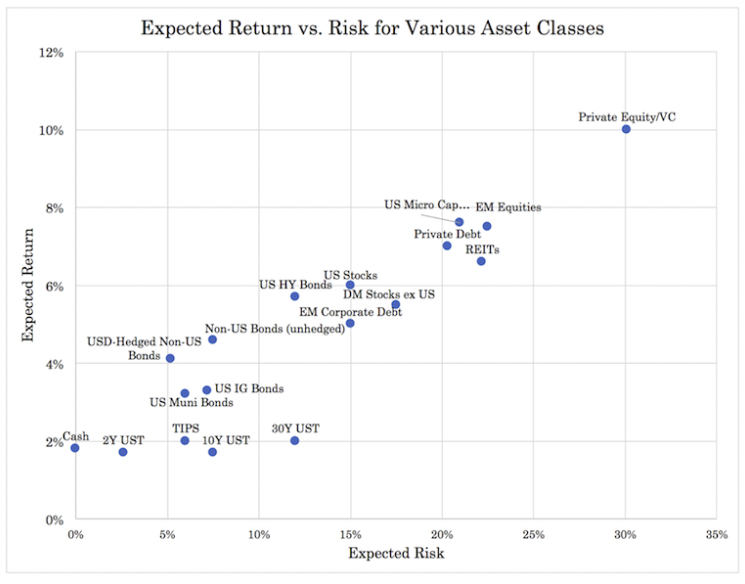
The chart below compares example returns and risks of various asset classes using approximate mean returns and volatility expressed as a standard deviation.
The coefficient of variation can be a useful tool in deciding which investments to make and how to allocate your portfolio.
It’s important to remember, however, that the coefficient of variation is a measure of dispersion and not central tendency, so it doesn’t tell you where the data is clustered.
It’s just a tool to help you compare different investments and asset classes.
How to Find the Coefficient of Variation in Excel
Coefficient of variation in Excel or spreadsheet software is fairly straightforward because you just need:
- the standard deviation of the data set, which can be found using the =STDEV(array of numbers) command, as well as
- the mean of the data set, which can be found using the =AVERAGE(array of numbers) command
Example of Coefficient of Variation for Certain Investments
Let’s take a look at the coefficient of variation for the three most popular stock ETFs:
- SPY (S&P 500 fund)
- QQQ (NASDAQ fund)
- IWM (Small cap fund)
Say you’re looking at this table with the correlations between the three assets and their standard deviation.
| Name | Ticker | SPY | QQQ | IWM | Annualized Return | Daily Standard Deviation | Monthly Standard Deviation | Annualized Standard Deviation |
|---|---|---|---|---|---|---|---|---|
| SPDR S&P 500 ETF Trust | SPY | 1.00 | 0.87 | 0.88 | 6.86% | 1.23% | 4.39% | 15.20% |
| Invesco QQQ Trust | QQQ | 0.87 | 1.00 | 0.78 | 6.91% | 1.67% | 6.65% | 23.04% |
| iShares Russell 2000 ETF | IWM | 0.88 | 0.78 | 1.00 | 7.77% | 1.53% | 5.76% | 19.96% |
The two relevant pieces of information are the return and the annual standard deviation.
So we have the following:
- SPY coefficient of variation = 6.86% / 15.20% = 0.451
- QQQ coefficient of variation = 6.91% / 23.04% = 0.300
- IWM coefficient of variation = 7.77% / 19.96% = 0.389
For the investor who wanted the highest coefficient of variation – i.e., most return relative to risk – he or she would choose SPY.
It also makes sense why SPY would have the highest CV, as it’s the most diversified. It mostly has larger companies from lots of different industries and also has the most international exposure.
QQQ is mostly tech stocks and longer-duration securities.
IWM is small caps, which are less diversified and have less international exposure.
Advantages of the Coefficient of Variation
The coefficient of variation has a few advantages:
- It’s easy to understand and calculate.
- It’s easy to compare different investments.
- It can be used to compare different asset classes.
Disadvantages of the Coefficient of Variation
There are a few disadvantages to using the coefficient of variation:
- It’s a measure of dispersion and not central tendency, so it doesn’t tell you where the data is clustered.
- It doesn’t take into account the skewness of the data set.
- The CV isn’t practical if there are a lot of both positive and negative values in the sample population.
- The CV metric is best used when nearly all of the data points in the set have the same plus-minus sign.
What Are the Best Applications of the Coefficient of Variation?
The coefficient of variation can be a useful tool for comparing different investments.
It is also helpful in asset allocation decisions.
CV can be used to find which investment has the highest return relative to risk. This information can help an investor decide how to allocate his or her portfolio.
The coefficient of variation can also be helpful in Excel when analyzing data sets.
Usefulness of Coefficient of Variation
Past performance is no guarantee of future results.
Companies change over time, which can influence their volatility relative to their reward.
Startups will tend to have very high coefficients of variation (if they were hypothetically marked to market) as their odds of success are unknown.
Whereas stable companies with regular cash flow will tend to have lower coefficients of variation.
Bonds also tend to have lower coefficients of variation as their payments are more guaranteed relative to equity holders due to being more senior in the capital structure.
Additionally, when comparing companies across different sectors it can be difficult to compare their coefficient of variation. This is due to the sector they are in generally having an impact on their CV.
For example, utility companies will tend to have lower coefficient of variations than technology companies as the former is seen as a more stable sector, with predictable cash flow (i.e., everyone needs water, electricity, gas, etc., while many tech companies dabble in more speculative ideas and products that not everybody wants or needs).
Alternatives to Coefficient of Variation
There are other measures of dispersion such as the range, interquartile range, and variance.
However, coefficient of variation is generally used because it scales the data set based on the mean, so it’s easier to compare different investments.
For example, if you have two investments with a range of returns from 1-5 percent and 7-15 percent, the coefficient of variation would be higher for the second investment. This is because the returns are more spread out relative to the mean.
Thus, the CV can be a useful tool for comparing different investments.
Coefficient of Variation – FAQs
What Does the Coefficient of Variation (COV) Tell Investors?
The coefficient of variation is a statistic that measures the dispersion of a data set relative to its mean.
It’s often used as a risk measure, because it can be helpful in comparing different investments.
The coefficient of variation is calculated by dividing the standard deviation of the data set by the mean.
How Do I Calculate COV in Excel?
To calculate coefficient of variation in Excel, you need to find the standard deviation of the data set, which can be done using the =STDEV(array of numbers) command, as well as the mean of the data set, which can be found using the =AVERAGE(array of numbers) command.
What Does a High COV Mean?
A high coefficient of variation means that the data set is more spread out.
This can be interpreted as meaning that there is more risk associated with the data set.
What Does a Low COV Mean?
A low COV means that the data set is less spread out.
This can be interpreted as meaning that there is less risk associated with the data set.
How Can I Use COV in Asset Allocation Decisions?
The COV can be helpful in asset allocation decisions because it allows you to compare different investments.
It can also be used to find which investment has the highest return relative to risk. This information can help you decide how to allocate your portfolio.
Summary – Coefficient of Variation
The coefficient of variation is a statistic that measures dispersion and is used to compare different investments.
It’s easy to calculate and understand, which makes it a popular metric.
The coefficient of variation can be a helpful tool in Excel when analyzing data sets and can be used in asset allocation decisions.
However, it’s important to remember that the COV is just one tool and should not be used in isolation.