Portfolios with Low Drawdowns


Limiting drawdowns and tail risks is one of the key goals – or at least considerations – of a portfolio.
How do we reduce drawdowns without paying for insurance in the form of options (which tends to be expensive and drags down long-term returns)?
That’s what we’ll cover in this article.
Key Takeaways – Portfolios with Low Drawdowns
- When thinking about designing a portfolio, consider drawdown limits first. Protecting the downside keeps compounding alive.
- Diversification is the most reliable way to thin your left-tail risk.
- Go beyond 60/40 for diversifying. Blend stocks, bonds, gold, commodities, and cash to balance against different environments.
- 60/40 can fail in inflation and rising-rate periods, as 2022 showed.
- Set risk targets like max 10-20% drawdown.
- Dynamic rebalancing and risk-based sizing prevent hidden concentration.
- A small commodities slice can improve tail risk.
- Gold hedges currency and policy risk. Size thoughtfully. For many, this might be around 10-15% (though everyone is different).
- Cash provides liquidity and options when markets fall.
- Expect a trade-off: lower drawdowns may mean lower peak returns, but better odds of staying in the game and reaching your goals.
Portfolios with Managed Drawdowns
A managed drawdown portfolio is structured to limit your losses during market declines while still having enough long-term growth.
Instead of chasing maximum returns, it focuses on preserving capital and maintaining steady compounding through varied market conditions.
Every asset class at some point will drawdown 50-80%+ and you don’t know which one that’ll be.
When you blend assets into a cohesive portfolio, getting drawdowns under 20% is very doable.
The goal is balance, achieving reasonable returns without exposing investors to deep or prolonged drawdowns.
Traditional 60/40 portfolios of stocks and bonds often do poorly in inflationary or high-rate environments when both asset classes fall together. 2022 was a classic example, though most of the current generation of investors had never experienced that kind of tightened correlation before.
To manage risk more effectively, traders and investors are expanding beyond the usual mix, adding assets like gold, commodities, and cash or cash-like assets to create portfolios that can better adapt to shifting economic cycles.
The Core Challenge: Drawdowns and Investor Behavior
Why the Downside Matters More Than the Upside
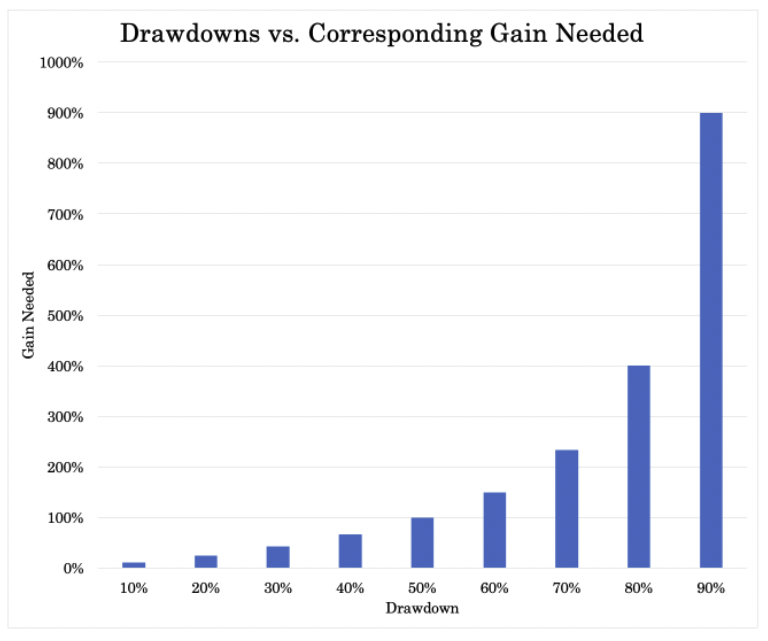
Most investors focus on returns, but the foundation before anything else is about survival. A portfolio that loses 50% needs to double just to break even.
And that recovery can take years. If it gets too deep, then it’s almost like starting all over again.
Managing downside risk is about staying in the game long enough for compounding to do its thing.
Small losses are recoverable. Big losses can derail entire financial plans.
The goal of a managed drawdown approach is to limit how far your portfolio can fall so your long-term growth stays intact.
How Human Behavior Makes Drawdowns Worse
Markets don’t destroy wealth nearly as efficiently as people’s own emotions do.
When volatility spikes, even seasoned traders/investors can get caught up in that.
Fear, loss aversion, and short-term thinking often lead people to lock in losses right before markets rebound.
Even 10% drawdowns can be too painful for many, especially if they happen relatively quickly.
Managed drawdown portfolios try to protect against both financial and psychological damage.
Smoothing the ride through diversification, defensive assets/stores of value, and systematic rules can help traders/investors stick with their plan when things get rough.
Lessons from 2008, 2020, and 2022
In 2008, stocks and credit markets collapsed together.
In 2020, even government bonds wobbled during the initial COVID panic before stabilizing.
And in 2022, rising interest rates caused both stocks and bonds to fall in tandem, leaving what many believe to be “balanced” portfolios (e.g., 60/40) anything but balanced.
Correlations tend to rise during in the tails of distributions (e.g., in crises), and the old 60/40 model isn’t enough to protect capital. (60/40 also tends to still have ~85-90% of its risk in stocks because stocks are more volatile than bonds.)
The traders/investors who last are rarely the boldest or the smartest. They’re the ones whose portfolios let them stay calm when everyone else can’t.
Building the Managed Drawdown Framework
A managed drawdown portfolio isn’t about predicting markets, but about allocating.
It uses a mix of assets that respond differently to various economic conditions, creating balance through contrast.
The core framework blends stocks, bonds, gold, commodities, and cash, each having a specific role in smoothing returns and limiting losses.
When one piece struggles, another often steps in to stabilize the whole.
Correlations
Correlation is widely studied in finance and portfolio theory because it’s a big component when it comes to diversifying well.
Achieving diversification reliably is about balancing a portfolio based on the environmental drivers of various asset classes.
This is also different from statistical correlation assumptions – e.g., stocks and bonds are uncorrelated – which are averages and temporary.
All assets classes offer a risk premium that’s largely the same once you adjust for risk.
But their sensitivities to various economic environments aren’t different.
For example:
- Stocks do best when growth is above expectation and inflation is modest.
- US Treasury bonds do best when growth and inflation come in below expectation.
- Commodities tend to perform well when inflation and growth are above expectation.
- Cash does best when money and credit are tight.
The basis then is to structure a portfolio so that their environmental sensitivities offset each other, so that the risk premium is the primary driver of returns.
And not having to depend on most portfolios which depend on, or highly benefit from, quality growth, modest inflation, and lower interest rates.
Nominal bonds and commodities have opposing inflation sensitivities, but can be combined in a way such that it moves toward being neutral on inflation – i.e., not caring what inflation does either way.
This can leave the risk premium as the dominant driver of return and lead to more stable portfolio performance.
Stocks: The Growth Engine
Stocks generate long-term growth through earnings and growth (innovation), and reward traders and investors for taking on risk.
But they’re also the first to fall when confidence fades or recessions hit.
Equity markets can drop fast and deep, which is why relying solely on them will lead to large drawdowns over time.
Diversifying into assets that behave differently in stress periods helps to stay invested rather than react out of fear.
Bonds: Income + Better Stability
Bonds have long been a popular counterweight to equities, as they provide income and may offer stability when risk assets stumble.
They tend to perform best during economic slowdowns or deflationary shocks.
The past few years have nonetheless shown their limitations.
In a world of rising inflation and interest rates, both stocks and bonds can fall together.
That’s where managing duration (how sensitive a bond is to rate changes) and including selective credit exposure becomes vital.
Bonds still matter, but they can’t carry the defensive load alone.
Gold: Nonfinancial Hedge
Gold is a type of alternative cash and currency alternative that’s not a traditional IOU.
It holds its value when paper assets lose trust, acting as a hedge against currency debasement, political risk, and systemic stress.
It often shines when real interest rates are low or negative – i.e., conditions where financial wealth is less attractive.
Still, gold likely isn’t going to be the best investment over time, so the allocation should be thoughtful enough to make a difference, not so much that it takes away from the core assets in a portfolio.
Commodities: Inflation Protection
Commodities are the real-world counterbalance to financial assets.
They tend to do best during inflationary spikes or supply disruptions, and may offer protection when rising prices hurt stocks and bonds.
If stocks and bonds do fall together, it’s not a guarantee that commodities will step in, but they can certainly do that if they’re the cause of the inflation itself.
They’re volatile, though, so position sizing has to be careful if the central goal is to manage drawdowns over time.
Even a modest allocation can reduce drawdowns during inflation shocks.
Cash: The Most Conservative Returns, No Duration
Cash not only can give some interest, but gives optionality.
During drawdowns, it gives traders/investors the option to act, rather than being forced to sell assets at bad prices.
Instead of being forced out, you can actually buy more.
In high-rate environments, it even generates meaningful yield and can temporarily be the top performer in a portfolio.
The trade-off is low or negative real returns over long periods. But as a source of liquidity and composure, cash is valuable.
Together, these five assets create a system designed not to avoid volatility but to absorb it gracefully and leave risk premium as the dominant driver of returns.
Now let’s get into actual allocations.
Drawdowns Under 20%
Let’s say we want a portfolio where drawdowns will stay under 20%.
Let’s look at 50/50 stocks/bonds vs. 45% stocks, 40% bonds, and 15% gold (which we’ll call “Diversified”).
| Metric | 50/50 | Diversified |
|---|---|---|
| Start Balance | $10,000 | $10,000 |
| End Balance | $1,061,638 | $1,352,195 |
| Annualized Return (CAGR) | 9.07% | 9.56% |
| Standard Deviation | 9.03% | 8.67% |
| Best Year | 30.67% | 30.63% |
| Worst Year | -17.40% | -15.01% |
| Maximum Drawdown | -23.87% | -18.93% |
| Sharpe Ratio | 0.51 | 0.58 |
| Sortino Ratio | 0.78 | 0.89 |
If we take 10% out of the 50% stocks and allocate it to gold (i.e., stocks now 40%) and split the 50% bonds allocation into 25% nominal and 25% inflation-adjusted, does this bring the drawdown down?
| Metric | 40/25/25/10 | Diversified |
|---|---|---|
| Start Balance | $10,000 | $10,000 |
| End Balance | $55,940 | $63,310 |
| Annualized Return (CAGR) | 7.20% | 7.74% |
| Standard Deviation | 7.25% | 7.74% |
| Best Year | 18.07% | 19.68% |
| Worst Year | -14.72% | -15.01% |
| Maximum Drawdown | -18.24% | -18.93% |
| Sharpe Ratio | 0.76 | 0.78 |
| Sortino Ratio | 1.15 | 1.22 |
It does, by 5-6% percentage points.
(Note that the start/end balance is different because inflation-adjusted bonds have a shorter history and less of a backtest period. Still, the largest drawdowns over the past 50-60 years have occurred this century.)
What happens with this allocation?
| Asset Class | Allocation |
|---|---|
| US Stock Market | 35.00% |
| 10-year Treasury | 45.00% |
| Gold | 15.00% |
| Commodities | 5.00% |
The results:
| Metric | Portfolio |
|---|---|
| Start Balance | $10,000 |
| End Balance | $36,367 |
| Annualized Return (CAGR) | 7.13% |
| Standard Deviation | 7.54% |
| Best Year | 17.80% |
| Worst Year | -12.61% |
| Maximum Drawdown | -16.20% |
| Sharpe Ratio | 0.76 |
| Sortino Ratio | 1.16 |
The maximum drawdown goes down to 16.2%.
That means broad commodities – which tend to be mostly volatile energy components like crude oil – tend to improve tail risk slightly at low allocations.
What if we swapped the commodities out for more stocks instead?
| Asset Class | Allocation |
|---|---|
| US Stock Market | 40.00% |
| 10-year Treasury | 45.00% |
| Gold | 15.00% |
The reduced diversification actually increased the drawdown from 16.2% to around 18.5%.
| Metric | Portfolio |
|---|---|
| Start Balance | $10,000 |
| End Balance | $1,200,000 |
| Annualized Return (CAGR) | 9.32% |
| Standard Deviation | 8.23% |
| Best Year | 29.50% |
| Worst Year | -14.79% |
| Maximum Drawdown | -18.46% |
| Sharpe Ratio | 0.58 |
| Sortino Ratio | 0.90 |
Takeaway: Small amount of commodities can improve drawdowns.
How Do We Get Drawdowns Below 15%?
The general way is to reduce equities and long-duration assets and increase cash.
For example, take this allocation:
| Asset Class | Allocation |
|---|---|
| US Stock Market | 28.00% |
| TIPS | 20.00% |
| 10-year Treasury | 20.00% |
| Gold | 15.00% |
| Commodities | 2.00% |
| Cash | 15.00% |
This gets you down to 14.4%:
| Metric | Portfolio 1 |
|---|---|
| Start Balance | $10,000 |
| End Balance | $32,208 |
| Annualized Return (CAGR) | 6.44% |
| Standard Deviation | 6.51% |
| Best Year | 15.11% |
| Worst Year | -10.29% |
| Maximum Drawdown | -14.42% |
| Sharpe Ratio | 0.77 |
| Sortino Ratio | 1.19 |
How Do We Get Drawdowns Below 10%?
This is where it starts getting difficult.
The stocks/long-duration assets have to come down by a lot and cash/short-duration has to go up.
Here’s the following portfolio, lowering stocks to 20% and cash to 25%:
| Asset Class | Allocation |
|---|---|
| US Stock Market | 20.00% |
| TIPS | 20.00% |
| 10-year Treasury | 20.00% |
| Gold | 12.00% |
| Commodities | 3.00% |
| Cash | 25.00% |
The results:
| Metric | Portfolio 1 |
|---|---|
| Start Balance | $10,000 |
| End Balance | $26,636 |
| Annualized Return (CAGR) | 5.36% |
| Standard Deviation | 5.36% |
| Best Year | 12.49% |
| Worst Year | -8.28% |
| Maximum Drawdown | -11.90% |
| Sharpe Ratio | 0.73 |
| Sortino Ratio | 1.12 |
The max drawodwn is still at only around 12% and the CAGR is only 5.3-5.4%.
If we lower the stocks all the way to just 14% and cash up to 32%:
| Asset Class | Allocation |
|---|---|
| US Stock Market | 14.00% |
| TIPS | 20.00% |
| 10-year Treasury | 20.00% |
| Gold | 12.00% |
| Commodities | 2.00% |
| Cash | 32.00% |
We finally get the drawdown to a flat 10%:
| Metric | Portfolio 1 |
|---|---|
| Start Balance | $10,000 |
| End Balance | $24,008 |
| Annualized Return (CAGR) | 4.78% |
| Standard Deviation | 4.68% |
| Best Year | 11.51% |
| Worst Year | -7.22% |
| Maximum Drawdown | -10.01% |
| Sharpe Ratio | 0.72 |
| Sortino Ratio | 1.11 |
But our CAGR is also just 4.8%.
Portfolio Construction and Risk Management
The construction process begins not with expected returns, but with risk.
Specifically, how much loss an investor can tolerate before discipline breaks. Every portfolio has a pain threshold, and identifying it upfront is critical.
Targeting Volatility and Drawdowns
The foundation of risk management is setting clear parameters. Many traders/investors aim to limit drawdowns to 10-20%, a range that keeps losses survivable.
There are different ways to do this:
- A standard unlevered allocation
- A levered allocation (e.g., options, futures) with OTM options as tail risk protection
- Targeting a certain level of portfolio volatility and dynamically adjusting exposure to maintain it. Like a thermostat for risk; when volatility heats up, the system automatically cools exposure to protect capital.
Managing Concentration with Dynamic Rebalancing
Over time, assets that outperform grow larger in the portfolio, quietly concentrating risk.
Dynamic rebalancing restores balance by trimming winners and adding to laggards, so that no single position gets outside of your targets.
Setting bands – rather than strict percentage weights – tends to be better, so reduce transaction costs.
Some take this a step further through risk parity weighting, where assets are sized based on their volatility/risk contribution rather than their expected returns.
This helps equalize each asset’s contribution to total risk, and reduces the chance that one asset class has undue influence.
Overlay Strategies for Protection
Even portfolio well-diversified among global stocks, nominal bonds, inflation-linked bonds, gold, commodities, and cash can seem like the tail risk strategy could be better optimized.
That’s where things like liquid alternatives, trend-following, and volatility-based overlays come in.
Some of these strategies either offer unique returns streams or systematically cut exposure when markets show signs of stress (like a sharp rise in volatility or a break below long-term price trends).
It’s not about timing the market perfectly, but about reacting quickly enough to avoid deep drawdowns.
What Backtests Reveal
Simulations and historical backtests tell a consistent story: portfolios that include gold and commodities tend to experience shallower drawdowns and faster recoveries because they produce genuine diversification that compensate in market environments that stocks and bonds cannot.
These assets often provide an offset when traditional equity-bond mixes fail, which can cushion the impact of crises and inflation shocks.
In practice, a well-built managed drawdown portfolio behaves like a self-correcting ecosystem. When risk rises, exposures better balance out rather than having too much exposed to a certain environment.
When opportunities return, capital can better re-engage.
Over time, this approach doesn’t just protect wealth but can preserve the trader/investor’s ability to stay in markets long-term.
Performance and Behavior Across Market Regimes
A well-designed managed drawdown portfolio is best diversified across economic environments.
Markets move in cycles (due to the ebb and flow of credit and other unique risks/opportunities), and each phase rewards different types of assets.
And everything that’s known is already priced in, so you don’t necessarily know which asset is going to be good or bad over a certain stretch.
Growth Regimes: When Risk Assets Lead
In times of steady growth, strong employment, and rising corporate profits, stocks tend to dominate.
Equities thrive on optimism and expanding earnings.
Bonds, on the other hand, tend to lag as interest rates rise alongside growth expectations.
Gold and commodities usually don’t do as well (especially if real rates are rising), since investors generally favor productive assets over stores of value where the returns can be fairly cash-like over time.
This is when the portfolio’s growth engine does most of the heavy lifting.
The key is that one part of the portfolio doesn’t overpower the rest.
Inflationary Regimes: The Rise of Real Assets
Inflation changes the game.
As prices climb and central banks tighten policy, both stocks and bonds can fall together, leaving traditional portfolios vulnerable.
This is where commodities and gold step forward.
Commodities can respond more directly to rising prices – and are often the cause of higher prices – while gold acts as a store of trust when paper assets lose theirs.
A lot of the challenge is behavioral. Traders/investors have to resist the instinct to sell lagging assets, as that’s often when their forward yields look most attractive.
Inflationary cycles reward those who already built their hedges, not those scrambling to add them mid-crisis.
Deflationary or Crisis Regimes: Flight to Safety
When economies contract and risk appetite vanishes, bonds and gold typically outperform.
Investors want safety, and yields often drop as central banks cut rates.
Stocks decline, sometimes sharply, and commodities can also fall as industrial demand weakens.
During these moments, the portfolio’s defensive core (high-quality bonds, gold, and cash) acts as a stabilizer.
Managed drawdown portfolios have enough of these assets so that losses remain within tolerable limits, helping investors ride through panic rather than exit at the bottom.
Reflation Recoveries: The Broad Comeback
After crises come recoveries. Liquidity injections, policy easing, and renewed confidence lift nearly all assets.
Equities rebound first, often sharply, followed by credit and real assets.
For example, in the 2008 crisis, US equities bottomed in March 2009, while real estate didn’t bottom until 2012.
This phase can feel chaotic; volatility is still high, but returns are plentiful.
The goal isn’t to predict the turn but to be present when it happens.
Across all these regimes, the real advantage of a managed drawdown approach isn’t about picking winners, but surviving every environment long enough to let compounding do its work.
Practical Implementation
Building a managed drawdown portfolio is as much about discipline as design.
The theory only matters if it can be executed without emotion or second-guessing.
Using ETFs and Index Futures for Exposure
The easiest way to build and manage a diversified portfolio today is through exchange-traded funds (ETFs).
They offer low-cost exposure to global stocks, bonds, gold, and commodities.
For example, an trader can pair an S&P 500 ETF with a bond index fund, add gold and commodity ETFs for inflation protection, and hold a small portion in a money market fund for cash.
Those managing larger or more tactical portfolios can use index futures.
Futures allow for better capital efficiency.
Automation and Rules-Based Rebalancing
One of the biggest enemies of long-term performance is emotion. Automation helps remove it.
A rules-based rebalancing system is so that portfolio adjustments happen consistently, whether markets are booming or crashing.
Rebalancing might be set to occur quarterly/annually, or whenever asset weights drift too far from their targets.
The key is to act automatically, not reactively.
Rules also help enforce buy-low, sell-high behavior by trimming overperforming assets and adding to underperformers.
Having rebalancing bands is a good way to start.
Integrating Managed Drawdown Targets
A managed drawdown portfolio works best when it includes explicit risk controls.
These can take the form of volatility caps, stop-loss rules, use of OTM options (one of the most direct ways to reduce drawdowns), or position-sizing limits.
For example, in more advanced approaches, if volatility spikes above a preset threshold, exposure to equities might be reduced and cash raised until conditions stabilize.
Similarly, drawdown alerts can trigger defensive adjustments to protect capital during sell-offs.
The best systems don’t rely on forecasts or gut feelings.
The allocation is set ahead of time and, optionally, responds to what the market is actually doing.
Over time, it’s not prediction that creates success but spreading things out in a more balanced way.
Conclusion
A managed drawdown portfolio isn’t about avoiding risk but controlling it.
Just as a trained pilot can’t completely eliminate risk, but they can control it by knowing what they’re doing.
Blending stocks, bonds, gold, commodities, and cash in a thoughtful way creates a structure that protects against deep losses.
The goal is ultimately steady compounding. Clear rules, disciplined rebalancing, and defined risk limits can help traders and investors stick with their approach long-term, which is key.