Global Macro ETFs


Global macro trading and investing has traditionally been the domain of hedge funds, where managers trade broad economic and policy trends by shifting exposure across assets, asset classes, countries/regions, and currencies.
These strategies often include both long and short positions, derivatives (e.g., options, futures, swaps), and fast repositioning to take advantage of opportunities as they emerge.
In recent years, however, exchange-traded funds have begun to offer access to global macro approaches in a more transparent and liquid format.
Among the options now available are the Unlimited HFGM Global Macro ETF in the US (HFGM), the newly launched Desjardins Global Macro ETF in Canada (DGLM), and related strategies such as the Cambria Global Momentum ETF (GMOM), and the Bridgewater All Weather ETF (ALLW).
Each has its own structure, objectives, and strengths, which give investors different ways to capture macro-driven returns.
Key Takeaways – Global Macro ETFs
- Global macro investing was once limited to hedge funds, where managers traded broad economic trends using equities, bonds, currencies, commodities, and derivatives.
- ETFs now provide access to these strategies in a liquid, transparent format without high hedge fund fees or lockups.
- Unlimited HFGM Global Macro ETF (HFGM) – Replicates hedge fund macro returns with ~2x volatility, long/short ETFs and futures, and a net leveraged profile. Lower fees than hedge funds (1% vs. “2 and 20”). Hard to pin expected returns due to volatility widening the expected distribution of returns.
- Desjardins Global Macro ETF (Canada) – Managed with Graham Capital; active long/short across assets; includes performance-based fees similar to hedge funds.
- Cambria Global Momentum ETF (GMOM) – Rules-based momentum strategy reallocating globally by price trends, not macroeconomic themes.
- Bridgewater All Weather ETF (ALLW) – Risk-parity style, balances equities, bonds, inflation assets, and commodities to stay resilient across all economic environments. 5-8% expected returns at 10-12% target vol.
Unlimited HFGM Global Macro ETF (HFGM)
The Unlimited HFGM Global Macro ETF is one of the most direct attempts to package hedge fund style macro investing into an ETF wrapper.
Launched with the specific goal of replicating the returns of hedge fund global macro managers, the fund is designed to give individuals (i.e., non-accredited investors) access to a return stream that has historically been difficult to capture without high fees and large minimum commitments (commonly 7- or 8-figures).
Unlike index-based funds that passively follow a benchmark, HFGM is actively managed and repositions across a mix of 10 to 30 underlying ETFs and futures contracts.
The holdings can be long or short, which allows the managers to benefit not only from rising markets but also from declines when the macro environment calls for defensive positioning.
(Note that the ETF is too young to have gone through sufficient stress-testing in live markets.)
A unique aspect of HFGM is its design to deliver roughly double the volatility of the hedge fund industry’s global macro index.
Most global macro hedge funds show annualized volatility of approximately 8–12% (for reference, US large cap stocks are around 15%). This means that HFGM is targeting around 16-24% annualized volatility by design.
In practice, this means that while the fund tries to capture the same directional bets as professional managers, it magnifies them so that the returns are more noticeable for individual investors who might otherwise be underwhelmed by the smoother return profile of diversified hedge fund strategies.
For example, the second fund on this list (ALLW) is likely to give 5-7% nominal returns over the long run at around two-thirds the volatility of the stock market. That’s great for some, but unappealing for those who want more aggression (and to help pay for the management fees).
For many, the appeal of HFGM lies in its role as a complement to traditional portfolios, particularly bond-heavy ones. When interest rates are stagnant or declining, bond-heavy portfolios can suffer from low real returns.
A macro strategy that is flexible enough to profit from shifts in growth, inflation, and monetary policy can potentially provide an additional layer of diversification.
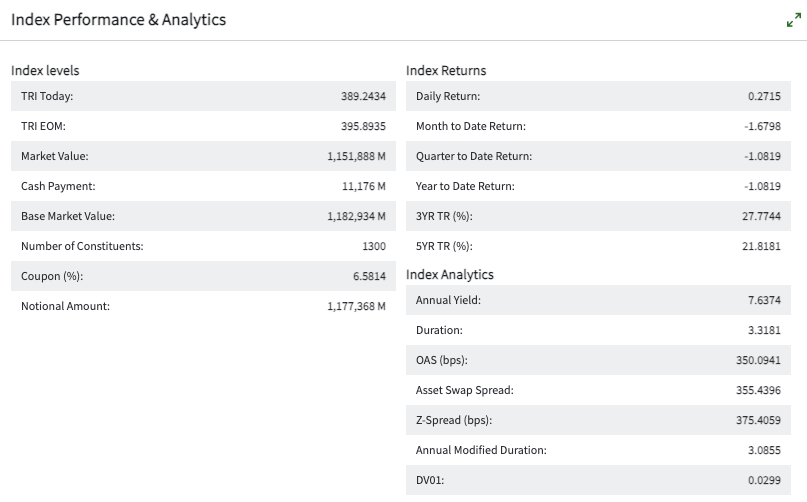
Information from the Prospectus
The prospectus from the company’s website provides key information.
Unlike hedge funds that often charge “2 and 20” fees, HFGM has a total expense ratio of 1.00% (0.95% excluding acquired fund fees), which is a lot like a mutual fund (high for an ETF) but lower than most private funds.
Its structure also avoids the tax inefficiencies and paperwork associated with limited partnership vehicles, including K-1 forms.
The fund’s goal is to replicate the gross returns of global macro hedge funds while targeting about twice the volatility.
By incorporating higher volatility, the sub-adviser, Unlimited Funds, believes that net returns may exceed those of the hedge fund sector over time. The portfolio is constructed using a proprietary algorithm that analyzes daily and monthly gross returns and volatility data from the hedge fund industry.
Based on this analysis, the fund builds a portfolio of long and short positions in other ETFs and futures contracts that best match the sector’s performance, while increasing the volatility exposure.
HFGM isn’t itself a hedge fund. It doesn’t invest directly in hedge funds, nor does it seek to replicate their exact holdings. As an ETF, there are also regulatory restrictions.
Unlike hedge funds, it avoids high leverage and illiquid securities. Instead, it uses exchange-traded products and liquid futures to express macro views. This allows the ETF to maintain transparency, tradability, and tax efficiency.
The fund has gotten off to a good start. Short-term results aren’t necessarily indicative of future outcomes, but they demonstrate the fund’s ability to track its mandate early on.
Holdings
The top holdings illustrate its approach: S&P 500 E-mini futures, British pound currency futures, iBoxx bond indices, live cattle futures, Vanguard Emerging Markets Government Bond ETF, WTI crude oil futures, and exposure to Japanese equities through Nikkei 225 futures.
The portfolio also includes TIPS, cash instruments, and government obligations, showing a blend of equity, currency, commodity, and fixed-income exposures.
Positions shift as the algorithm adjusts.
Here’s the complete list as of the time this article was written:
| Code | Asset Type | Security Name | Weighting |
|---|---|---|---|
| ESU5 INDEX | Equity Future | S&P 500 E-mini Future Sep25 | 114.25% |
| BPU5 CURNCY | Currency Future | British Pound Currency Future Sep25 | 59.00% |
| IBYZ5 INDEX | Bond Index | iBoxx iShares Bond Index Dec25 | 31.86% |
| LCV5 COMDTY | Commodity | Live Cattle Future Oct25 | 28.36% |
| 921946885 | Bond ETF | Vanguard Emerging Markets Govt Bond ETF | 27.29% |
| Cash&Other | Cash | Cash & Other | 23.91% |
| 464287176 | Bond ETF | iShares Barclays TIPS Bond Fund | 23.61% |
| CLZ5 COMDTY | Commodity | WTI Crude Oil Future Dec25 | 11.78% |
| 31846V336 | Gov’t Fund | First American Govt Obligations Fund 2031 | 11.44% |
| NXU5 INDEX | Equity Future | Nikkei 225 (CME) Sep25 | 11.01% |
| GCV5 COMDTY | Commodity | Gold 100 oz Future Oct25 | 10.80% |
| CDU5 CURNCY | Currency Future | Canadian Dollar Currency Future Sep25 | 7.47% |
| MFSU5 INDEX | Equity Future | MSCI EAFE Index Future Sep25 | 6.63% |
| ECU5 CURNCY | Currency Future | Euro FX Currency Future Sep25 | 6.25% |
| 92206C664 | Equity ETF | Vanguard Russell 2000 ETF | 6.12% |
| MESU5 INDEX | Equity Future | MSCI Emerging Markets Future Sep25 | 4.35% |
| 46429B671 | Equity ETF | iShares MSCI China ETF | 3.59% |
| 46140H700 | Commodity ETF | Invesco DB Base Metals Fund | 3.31% |
| CCZ5 COMDTY | Commodity | Cocoa Future Dec25 | 2.67% |
| KCZ5 COMDTY | Commodity | Coffee ‘C’ Future Dec25 | 2.42% |
| ADU5 CURNCY | Currency Future | Australian Dollar Currency Future Sep25 | 2.05% |
| C Z5 COMDTY | Commodity | Corn Future Dec25 | 1.69% |
| TYZ5 COMDTY | Bond Future | US 10yr Treasury Note (CBT) Dec25 | 1.60% |
| 922042874 | Equity ETF | Vanguard FTSE Europe ETF | 0.70% |
| SBV5 COMDTY | Commodity | Sugar #11 (World) Future Oct25 | 0.53% |
| SFU5 CURNCY | Currency Future | Swiss Franc Currency Future Sep25 | -9.80% |
| JYU5 CURNCY | Currency Future | Japanese Yen Currency Future Sep25 | -5.83% |
| S X5 COMDTY | Commodity | Soybean Future Nov25 | -3.73% |
| USZ5 COMDTY | Bond Future | US Long Bond (CBT) Dec25 | -2.95% |
| FVZ5 COMDTY | Bond Future | US 5yr Treasury Note (CBT) Dec25 | -22.78% |
Strategy
The HFGM portfolio shows a strategy that is very much in line with what a “global macro replication” product aims to do: take directional exposures across equities, currencies, bonds, and commodities in a way that mirrors hedge fund positioning, but within an ETF structure.
A few points stand out:
Heavy Tilt Toward Equity Index Futures
The single largest exposure is an outsized long in S&P 500 E-mini futures at more than 114% of portfolio weighting.
This kind of leverage is typical of macro managers who want to magnify equity beta when conditions support risk assets.
Coupled with smaller allocations to MSCI EAFE, MSCI Emerging Markets, China, and Europe ETFs, the portfolio clearly expresses a bullish tilt toward global equities, but with the S&P as the dominant driver.
Again, this can change over time.
Net Exposure
It has a 402.69% net long exposure and 45.09% net short exposure, for a net exposure of 357.6%.
Since each holding can be quite different you can’t really make judgments about expected volatility from this along.
But that means the fund is effectively running more than 3.5x gross exposure to NAV, heavily leveraged via futures and ETFs, with a strong net long bias.
Currency Bets Drive a Big Share of Risk
Currencies are a major piece of this strategy. The large long British pound futures position (59%) signals conviction in sterling strength, while there are shorts in the Swiss franc (-9.8%) and Japanese yen (-5.8%), showing a bet against safe-haven currencies.
Smaller exposures to the Canadian dollar (7.5%) and euro (6.3%) add to the picture.
Overall, this suggests HFGM is leaning into a strong-dollar or differentiated growth outlook where commodity-linked or cyclical currencies are favored over defensive ones.
Commodities Provide Thematic Diversification
Macro managers often use commodities as both growth and inflation trades, and this portfolio is no exception.
There are long positions in oil (11.8%), gold (10.8%), and base metals (3.3%), alongside agricultural futures like cattle (28.4%), cocoa (2.7%), and coffee (2.4%).
These exposures suggest an attempt to capture commodity upside while diversifying across energy, metals, and soft commodities.
The smaller longs in corn and sugar are modest, but they show a broad reach into inflation-linked assets.
Bonds as a Source of Shorts and Hedges
The fund takes large short positions in US Treasuries, particularly the 5-year note (-22.8%), alongside smaller shorts in the 10-year (-1.6%) and long bond (-3%).
In isolation, this might indicate a bearish view on US rates, i.e., essentially a bet that yields will rise. But it’s likely a way to reduce the duration of the portfolio – i.e., make the portfolio neutral to rising/falling interest rates.
Because we also see that the fund holds inflation-linked bonds (TIPS, 23.6%) and emerging market sovereign debt (Vanguard EM Bonds, 27.3%), which diversify duration risk and give exposure to higher-yielding debt.
This barbell of long inflation protection and EM bonds versus short Treasuries is a very macro-style expression.
Cash and Liquidity
The cash allocation of nearly 24% is high but fits with a macro replication strategy.
It gives flexibility for rebalancing as the algorithm shifts exposures and provides collateral for derivatives positions.
Expected Long-Run Return
The fund holds ~72% of NAV in cash collateral (First American Gov Obligations Fund + cash), earning roughly 3.6% on that capital. That’s +2.6% contribution to the fund at the NAV level.
Every futures position implicitly embeds a financing rate. The long holder of a futures contract forgoes the risk-free rate on the notional. The gross long futures notional is roughly $195M (~181% of NAV), and the gross short futures notional is roughly $82M (~76% of NAV). The net futures notional is about $113M.
At around a ~3% embedded financing rate at the time of this writing, the longs are paying ~3% on their notional and the shorts are receiving ~3% on theirs. On a net basis, the fund is paying roughly 3% on the ~$113M net long futures exposure, which is about 105% of NAV.
That’s a drag of roughly -3.15% at the NAV level, but this is offset by the fact that the collateral earns close to that rate. This is the standard futures-backed fund dynamic: collateral yield roughly cancels the financing cost embedded in futures.
Net collateral income vs. financing cost: the cash earns ~3.6% on 72% of NAV (+2.6%), but the futures embed ~3% financing on ~105% net notional (-3.15%). That nets to roughly -0.55% structural drag before you get to the directional bets.
Then subtract the 0.95-1.00% expense ratio. That brings the structural baseline to about -1.55% before any asset class returns.
The physical ETF holdings don’t have embedded financing costs since they’re bought outright with cash. VWOB yields ~5.8% on its 10.5% weight (+0.61%). The equity ETFs (VGK, VTWO, MCHI) at ~9.4% weight might yield ~2% in dividends (+0.19%). DBB at 7.8% doesn’t yield meaningfully.
Total yield pickup from physical ETFs: roughly +0.8%.
The VIX long at 5% of NAV is a pure bleed position, though you get some offset in falling equity environments.
VIX futures in contango typically cost 5-8% per month on notional in roll decay. Even conservatively, that 5% allocation could lose 30-60% annualized from contango. At 5% weight, that’s -1.5% to -3.0% drag on the fund annually not taking into account its offsetting effect. This is the single biggest identifiable structural cost.
The HY bond futures (34.4% of NAV) carry an implied yield. The iBoxx HY index has a YTM around 6.5-8.0% (most of the time).
The futures price embeds the financing rate but the buyer captures the excess spread over the financing rate. At 34.4% weight and ~4.2% excess carry (7.2% YTM minus 3% financing), that’s roughly +1.4% contribution.
The short duration book (5-yr note at -24.8%, long bond at -9.2%, net with the tiny 10yr long at +0.6%) is net short about 33.4% of NAV in Treasuries. Shorting bonds via futures means you receive the financing rate but give up the coupon. With the curve currently close to flat/slightly inverted in the 5-10-yr space, the net carry on this short is roughly neutral to slightly positive. Call it +0.0% to +0.3%.
Putting it together (structural/carry-based expected return, no directional view):
| Component | Contribution |
|---|---|
| Collateral income net of futures financing | -0.55% |
| Expense ratio | -1.00% |
| Physical ETF yield (VWOB + equity dividends) | +0.80% |
| VIX contango bleed (5% weight) | -1.5% to -3.0% |
| HY futures excess carry | +1.4% |
| Short duration carry | +0.0% to +0.3% |
| Structural carry total | -0.85% to -2.05% |
So the carry-based floor, absent any directional returns, is roughly -1% to -2% annualized. The fund needs its directional bets (long equities, long gold, long non-USD FX, long commodities) to work to generate positive total returns.
What matters directionally: The fund is running a classic global macro playbook that’s long risk assets (~23% S&P, ~11% Nikkei, ~6% EAFE, ~4% EM, ~3% R2K), long gold (~19%), long commodity complex (~25% gross across sugar, soybeans, corn, coffee, crude, copper, base metals, minus cocoa), long non-USD currencies (net long EUR, AUD, CHF, short GBP, JPY, CAD, short DXY), and carrying some vol insurance via VIX longs. The bond book is short duration and long credit.
If equities return ~8%, gold ~5%, commodities ~3%, and FX bets are roughly flat, the weighted directional contribution would be something like +4-6%. Combined with the structural carry drag, that gets you to a realistic expected total return range of roughly +2% to +5% annually, with the VIX bleed and expense ratio as ongoing headwinds, and a wide distribution of outcomes given the ~257% gross leverage.
The key takeaway: the 1.00% expense ratio and the VIX long together eat roughly 2.5-4% of return annually. That’s the price of the macro hedge fund replication wrapper. The fund needs sustained directional wins across its multi-asset book just to clear those hurdles.
Overall Impression
The HFGM strategy isn’t a traditional long-only allocation.
It’s long global equities, long commodities, long EM and inflation-linked debt, long the pound and commodity-linked currencies, while short US Treasuries, the yen, and the franc.
That mix resembles a hedge fund style “risk-on macro” stance: betting on growth, inflation resilience, and stronger cyclical assets while fading safe havens.
The design (leveraging positions like S&P futures while balancing them with shorts and diversifiers) tries to give you hedge-fund-like exposures in a liquid, transparent ETF wrapper.
The concentration in certain contracts (S&P futures, BP currency futures, live cattle) shows that the proprietary algorithm allows for bold allocations, unlike traditional diversified funds.
Investors should expect higher volatility, mark-to-market swings, and exposure that will change meaningfully as the macro backdrop shifts.
Risks
HFGM does carry risks typical of macro and derivatives strategies.
These include volatility risk, short selling risk, futures and swap risks, high turnover, and exposure to foreign securities.
Because it’s a new fund with limited operating history, we don’t yet have a long track record to assess.
Still, the fund’s design tries to democratize hedge fund-style global macro investing by lowering costs, improving liquidity, and increasing accessibility for both institutional and retail investors.
SPDR Bridgewater All Weather ETF (ALLW)
The SPDR Bridgewater All Weather ETF (ticker: ALLW) was launched in March 2025 as a collaboration between State Street Investment Management and Bridgewater Associates, the well-known hedge fund.
The fund looks to provide a diversified, risk-balanced portfolio that can withstand a wide variety of market environments, including economic expansions, recessions, periods of rising inflation, and times of disinflation.
In other words, have a “neutral” position to rising/falling growth/inflation relative to what’s discounted into markets.
Bridgewater’s “All Weather” concept, originally pioneered in its institutional portfolios, allocates across asset classes with the goal of balancing exposure to different macroeconomic environments rather than attempting to predict which scenario will unfold next.
At its core, ALLW spreads investments across global equities, nominal bonds, inflation-linked bonds, and commodities.
Here is conceptually how it spreads risk across the four macroeconomic sub-portfolios:
- Rising Growth → Global equities (S&P 500, Emerging Markets, EAFE)
- Falling Growth → Nominal bonds (US Treasuries, Bunds)
- Rising Inflation → Commodities (gold, oil, broad commodity indices)
- Falling Inflation → Inflation-linked bonds (TIPS, global linkers)
This table illustrates:
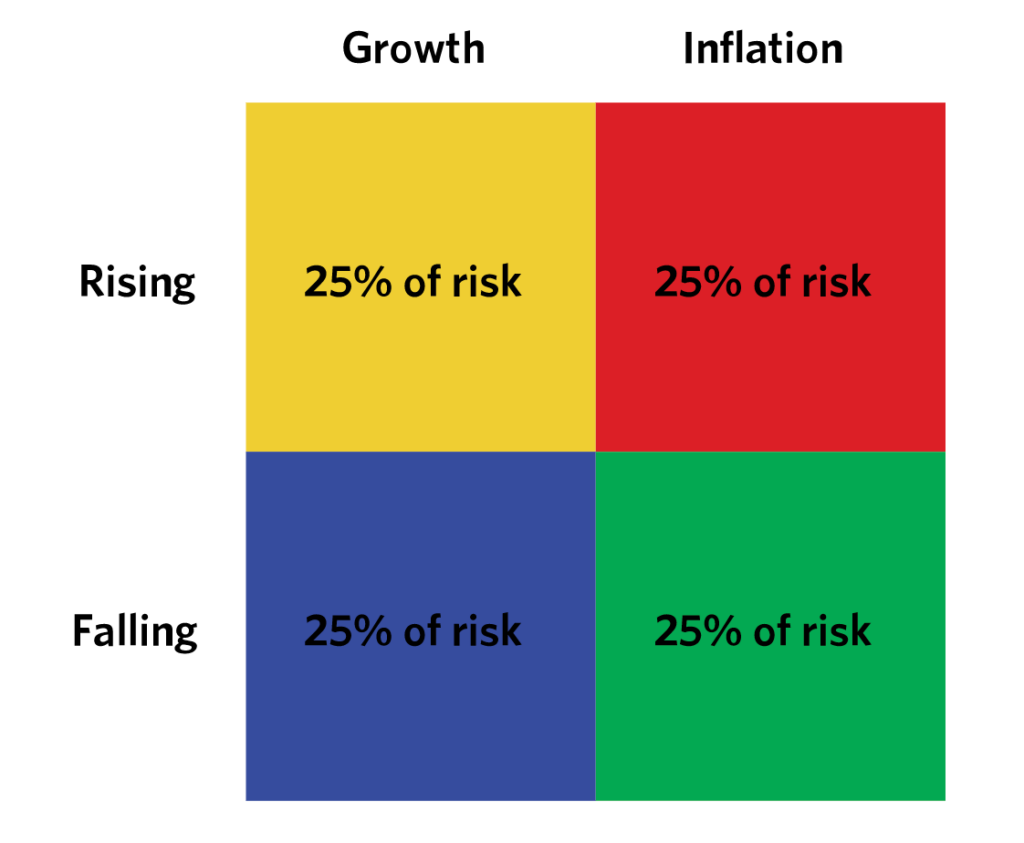
This shows how different assets might fit into these buckets:
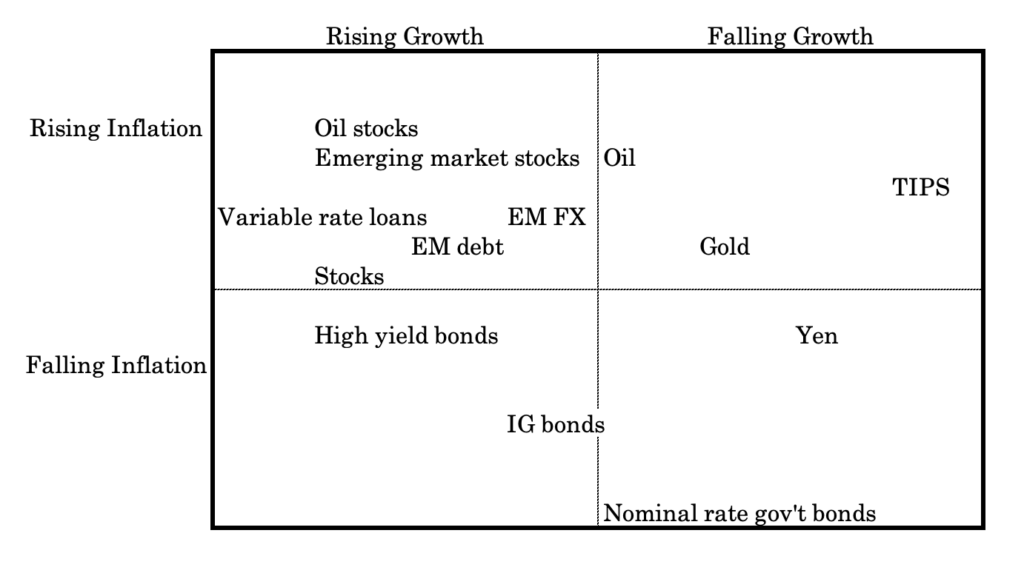
The idea is that each bucket contributes similarly to risk, so the portfolio can stay balanced no matter which economic environment dominates.
The portfolio is actively managed by State Street Funds Management, which executes a model portfolio constructed daily by Bridgewater.
The ETF typically targets an annualized volatility of 10–12%, a level meant to keep risk consistent while adjusting exposures dynamically.
This “risk parity” design differs from traditional allocation funds that may overweight equities by default.
Instead, ALLW assigns weight so that each economic regime (rising growth, falling growth, rising inflation, falling inflation) contributes more equally to the portfolio’s overall risk.
The expense ratio stands at 0.85%, higher than broad passive index funds but in line with actively managed multi-asset strategies. The ETF pays distributions annually and currently shows a 30-day SEC yield of 1.81%.
The ETF isn’t meant to track equities directly but instead to smooth outcomes across different environments.
The ETF frequently trades at or near NAV, with a median bid-ask spread of just 0.04%, which suggests solid liquidity.
The holdings show a blend of cash-like instruments, equity exposure, and inflation-linked government securities.
The single largest holding is the SSI US Government Money Market Class, at about 38% of assets, which provides liquidity and stability.
Equities are represented through the SPDR Portfolio S&P 500 ETF (13.7%) and SPDR Portfolio Emerging Markets ETF (4.2%), as well as smaller positions in regional index futures like the TOPIX, Euro Stoxx 50, FTSE 100, and SPI 200.
Inflation-linked Treasuries form a significant share, with multiple issues maturing between 2032 and 2055. Commodities exposure is introduced via gold futures, broad commodity swaps (Bloomberg Commodity TR), and other derivative contracts. (We’ll cover holdings more below.)
This structure reflects Bridgewater’s philosophy: balance the portfolio so that no single economic driver dominates returns.
For instance, equities may perform well in strong growth, but inflation-linked bonds and commodities provide ballast when inflation surprises to the upside, while nominal bonds offer protection in deflationary downturns.
In short, ALLW democratizes Bridgewater’s well-known “All Weather” framework in an ETF format, providing diversification across geographies and asset classes with daily transparency.
While not a vehicle for aggressive equity growth, it appeals to investors looking for smoother performance and resilience against uncertain macro conditions.
| Name | Ticker | Identifier | Weight (%) |
|---|---|---|---|
| SSI US GOV MONEY MARKET CLASS | – | 924QSGII3 | 38.00 |
| SPDR PORTFOLIO S+P 500 ETF | SPLG | 78464A854 | 13.68 |
| Treasury Bill 11/25 0.00000 | – | 912797RM1 | 5.46 |
| SPDR PORTFOLIO Emerging Mkt | SPEM | 78463X509 | 4.23 |
| TSY Infl Ix N/B 01/35 2.125 | – | 91282CML2 | 4.13 |
| TSY Infl Ix N/B 07/34 1.875 | – | 91282CLE9 | 3.83 |
| TSY Infl Ix N/B 01/33 1.125 | – | 91282CGK1 | 3.47 |
| TSY Infl Ix N/B 01/34 1.75 | – | 91282CJY8 | 3.09 |
| TSY Infl Ix N/B 07/33 1.375 | – | 91282CHP9 | 2.98 |
| US Dollar | – | 999USDZ92 | 2.77 |
| SPDR S+P China ETF | GXC | 78463X400 | 2.70 |
| TSY Infl Ix N/B 07/35 1.875 | – | 91282CNS6 | 1.89 |
| TSY Infl Ix N/B 02/44 1.375 | – | 912810RF7 | 1.46 |
| TSY Infl Ix N/B 02/42 0.75 | – | 912810QV3 | 1.24 |
| TSY Infl Ix N/B 02/45 0.75 | – | 912810RL4 | 1.23 |
| TSY Infl Ix N/B 02/54 2.125 | – | 912810TY4 | 1.05 |
| TSY Infl Ix N/B 02/53 1.5 | – | 912810TP3 | 0.91 |
| TSY Infl Ix N/B 02/43 0.625 | – | 912810RA8 | 0.89 |
| TSY Infl Ix N/B 02/41 2.125 | – | 912810QP6 | 0.75 |
| TSY Infl Ix N/B 02/47 0.875 | – | 912810RW0 | 0.75 |
| TSY Infl Ix N/B 02/55 2.375 | – | 912810UH9 | 0.74 |
| TSY Infl Ix N/B 02/46 1.0 | – | 912810RR1 | 0.71 |
| TSY Infl Ix N/B 02/48 1.0 | – | 912810SB5 | 0.70 |
| TSY Infl Ix N/B 02/51 0.125 | – | 912810SV1 | 0.64 |
| TSY Infl Ix N/B 02/52 0.125 | – | 912810TE8 | 0.61 |
| TSY Infl Ix N/B 02/50 0.25 | – | 912810SM1 | 0.55 |
| TSY Infl Ix N/B 02/49 1.0 | – | 912810SG4 | 0.53 |
| TSY Infl Ix N/B 07/32 0.625 | – | 91282CEZ0 | 0.40 |
| TOPIX Index Future Sep25 | TPU5 | ADI2Q6Q66 | 0.40 |
| Gold 100 oz Future Dec25 | GCZ5 | ADI2PC2Z6 | 0.31 |
| SPI 200 Futures Sep25 | XPU5 | ADI2Q6PR1 | 0.17 |
| Euro Stoxx 50 Sep25 | VGU5 | ADI2RH507 | 0.14 |
| FTSE 100 Index Future Sep25 | Z U5 | ADI2S5WX0 | 0.14 |
| US 10yr Note (CBT) Dec25 | TYZ5 | ADI2WQ4K8 | 0.13 |
| TRS USD BCOMTR | – | – | 0.12 |
| US Long Bond (CBT) Dec25 | USZ5 | ADI2XGZN9 | 0.08 |
| Long Gilt Future Dec25 | G Z5 | ADI2X61Z1 | 0.02 |
| Canadian Dollar | – | 999CADZ91 | 0.00 |
| Euro-Bund Future Dec25 | RXZ5 | ADI2X6CN6 | -0.00 |
| Aust 10yr Bond Future Sep25 | XMU5 | ADI2VT1T7 | -0.01 |
| Euro Currency | – | 999EURZ94 | -0.06 |
| Euro-Bund Future Sep25 | RXU5 | ADI2VGSY5 | -0.12 |
| Australian Dollar | – | 999AUDZ93 | -0.17 |
| Pound Sterling | – | 999GBPZ94 | -0.18 |
| Japanese Yen | – | 999JPYZ94 | -0.34 |
Expected Long-Run Return
The portfolio is conceptually cleaner than HFGM. Five buckets:
Cash/Collateral (39.2% of NAV)
- SSI US Gov Money Market: 33.7% ($401M)
- USD cash: 5.5% ($66M)
This earns roughly 3.6% annualized. Contribution: +1.4%.
TIPS — the dominant allocation (~33.8% of NAV in market value)
This is the core of the fund and what makes it recognizably All Weather. The TIPS book spans maturities from 2033 through 2056, with heavy concentration in the 2033-2036 range (intermediate) and a meaningful long tail out to 2055-2056. Rough weighted average duration is probably 12-15 years given the mix.
Current 10-year TIPS real yield is ~2.10%. The longer-dated TIPS (20-30yr) are yielding closer to 2.2-2.4% real. The portfolio-weighted real yield is probably around 2.0-2.1%.
The key math: TIPS return = real yield + realized inflation.
With breakevens around 2.3-2.4% and Fed projecting 2.7% PCE, the nominal expected return on the TIPS book is roughly real yield (~2.1%) + inflation (~2.5%) = ~4.6% nominal if held to maturity with no duration moves. But this is a mark-to-market portfolio, and with 12-15yr duration, a 50bp move in real yields swings the portfolio by 6-7.5%. The carry-based expected return on 33.8% weight: +1.55% contribution.
T-Bill (5.3% of NAV)
- Treasury Bill 04/26: essentially cash-equivalent, earning ~3.5%.
- Contribution: +0.19%.
Equities (21.5% of NAV in physical ETFs)
- SPYM (S&P 500): 13.7%; dividend yield ~1.3%
- SPEM (EM equities): 4.4%; dividend yield ~2.8%
- GXC (China): 3.4%; dividend yield ~2.0%
Dividend income contribution: ~0.18% + 0.12% + 0.07% = +0.37%.
Futures overlay (where the leverage lives)
The “Weight” column in the holdings shows negative weights for all futures, which represents the margin/cash offset, not the direction. The Notional Value column shows the actual exposure. Let me parse the futures book by notional:
Long futures (via total return swap + futures):
- BCOM TR (commodity total return swap): $287M notional (24.1% of NAV) – 0.78% weight but $287M notional. This is the commodity allocation, delivered via a total return swap on the Bloomberg Commodity Total Return Index.
- Gold futures (GC): $119M notional (10.0% of NAV)
Equity index futures (long):
- Euro Stoxx 50: $111M notional (9.3%)
- TOPIX: $58M notional (4.9%)
- SPI 200 (Australia): $45M notional (3.8%)
- FTSE 100: $48M notional (4.0%)
Bond futures (long nominal duration):
- US 10yr Note: $286M notional (24.0%)
- Euro-Bund: $211M notional (17.7%)
- US Long Bond: $134M notional (11.3%)
- Long Gilt: $72M notional (6.1%)
- Aust 10yr Bond: $109M notional (9.2%)
FX (small physical positions):
- EUR: 0.56%, GBP: 0.34%, JPY: 0.05%, small AUD short
Gross notional on futures + swap: ~$1.48B, roughly 124% of NAV on top of the physical holdings. Total portfolio gross exposure is roughly 225-250% of NAV. This is standard risk parity leverage.
Structural carry analysis:
The cash collateral (39.2% of NAV earning ~3.6%) offsets the embedded financing in the futures book.
Net futures notional is roughly $1.48B, or 124% of NAV. At ~3% embedded financing, that’s a -3.7% drag. Cash earns +1.4%. Net structural financing drag: -2.3%.
Then subtract the 0.85% expense ratio. Structural baseline: -3.15% before any asset returns.
Now the asset class returns:
The nominal bond futures book is the biggest single exposure.
US 10yr at 24% notional, US Long Bond at 11.3%, Bund at 17.7%, Gilt at 6.1%, Aussie 10yr at 9.2%.
Total nominal bond futures = ~68% of NAV in notional.
These are long duration positions. The carry on these bonds (coupon minus financing) is roughly flat to slightly negative in the current environment where short rates (~3.5-3.75%) are close to or above longer-term yields (10yr at ~4.3%, 30yr at ~4.9%, but Bunds ~2.7%, Gilts ~4.7%).
The net carry on the bond futures book after financing is probably slightly positive, call it +0.3% to +0.5% contribution from the coupon-financing differential, weighted by notional.
Equity futures (22% of NAV in notional): carry is the dividend yield minus financing. For a blended international equity portfolio, dividend yield ~2.5% minus 3% financing = slightly negative carry. Call it -0.1% contribution.
BCOM TR swap (24% of NAV): commodity indices have historically had negative roll yield of -2% to -5% annually from contango. The BCOM Total Return index includes T-bill return on collateral, but since the fund is accessing it via a swap, the financing is already embedded. The commodity carry after financing and roll is probably -0.5% to -1.5%, depending on the shape of commodity curves. At 24% weight, that’s roughly -0.12% to -0.36% contribution.
Gold futures (10% of NAV): gold has no yield. The cost is purely the financing cost, which is already in the structural drag calculation. No incremental carry.
Putting it together:
| Component | Contribution |
|---|---|
| Cash/collateral income net of futures financing | -2.3% |
| Expense ratio | -0.85% |
| TIPS real yield + inflation carry (38% weight) | +1.55% |
| T-Bill carry (5% weight) | +0.19% |
| Equity ETF dividends (25% weight) | +0.37% |
| Nominal bond futures carry (68% notional) | +0.3% to 0.5% |
| Equity futures carry (22% notional) | -0.1% |
| Commodity roll/carry (24% notional) | -0.12% to -0.3% |
| Structural carry total | -0.96% to 1.4% |
So the carry-based floor, absent directional moves, is roughly -1.0% to -1.4% annualized. Slightly better than HFGM’s structural drag, primarily because ALLW doesn’t carry a VIX long (massive structural bleed) and has a lower expense ratio (0.85% vs 1.00%).
With directional assumptions:
So now that we have some semblance of the costs accounted for, let’s use our return assumptions.
If equities return ~7-8% (blended global), bonds return 3-5% (nominal carry plus some duration tailwind if the Fed does cut), gold returns 3-5%, TIPS return the ~4.6% nominal described above, and commodities have a low-single-digit return, the weighted directional contribution across the ~250% gross exposure could be in the +5-8% range.
Combined with the -1% to -1.4% structural drag, that puts the realistic expected total return for ALLW at roughly +5% to +8% annualized. For a 10-12% target volatility, that’s about to be expected.
Key difference vs. HFGM
ALLW is a purer risk parity construction – no tactical bets, no VIX long, heavier on TIPS and nominal bonds (the classic All Weather overweight to inflation-linked duration).
The drag is lower, the portfolio is more symmetric across environments, and the expected return distribution is tighter.
The vulnerability is the same as any levered bond-heavy portfolio: a sustained rise in real yields hammers both the TIPS book and the nominal bond futures simultaneously, and with 12-15 year duration on 33% of NAV in TIPS plus 68% notional in bond futures, a rise in yields is the biggest threat to the portfolio.
Canadian-Listed: Desjardins Global Macro ETF (DGLM)
The Desjardins Global Macro ETF, listed on the Toronto Stock Exchange under the ticker DGLM, is one of the newest entrants into this space.
Trading began on August 28, 2025, and became a significant step for Canadian investors who previously had limited access to macro-focused ETFs.
Like HFGM, this fund is actively managed, but it’s structured as a Canadian mutual fund trust rather than a US ETF.
It looks to deliver positive returns in a variety of environments by moving across asset classes and using both long and short positions. It shows the central flexibility that’s key to macro investing, where managers respond to shifting economic signals rather than tracking any single index.
The fund is managed by Desjardins Global Asset Management, with Graham Capital Management acting as the sub-advisor.
Graham is a well-known hedge fund with deep expertise in macro strategies, so its involvement gives DGLM institutional credibility.
Early figures suggest that assets under management are around 81 million Canadian dollars, with 77 million of that having flowed in over the past year. This indicates a strong appetite among Canadian investors for an alternative product that doesn’t rely on static benchmarks.
Fees
In addition to standard management fees, the fund may charge a performance fee of 15% of new trading profits during a given period.
This mirrors hedge fund fee models more than traditional ETFs, though it also means investors should be mindful of how fees affect net returns.
Untested So Far
Because it is so new, DGLM has no long-term track record to evaluate. That presents both an opportunity and a risk.
On the one hand, early investors are getting access to a fresh product managed by an experienced team with the flexibility to respond to whatever happens.
On the other, it’s unclear how the strategy will perform relative to its objectives.
And there is always the possibility that fees will eat into gains during flat or volatile periods.
Still, the very fact that a major Canadian asset manager has launched a global macro ETF shows that interest in this space is broadening beyond the US market.
Related Strategic ETF: Cambria Global Momentum ETF (GMOM)
Another fund worth mentioning in the context of macro investing is the Cambria Global Momentum ETF, traded under the ticker GMOM.
While it doesn’t strictly follow a macro strategy, it’s a tactical allocation fund that applies global macro momentum principles across multiple asset classes.
The managers analyze price trends in equities, bonds, real assets, and alternative markets, reallocating the portfolio based on momentum signals.
In practice, this means the fund often tilts toward asset classes that are demonstrating strong relative performance and away from those in decline.
GMOM has been on the market longer than DGLM and isn’t positioned as a hedge fund replication product like HFGM.
Instead, it offers exposure to a rules-based, trend-following system that naturally shifts allocations as markets change.
Some purists might argue that it doesn’t qualify as a macro ETF because it relies on market signals rather than macroeconomic themes, but the end result is still multi-asset exposure that adjusts dynamically.
One of the key features of macro trading is trading various asset classes rather than specializing in a particular one.
Comparative Overview
Taken together, these funds show different approaches to making macro-style investing available through ETFs.
HFGM is a direct attempt to replicate hedge fund strategies in the US. It offers higher volatility and active repositioning across ETFs and futures.
ALLW is an actively managed, risk-parity style multi-asset ETF that balances equities, bonds, inflation-linked securities, commodities, and cash to remain resilient across various economic environments. This makes it different from other macro ETFs like HFGM or DGLM because instead of trying to replicate hedge fund positioning or chase macro trades, it systematically spreads risk across growth and inflation regimes to smooth returns over time.
DGLM, launched in Canada, brings institutional expertise through Graham Capital and adopts a fee structure closer to traditional hedge funds, including performance-based charges.
GMOM is a related but distinct approach, focusing on trend-following momentum across asset classes rather than explicit macroeconomic themes.
Each offers a path for traders or investors looking for diversification beyond traditional stock and bond portfolios, but the differences in design, management, and fee structures mean that investors should carefully match the product to their objectives and tolerance for risk.