Cash Flow as it Relates to Merger and LBO Valuation


In An Overview of the Leveraged Buyout (LBO) Financial Model, we discussed the basic main inputs into a private equity LBO model, assumptions, how debt and financing works, valuation multiples and financial metrics, and how each of these inputs affects outputs and the feasibility of a deal occurring.
Here, we are going to take a slightly different angle on the merger and leveraged buyout situation by looking at it from a valuation perspective via discounted cash flow analysis. (This model is taken from one designed by NYU Stern professor Aswath Damodaran. It can be found here.)
In this case, we will do the following:
- Estimate the cost of the deal
- Define how the deal will be financed
- Define future rates of information
- Define general information related to tax rates and cost of equity inputs
- Specify any assets to be sold to help finance the deal
- Enter information on current income statement
- Generate a cash flow
- Design a capital structure and costs of capital and equity
- Find our results
In the end, we will be able to value the firm bought out and also the equity within it.
Estimated Total Cost
As is the case with every model, we must start with certain inputs to form the foundation of our model in terms of what will feed into eventual outputs. We will input the following:
- New price per share
- Number of shares outstanding (in millions)
- Debt currently outstanding (in millions)
- Any additional costs (investment banking advising fees, etc.)
- Total cost of the deal
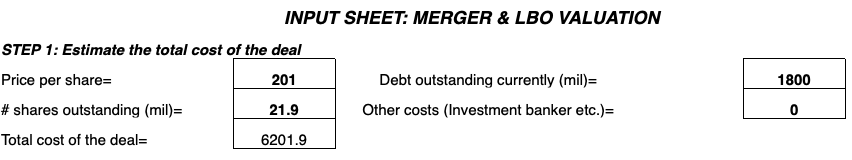
The total cost of the deal will be equal to:
Total cost = (Price per share) * (Number of shares outstanding) + (Debt outstanding) + (Additional costs)
Financing the Deal
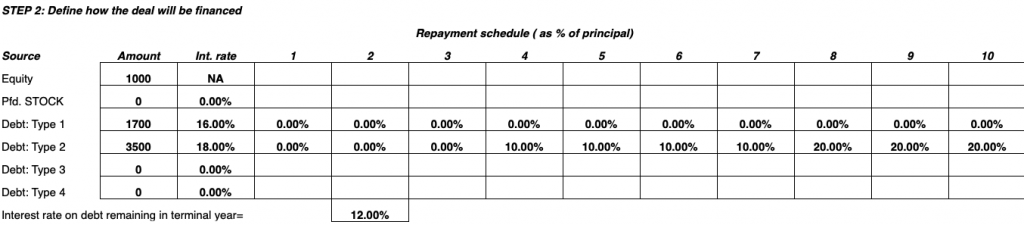
The deal can be financed from a range of options including equity, preferred stock, and other types of debt.
Equity is determined from the balance sheet by subtracting liabilities from assets.
Preferred stock denotes a form of stock that is pays out a fixed dividend with the payment receiving priority over that of common stock. Other forms of debt may include loans or bonds.
Interest rates are defined and differ based on the type of debt.
Define Rates of Future Growth
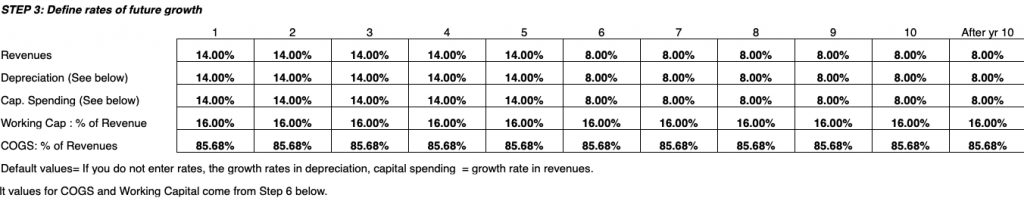
Here we will define basic growth rate inputs based on working capital as a percentage of revenue and income statement features including revenues, depreciation, capital spending, and costs of goods sold (COGS).
Define Tax Rate and Cost of Equity Inputs
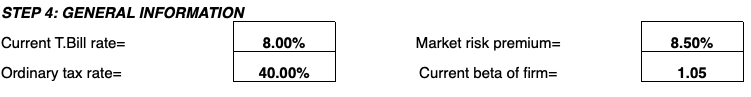 In the fourth step, we input the ordinary tax rate based on the taxable income of the business.
Moreover, in order to derive the cost of equity, we can apply the formula from the capital asset pricing model (CAPM):
Cost of Equity = Risk-free return + ß(Market premium)
The risk-free return is the theoretical rate of return on a risk-free investment.
As a proxy, the rate offered on long-term treasury bills is typically used, as an investment into US government bonds is about as close to a risk-free investment as there is, given the dollar is the world’s primary reserve currency.
The market premium represents the risk involved in investing in the market. In other words, it is the return that investors expect in return for investing in the market.
It typically varies from 3 to 8 percent depending on the economic environment and the methodology employed to derive it.
For example, if the interest rate on cash is zero, the 10-year yield is two percent, and the forward P/E ratio of stocks is 20x, then those yields are 0, 2, and 5 percent respectively. (For stocks, the “yield” is derived from taking the inverse of the P/E ratio.)
So the risk premium would be 5 percent, if it was the premium of choosing stocks as an investment over cash or 3 percent if taking stocks as an investment over the 10-year bond.
The market risk premium is a function of what you’re comparing.
The beta of the firm’s stock, ß, denotes how volatile it is relative to the overall market.
A measure of 1 is average; greater than 1 represents higher volatility; and less than 1 represents more stability.
After a firm goes through a merger or leveraged buyout, the stock nearly always assumes a greater beta.
Any large-scale or newsworthy occurrence in a firm’s history regularly sees a concomitant spike in its stock’s volatility due to the uncertainty surrounding it.
As a company matures and stabilizes, beta will normally decrease.
Assets to be Sold to Finance the Deal
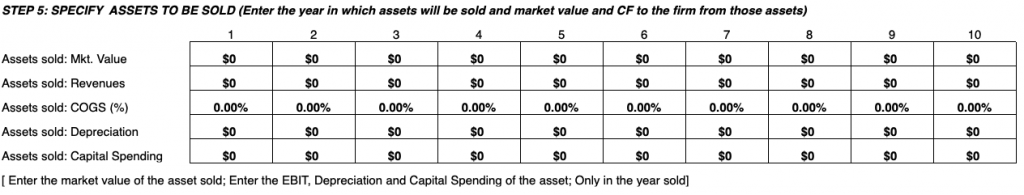
To help finance a merger/acquisition, assets from the company can be sold.
Anything that is sold as an asset will be quantified in value within the year it was sold according to market value, revenues, cost of goods sold (as a percentage), depreciation, and capital spending.
Current Income Statement Inputs
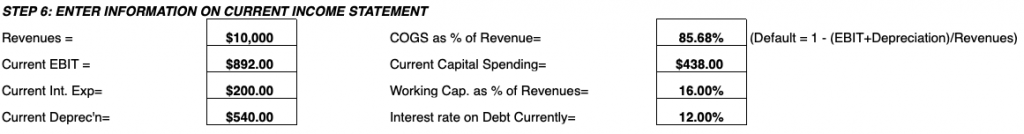
These values will feed directly into our cash flow analysis necessary for determining valuation later on.
These inputs include revenues, EBIT, interest expense, current depreciation, COGS as a percent of revenue, current capital spending, working capital as a percent of revenues, and current interest rate on debt.
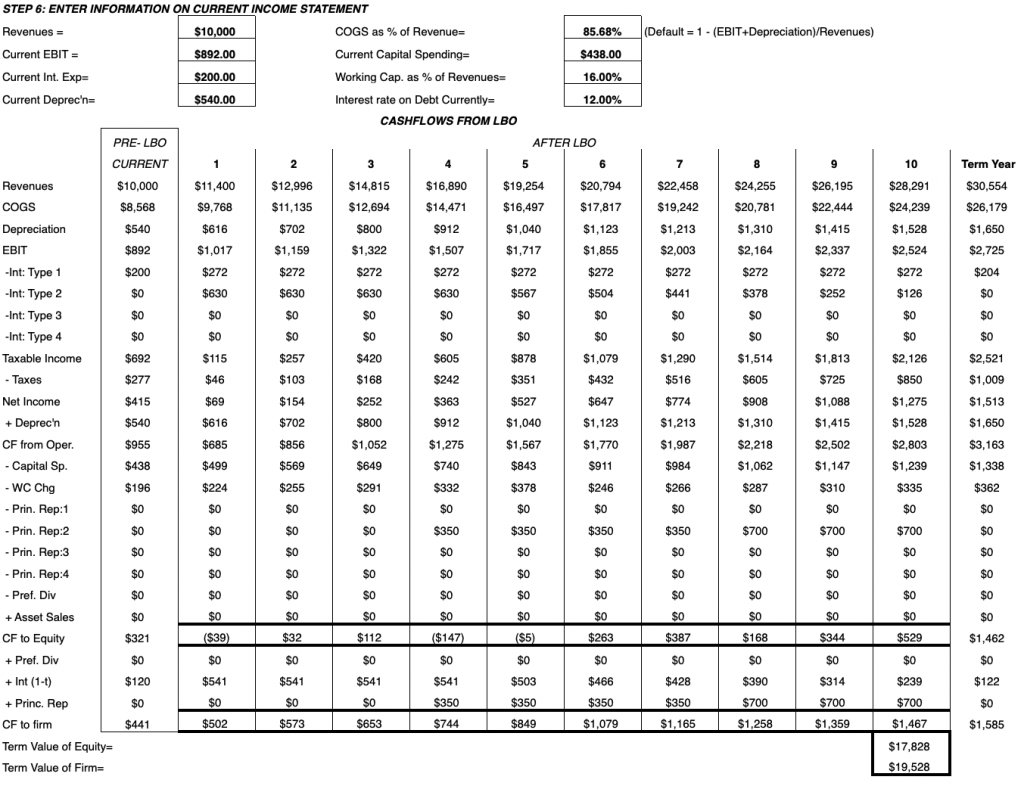
Cash Flow Analysis
For the cash flow analysis, we will take our pre-LBO income statement inputs and previous cash flow relevant inputs to generate a cash flow analysis.
From this we can determine present values of the cash flow, valuation estimates by discounting by the cost of equity, and also determine whether the proposed leveraged buyout deal should be accepted if the present value of cash flows exceeds that of the necessary investment.
From here we can also generate leverage analysis based on certain points in time and how the firm’s beta will change after the deal in the short- and long-term.
With that said, let’s dive into how to complete the cash flow:
Revenues
Calculated by taking the initial pre-leveraged buyout revenue and multiplying by 1 plus the annual growth rate in each year, minus any deductions:
Revenues = (Pre-LBO Revenue) * (1 + Annual growth rate) – (Assets sold in the form of revenues)
COGS
Calculated through pre-LBO revenue.
By default the calculation is:
COGS = 1 – (EBIT + Depreciation) / Revenues
For each individual year, n, we calculates COGS as:
COGS, n = (Revenues, n + Assets sold in the form of revenues) * (COGS as a percent of revenue) – (Assets sold in the form of revenues * Assets sold as a percent of revenue)
Depreciation
Calculated as:
Depreciation = (Current Depreciation (from income statement) – Depreciation from assets sold) * (1 + Depreciation rate)
EBIT
Earnings before income and taxes is formulated via:
EBIT = Revenues – COGS – Depreciation
Types of interest
These include the interest rates stemming from the types of debt taken on, as specified in a previous input section.
These are calculated by multiplying the debt type and the interest rate specific to it.
These are subsequently deducted from EBIT and they cut into earnings.
Taxable income
Taxable income = EBIT – Interest rate deductions
Taxes
Taxes = (Ordinary tax rate) * (Taxable income)
Net income
Net income = Taxable income – Taxes
Depreciation
Calculated again (and the same mathematical procedure as above) in order to add to net income to derive cash flow from operations.
Cash flow from operating activities
Net income + Depreciation
Cash flow to equity
Takes the sum of cash flow from operations, subtracts expenditures and adds asset sales.
Also known as FCFE, which is equal to:
CF to Equity = CF from Operations – Capital spending – ∆Working capital – Repayment of debts + Asset sales
Cash flow to firm
Flows directly from cash flow to equity.
Also known as FCFF:
CF to Firm = CF to Equity + Preferred stock dividends + Interest (1 – Tax rate) + Principal repayments
Terminal Value of Equity
Calculating the terminal value of equity is essentially the higher goal of our cash flow analysis.
Here we are discounting all future cash flows to equity based on the cost of equity and our projected long-term growth rate:
Terminal Value of Equity = (Cash flow to equity in terminal year) / (Cost of equity – Revenue growth rate in terminal year)
Terminal Value of Firm
Equal to the terminal value of the firm plus debts minus any repayments:
Terminal Value of Firm = Terminal Value of Equity + ∑(Debts Outstanding – Debt Principal Repaid)
Capital Structure
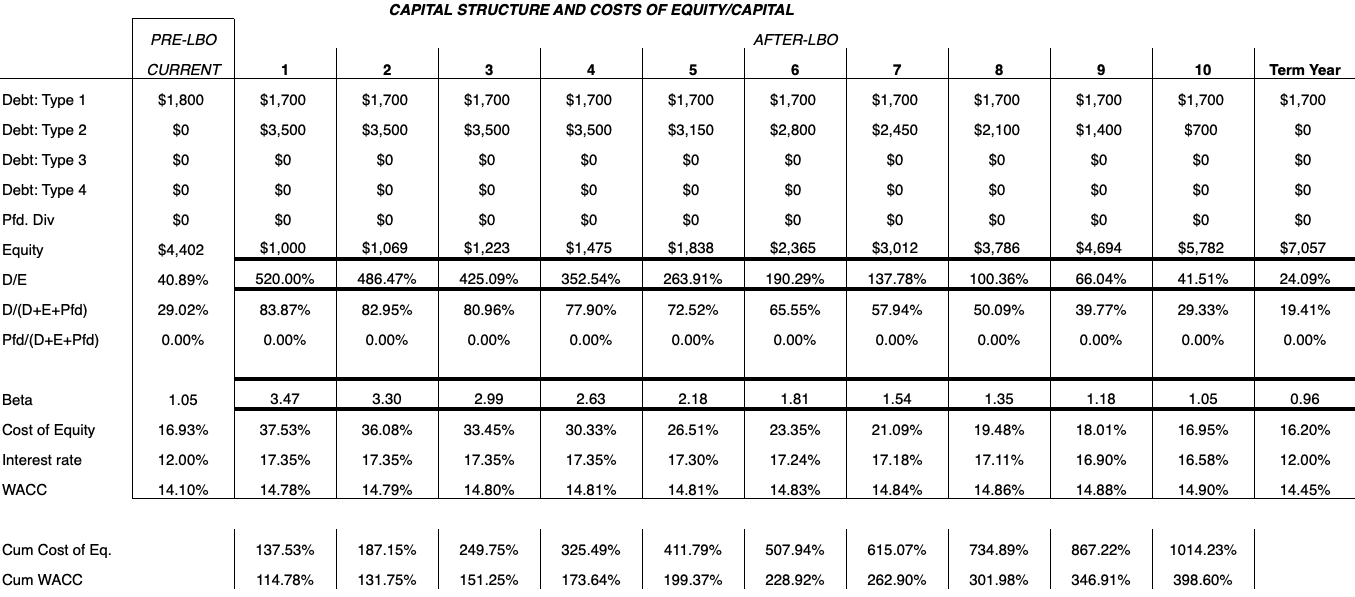
The valuation derived from the cash flow is determined via discount rates related to the capital structure of a firm.
The valuation at the end can help us determine whether to accept or reject a deal in the end.
We can keep track of the capital structure by year and monitor how it changes accordingly.
We will go through each component individually:
Debt type
Refers to the type of debt that might be used to help finance the deal.
On this spreadsheet we have room for four types, although there could be more or less.
It includes debts outstanding minus any repayments made on the principal.
Preferred Dividends
Money paid to shareholders owning preferred stock.
Debt-to-equity (D/E) Ratio
A simple metric of financial health. The lower the ratio the better.
D / (D+E+Pfd)
Proportion of debt relative to the sum of debt, equity, and preferred stock dividend payouts. Determines what percentage of the deal is financed by debt.
Pfd / (D+E+Pfd)
Proportion of preferred stock dividend payouts to the sum of debt, equity, and preferred stock payouts. Determines what percentage of the deal is financed through offering preferred stock.
Beta
Determines the volatility of the stock. After a merger or leveraged buyout, a company’s stock will increase its beta, representing higher levels of volatility.
As the new company matures and stabilizes, beta will naturally tend to shrink.
Equal to:
Beta, current year = [(Pre-LBO Beta) / (1 + (D/E Ratio, beginning) * (1 – Tax rate))] * (1 + (D/E Ratio, current year) * (1 – Tax rate))
Cost of Equity
Rate of return that investors expect to obtain for investing capital into that company.
Using the Capital Asset Pricing Model (CAPM), cost of equity is equal to:
Cost of Equity = Risk-free Rate + ß*(Market-risk premium)
As beta decreases, cost of equity will also decrease and prove beneficial to the value of the company and the likelihood of a deal being financially feasible at least with respect to equity investors.
Interest Rate
An average interest rate of all debts outstanding.
Figured by the amount of debt multiplied by its interest rate added to the next amount of debt multiplied by its interest rate and so on divided by the aggregate sum of all debts outstanding.
Interest Rate = ∑(Debts * Interest rate specific to each) / ∑(Debts)
WACC
The weighted average cost of capital is a measure that takes into account the relative weights of each component of a company’s capital structure.
It represents the minimum return on an asset base a company must achieve before its capital providers decide to invest elsewhere.
If a company is financed by only debt and equity, it is equal to the relative weights of debt and equity within the company:
WACC = (Debt / (Debt + Equity)) * Cost of Debt + (Equity / (Equity + Debt)) * Cost of Equity
Where:
Cost of debt = (Risk-free rate + Credit risk rate) * (1 – Tax rate)
Cost of equity = Risk-free rate + ß*(Market-risk premium)
WACC calculations will be specific to each type of firm and financing deal.
The more intricate the capital structure of the firm, the more tedious the WACC calculation.
And lastly, to determine the present value of our cash flows with respect to equity investors and to all investors, we need to tabulate two more metrics: the cumulate cost of equity and cumulative WACC.
These measures are merely the cost of equity and WACC added, respectively:
Cumulative Cost of Equity = Cost of Equity + 1
Cumulative WACC = WACC + 1
Calculating PV of Cash Flows and Deciding Whether to Accept the Deal
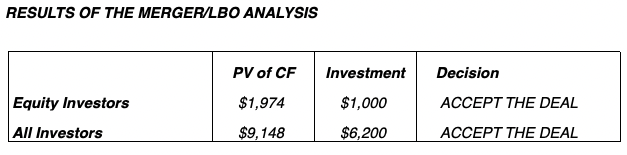
The final and most relevant output of this model is the present value of cash flows with respect to both equity investors and all investors in the deal.
If these values are greater than the value of the initial investment, the deal would be worth accepting. (This level of initial investment will be stated alongside the present value of cash flows.)
Cash flows must project to be healthy enough to pay off the cost of the deal and expect the company to net a rate of return to go ahead with the leveraged buyout.
As we discussed in articles regarding the FCFF and FCFE valuation models, FCFF denotes the present value of all future cash flows with respect to all claim holders to the firm, while FCFE represents the present value of all future cash flows with respect to equities investors only.
Accordingly, we will compare the potential leveraged buyout deal using both approaches – with respect to total investment in the project and with respect to equities investors only.
They can be calculated as follows:
PV of Cash Flow to Equity Investors = ∑(FCFE / Cumulative Cost of Equity) + (Terminal Value of Equity / Cumulative Cost of Equity)
PV of Cash Flow to All Investors = ∑(FCFF / Cumulative WACC) + (Terminal Value of the Firm / Cumulative WACC)
As stated, if these cash flow values exceed the investment put into the project with respect to each form of claimholder, then the deal should be accepted.
If they come up lower than the investment total, then the deal should be rejected due to insufficient cash flow.
Additional Features
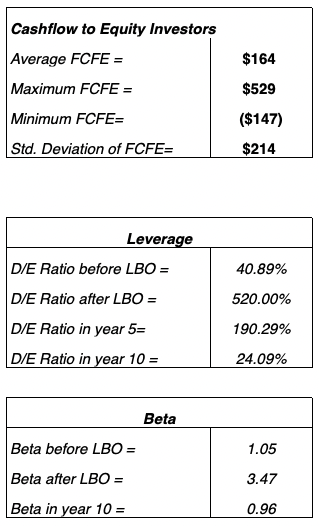
There are also four tables at the bottom of the spreadsheet.
One denotes beta of the company’s share before the leveraged buyout, immediately after, and in year ten after the LBO has taken place.
There is also a cash flow chart with respect to both FCFE and FCFF for quick comparison of outcomes.
Results are displayed for average, maximum, minimum, and standard deviation values.
Leverage is also calculated based on debt-to-equity (D/E) ratio, before the LBO, after the LBO, after year five, and after year 10.
How Inputs Affect Outputs
This is generally what one would consider to be the most important part of each article when going through how to build or understand each model.
How do the inputs we entered affect the associated outputs?
I will go through each one in summative form with brief explanations:
Price per share
An increase in the price per share decreases the likelihood of the deal.
Part of the cost of the deal is formed through market capitalization (price per share * number of fully diluted shares outstanding).
Hence, if market cap increases, it adds to the cost of a deal and share price factors in directly to the cost of buying out the company.
Diluted shares outstanding
Since diluted shares outstanding contributes to market cap, any raise in quantity will increase the cost of the deal and decrease the chance of a deal being workable.
Debt outstanding
The higher the outstanding debt of the firm, the lower the beta of the stock, which lowers cost of equity (return expected for investing in shares of the company) and hence lowers FCFE.
The mechanics behind this is due to the fact that FCFE includes net borrowing, whereas FCFF does not.
FCFF does not include debt as that doesn’t constitute a revenue source raised by the firm.
However, it can be used to compensate equity shareholders. And the more money for equity investors, the higher the FCFE.
Less debt would therefore result in a lower valuation and decreases the likelihood of an LBO deal occurring.
Advising fees
Advising fees paid to investment banks and consulting firms would have no real tangible effect.
Private equity firms specialize in leveraged buyouts and may not extensively consult with outside organizations to do work that could be completed internally.
Equity
The greater the amount of equity used to finance the deal, the lesser the probability for equity investors, given this takes money away from them.
This holds the effect of decreasing leverage in the deal. Naturally, the present value of cash flows with respect to equity investors would be most notably affected.
For all investors, however, it would be a slight positive given the lessened debt-to-equity ratio.
Leverage would decrease and extra equity would make the deal safer as a consequence.
Debt
Like equity, this one doesn’t have a clear-cut answer because it technically has two different answers.
Extra debt will increase FCFE given extra debt can be used to pay shareholders if the firm’s board of directors chose to do so.
However, extra debt as a whole is generally considered a negative and will have the effect of decreasing FCFF through interest payment.
So more debt to finance the deal would be considered a positive for equity investors and a negative for all investors as a whole.
Preferred Stock
Issuing preferred stock would make the deal more palatable to both investor groups, as it would raise capital for the deal IF dividends were issued.
If no dividends are issued, then the deal would be less palatable for both types of investors.
However, the results aren’t precisely equal. For the entire investor group, the deal would become far less likely relative to the equity investor group.
This is due to the change in the nature of the weighted average cost of capital (WACC). This serves as the discount rate for FCFF valuation.
When preferred stock is added to the capital structure it must be weighed in and will consequently increase the WACC.
Any increase in WACC denotes a higher expected return and decreases the present value estimation of future cash flows. This decreases FCFF valuation.
It has a slight effect on FCFE through the cost of equity influence, but isn’t nearly as pronounced.
Other Debt Types
Other debt types would come in the form of bonds, for example.
In general, the higher the interest rate on these, the more likely the transaction for all investors (positive change in WACC).
But less likely for equity-only investors as it would decrease cash flow to equity by decreasing taxable income through lower interest earnings.
Future Rates of Growth
Higher revenue decreases cash flow in our model by increasing the change in working capital.
Depreciation expenses increase cash flow (it decreases net income, but is not a cash expense, so we add it back to offset for that effect).
Capital spending decreases cash flow as a cash outlay.
Increased working capital as a percent of revenues will decrease cash flow (working capital (assets minus liabilities) is subtracted from cash flow).
A higher cost of goods sold as a percent of revenues decreases cash outflow, given that means we have a proportionally higher EBIT or depreciation relative to revenues.
COGS as a percent of revenues is calculated as:
COGS as % of revenues = 1 – (EBIT + Depreciation) / Revenues
Current Treasury Bill Rate
The lower the current risk-free rate, the lower the cost of equity (i.e., FCFE’s discount rate) and the higher the cash flow.
This, of course, increases the likelihood of a deal taking place.
Market Risk Premium
Another component of the CAPM’s derivation of the cost of equity.
The higher the market risk premium, the higher the cost of equity, and the lower the cash flow.
Beta of the Firm
A higher beta also increases the cost of equity, and lowers cash flow.
Ordinary Tax Rate
A higher tax rate decreases cash availability (outflow) and makes a deal less likely.
Assets Sold
Selling assets is beneficial for a leveraged buyout deal, as it helps fund the transaction.
Revenues
As covered previously, increased revenues decreases the likelihood of an LBO through its effect on increasing working capital.
Current EBIT
Increased earnings before interest and taxes increases cash flow.
Current Interest Expenses
Has no effect on cash flow.
Current Depreciation
Increases cash flow.
COGS as a % of Revenue
The lower, the higher the cash flow, as it denotes higher earnings and/or depreciation inputs relative to revenues.
Current Capital Spending
This one is plainly intuitive.
The more that is being spent, the less cash you have, decreasing cash flow from operations.
Working Capital as a % of Revenues
No effect on cash flow.
Interest Rate on Debt Currently
No effect on cash flow.
Conclusion
This leveraged buyout model provides a look at how various inputs affect cash flow and the consequent feasibility of an LBO deal occurring.
The model used for this article is not adequate for a genuine leveraged buyout, but highlights the general form in terms of an academic exercise.
It could, however, be appropriate for “quick and dirty” cash flow and LBO feasibility determinations for a real-life scenario.