Bitcoin in a Balanced Portfolio


We’re looking at the topic of Bitcoin in the context of a balanced portfolio.
For this, we’re looking at standard portfolios that are a mix of diversified stocks and bonds, with 15% gold.
Then we add Bitcoin in allocations of 10%, 5%, and 3% and look at the results.
After that, we look more carefully at 3%, 2%, and 1% Bitcoin.
Finally, we look at risk parity and cVaR (tail risk) optimization exercises.
Key Takeaways – Bitcoin in a Balanced Portfolio
- Portfolios that are better balanced tend to capture less upside (before factoring in levering/”engineering” consideration), but far less downside, improving compounding. Can Bitcoin help that?
- Small Bitcoin slices show some evidence of boosting returns without necessarily producing deeper max drawdowns.
- Higher BTC – looking backwards – maximized growth, but volatility and risk concentration jumped.
- 1-3% BTC may still improved outcomes versus stocks alone at lower risk.
- Low correlations – on average – to stocks, bonds, and gold added some evidence of modest diversification.
- Even tiny BTC weights can consume big risk.
- Size by risk, not dollars.
- 1-2% BTC ≈ ~10% of portfolio risk in a 60/40.
- Rebalance on schedule or as necessary (consider taxes and transaction costs). Let rules trim winners and add after selloffs.
- Keeping BTC as a satellite sleeve seems to be most prudent, if you choose to add it at all.
- Core stays diversified stocks, bonds, and gold.
- Overall: 0-3% BTC for the average investor may be most prudent, depending on what else is in the portfolio and individual risk tolerances.
Portfolios
Note that in this article we will be looking at Bitcoin for what it’s been looking backward.
From 2016-2025, it averaged ~64% compounded annual returns and a volatility (expressed as a standard deviation) of 122%.
Will Bitcoin, going forward, produce a risk-adjusted risk premium similar to equities and bonds, and will it act differently than traditional asset classes (i.e., produce diversification value)?
That’ll be the key question for institutions.
Given Bitcoin’s limited institutional interest and widespread speculative activity, we don’t really know.
There’s been more institutional interest, but it will still take a while before pension funds, sovereign wealth funds, central banks, and other institutions allocate to it in any meaningful way.
Over time, both the return and the volatility of Bitcoin have shown evidence of declining, as more buyers have entered and more stable pools of capital have taken interest.
To what range Bitcoin will settle in – like what we know for stocks, bonds, and gold based on their history and cause-and-effect drivers – is still unknown.
Portfolio Assets
We’re going to use:
- SPY (Stocks/S&P 500)
- GBTC (Bitcoin trust)
- VBMFX (Bonds)
- GLD (Gold)
Stats over this 10-year period:
| Ticker | Name | CAGR | Stdev | Best Year | Worst Year | Max Drawdown | Sharpe Ratio | Sortino Ratio |
|---|---|---|---|---|---|---|---|---|
| SPY | SPDR S&P 500 ETF | 14.96% | 15.20% | 31.22% | -18.17% | -23.93% | 0.86 | 1.33 |
| GBTC | Grayscale Bitcoin Trust ETF | 64.34% | 121.78% | 1,664.67% | -82.10% | -83.43% | 0.80 | 2.25 |
| VBMFX | Vanguard Total Bond Market Index Inv | 1.85% | 5.11% | 8.61% | -13.25% | -17.57% | -0.03 | -0.04 |
| GLD | SPDR Gold Shares | 14.00% | 14.26% | 52.03% | -4.15% | -18.08% | 0.85 | 1.66 |
Note that we expect the returns on stocks, BTC, and gold to all fall relative to these figures, and the returns on bonds to slightly increase.
We have three portfolios with BTC in amounts of 10%, 5%, and 3%, trading off bonds for BTC and vice versa.
Portfolio 1: 10% Bitcoin
| Ticker | Name | Allocation |
|---|---|---|
| SPY | SPDR S&P 500 ETF | 40.00% |
| GBTC | Grayscale Bitcoin Trust ETF | 10.00% |
| VBMFX | Vanguard Total Bond Market Index Inv | 35.00% |
| GLD | SPDR Gold Shares | 15.00% |
Portfolio 2: 5% Bitcoin
| Ticker | Name | Allocation |
|---|---|---|
| SPY | SPDR S&P 500 ETF | 40.00% |
| GBTC | Grayscale Bitcoin Trust ETF | 5.00% |
| VBMFX | Vanguard Total Bond Market Index Inv | 40.00% |
| GLD | SPDR Gold Shares | 15.00% |
Portfolio 3: 3% Bitcoin
| Ticker | Name | Allocation |
|---|---|---|
| SPY | SPDR S&P 500 ETF | 40.00% |
| GBTC | Grayscale Bitcoin Trust ETF | 3.00% |
| VBMFX | Vanguard Total Bond Market Index Inv | 42.00% |
| GLD | SPDR Gold Shares | 15.00% |
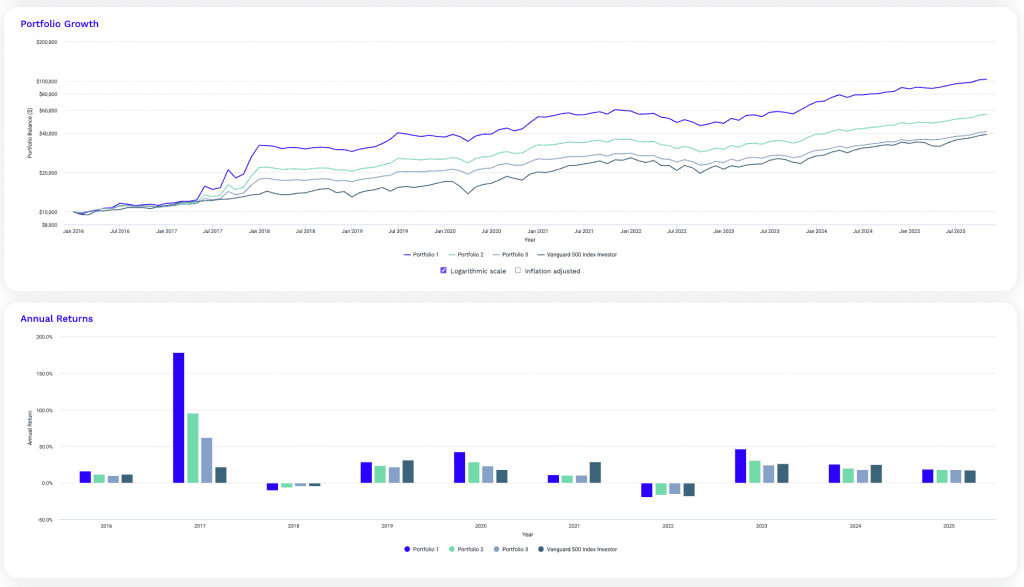
Performance Summary
| Metric | Portfolio 1 | Portfolio 2 | Portfolio 3 | Vanguard 500 Index Investor |
|---|---|---|---|---|
| Start Balance | $10,000 | $10,000 | $10,000 | $10,000 |
| End Balance | $103,635 | $55,670 | $41,123 | $39,178 |
| Annualized Return (CAGR) | 26.84% | 19.08% | 15.46% | 14.90% |
| Standard Deviation | 24.27% | 15.66% | 12.02% | 15.24% |
| Best Year | 178.28% | 95.22% | 62.00% | 31.33% |
| Worst Year | -19.60% | -16.47% | -15.22% | -18.23% |
| Maximum Drawdown | -24.57% | -20.34% | -19.15% | -23.95% |
| Sharpe Ratio | 1.01 | 1.06 | 1.08 | 0.85 |
| Sortino Ratio | 2.84 | 2.54 | 2.27 | 1.32 |
| Benchmark Correlation | 0.41 | 0.55 | 0.67 | 1.00 |
The three portfolios start at $10,000 and end at $103,635, $55,670, and $41,123, all beating the S&P 500’s $39,178.
So, more Bitcoin, more growth.
Portfolio 1, with the largest BTC sleeve, compounds at 26.84% a year, above the benchmark’s 14.90%.
That lift comes with higher volatility, 24.27% versus 15.24% for the S&P 500, and extreme upside in the best year, 178.28%.
Drawdowns stay comparable. Portfolio 1’s -24.57% trough is close to the market’s -23.95%.
Risk-adjusted metrics hold up. Sharpe is 1.01 for Portfolio 1, 1.06 for Portfolio 2, and 1.08 for Portfolio 3, all ahead of the index at 0.85.
Sortino tells the same story. Lower Bitcoin allocations trade some return for smoother rides.
Correlations to the S&P 500 run 0.41, 0.55, and 0.67, meaning diversification improves as BTC rises.
Net, a small Bitcoin sleeve boosted returns without materially deeper max drawdowns, while 3-5% appear to be best for efficiency rather than the 10%, which boosts return but can elevate risks.
Monthly Correlations
| Ticker | Name | SPY | GBTC | VBMFX | GLD | Portfolio 1 | Portfolio 2 | Portfolio 3 | Vanguard 500 Index Investor |
|---|---|---|---|---|---|---|---|---|---|
| SPY | SPDR S&P 500 ETF | 1.00 | 0.24 | 0.39 | 0.09 | 0.42 | 0.55 | 0.67 | 1.00 |
| GBTC | Grayscale Bitcoin Trust ETF | 0.24 | 1.00 | 0.16 | 0.12 | 0.83 | 0.75 | 0.67 | 0.24 |
| VBMFX | Vanguard Total Bond Market Index Inv | 0.39 | 0.16 | 1.00 | 0.44 | 0.32 | 0.43 | 0.52 | 0.38 |
| GLD | SPDR Gold Shares | 0.09 | 0.12 | 0.44 | 1.00 | 0.25 | 0.32 | 0.38 | 0.09 |
Bitcoin’s strength in a balanced portfolio comes from its – on average – low correlations with traditional assets.
Over the period, GBTC correlated only 0.24 with the S&P 500, 0.16 with bonds, and 0.12 with gold, meaning it often – but not always – moved independently.
Stocks and bonds were moderately linked (0.39), while gold showed little connection to equities (0.09).
As a result, portfolios blending these assets stayed less synchronized with market swings.
The higher the bitcoin weight, the lower the overall correlation to the S&P 500 (0.42, 0.55, and 0.67 for Portfolios 1-3), showing that Bitcoin acted as somewhat of a diversification engine despite its volatility.
Its track record as a way to offset equity drawdowns is nonetheless less established.
Because Bitcoin and most crypto is largely considered a “liquidity” asset – i.e., not supported by underlying earnings – at the macro level it requires the production of new liquidity to get a higher price.
So, for institutional investors and those wanting diversification assets with a reliable risk premium, the concern is that it will correlate with speculative equities and not act as a stabilizer when other asset classes decline.
Portfolio Risk Decomposition
| Ticker | Name | Portfolio 1 | Portfolio 2 | Portfolio 3 |
|---|---|---|---|---|
| SPY | SPDR S&P 500 ETF | 18.36% | 35.29% | 48.04% |
| GBTC | Grayscale Bitcoin Trust ETF | 73.57% | 48.21% | 29.08% |
| VBMFX | Vanguard Total Bond Market Index Inv | 4.14% | 9.22% | 13.23% |
| GLD | SPDR Gold Shares | 3.93% | 7.29% | 9.64% |
| Risk attribution decomposes portfolio risk into its constituent parts and identifies the contribution to overall volatility by each of the assets. | ||||
Risk decomposition shows how each asset contributed to total portfolio volatility.
In the most aggressive mix, Portfolio 1, Bitcoin (GBTC), which accounted for only 10% of assets by dollar allocation, accounted for a massive 73.57% of overall risk.
That dominance reflects Bitcoin’s inherent volatility and its ability to drive returns even from a small allocation.
The S&P 500 ETF (SPY) contributed 18.36%, while bonds and gold played minor, stabilizing roles at 4.14% and 3.93%, respectively.
As Bitcoin’s weight dropped, its influence on total risk fell sharply.
In Portfolio 2, with 5% Bitcoin, risk contribution declined to 48.21% (still very high), while equities’ share nearly doubled to 35.29%.
In the most conservative mix, Portfolio 3 (3% Bitcoin), equities began to dominate risk at 48.04%, and Bitcoin contributed 29.08% – still high considering how low the allocation is.
These show the asymmetric nature of Bitcoin exposure: small allocations can still dominate portfolio risk due to its high volatility.
However, as exposure decreases, portfolio risk becomes more evenly distributed across traditional assets.
Bonds and gold gradually assume a larger role in dampening swings, bringing the portfolio closer to a traditional risk balance.
In short, a small amount of Bitcoin can meaningfully change risk dynamics your portfolio, and requires careful sizing.
Risk and Return Metrics
| Metric | Portfolio 1 | Portfolio 2 | Portfolio 3 | Vanguard 500 Index Investor |
|---|---|---|---|---|
| Arithmetic Mean (monthly) | 2.22% | 1.56% | 1.26% | 1.26% |
| Arithmetic Mean (annualized) | 30.12% | 20.43% | 16.26% | 16.22% |
| Geometric Mean (monthly) | 2.00% | 1.47% | 1.21% | 1.16% |
| Geometric Mean (annualized) | 26.84% | 19.08% | 15.46% | 14.90% |
| Standard Deviation (monthly) | 7.01% | 4.52% | 3.47% | 4.40% |
| Standard Deviation (annualized) | 24.27% | 15.66% | 12.02% | 15.24% |
| Downside Deviation (monthly) | 2.42% | 1.81% | 1.58% | 2.75% |
| Maximum Drawdown | -24.57% | -20.34% | -19.15% | -23.95% |
| Benchmark Correlation | 0.41 | 0.55 | 0.67 | 1.00 |
| Beta(*) | 0.66 | 0.57 | 0.53 | 1.00 |
| Alpha (annualized) | 16.65% | 10.19% | 7.21% | 0.00% |
| R2 | 17.15% | 30.26% | 44.47% | 100.00% |
| Sharpe Ratio | 1.01 | 1.06 | 1.08 | 0.85 |
| Sortino Ratio | 2.84 | 2.54 | 2.27 | 1.32 |
| Treynor Ratio (%) | 37.13 | 29.37 | 24.77 | 12.99 |
| Calmar Ratio | 6.57 | 5.32 | 4.54 | 2.72 |
| Modigliani–Modigliani Measure | 17.50% | 18.28% | 18.66% | 15.12% |
| Active Return | 11.95% | 4.18% | 0.57% | N/A |
| Tracking Error | 22.69% | 14.66% | 11.51% | N/A |
| Information Ratio | 0.53 | 0.29 | 0.05 | N/A |
| Skewness | 2.46 | 1.68 | 0.88 | -0.50 |
| Excess Kurtosis | 9.78 | 5.96 | 2.64 | 0.66 |
| Historical Value-at-Risk (5%) | 5.51% | 3.74% | 3.57% | 7.06% |
| Analytical Value-at-Risk (5%) | 5.98% | 4.08% | 3.50% | 5.98% |
| Conditional Value-at-Risk (5%) | 7.86% | 6.17% | 5.38% | 9.31% |
| Upside Capture Ratio (%) | 104.59 | 79.81 | 68.39 | 100.00 |
| Downside Capture Ratio (%) | 42.67 | 42.76 | 42.99 | 100.00 |
| Safe Withdrawal Rate | 34.88% | 24.77% | 20.55% | 17.82% |
| Perpetual Withdrawal Rate | 20.11% | 14.40% | 11.47% | 11.00% |
| Positive Periods | 74 out of 118 (62.71%) | 79 out of 118 (66.95%) | 79 out of 118 (66.95%) | 84 out of 118 (71.19%) |
| Gain/Loss Ratio | 1.74 | 1.43 | 1.38 | 0.83 |
| * Vanguard 500 Index Investor is used as the benchmark for calculations. Value-at-risk metrics are monthly values. | ||||
The risk and return metrics paint a clear picture of how adding Bitcoin reshapes both performance and behavior in a balanced portfolio.
Over nearly a decade, even small allocations to Bitcoin produced higher returns, better downside efficiency, and more favorable risk-adjusted profiles, despite increased volatility.
Starting with raw returns, Portfolio 1 (10% Bitcoin) achieved an annualized 26.84% gain, far ahead of the S&P 500’s 14.90%.
Portfolio 2 (5% Bitcoin) returned 19.08%, while Portfolio 3 (3% Bitcoin) came in at 15.46%, still slightly above the index.
These gains came with a step up in volatility, from 24.27% for Portfolio 1 to 12.02% for Portfolio 3, compared with 15.24% for the S&P 500.
Despite that, maximum drawdowns stayed in check: -24.57% versus -23.95% for the benchmark.
The real story is in the risk-adjusted measures.
The Sharpe ratio improved across all mixed portfolios (1.01, 1.06, and 1.08, compared with the S&P 500’s 0.85), indicating stronger returns per unit of risk.
Sortino ratios, which emphasize downside protection, tell a similar story: 2.84, 2.54, and 2.27, versus the market’s 1.32.
These portfolios were riskier with BTC but were nonetheless more efficient. The Treynor and Calmar ratios confirm this advantage, with Portfolio 1 showing more than triple the benchmark’s Calmar value, meaning higher return per drawdown endured.
From a diversification standpoint, correlations to the market ranged from 0.41 to 0.67, depending on Bitcoin’s weight.
That low linkage explains much of the improved efficiency. The 10% Bitcoin mix captured 104.59% of the market’s upside but only 42.67% of its downside, which is a nice asymmetric payoff that traditional (say, 60/40) portfolios rarely achieve.
Alpha generation, returns not explained by the market, were also 16.65%, 10.19%, and 7.21% per year across the three portfolios, while the S&P 500 sat at zero by definition.
Even though tracking error rose (reflecting more deviation from the benchmark), information ratios remained positive, showing that the extra volatility was rewarded.
Higher skewness and kurtosis values signal that Bitcoin-heavy portfolios had fatter right tails, occasional huge gains, while still limiting severe losses.
Value-at-Risk and Conditional VaR both show smaller downside risk percentages than the benchmark, a sign of better tail control despite Bitcoin’s reputation for volatility.
Overall, Bitcoin’s addition improved returns, bettered efficiency, and increased asymmetry – as long as you were okay taking the extra risk.
Small allocations shifted portfolios from average to exceptional without proportionally increasing risk, an outcome that challenges conventional assumptions about volatility and prudence.
So for those looking for a traditional, balanced portfolio with Bitcoin as a diversifier or return enhancer, they’re probably looking at a lower single-digit percentage, if they choose to have any at all.
Since adding so little Bitcoin/crypto can add a lot in terms of risk, let’s go even further looking at the 3% allocation alongside 2% and 1%.
Portfolios
Portfolio 1
| Ticker | Name | Allocation |
|---|---|---|
| SPY | SPDR S&P 500 ETF | 40.00% |
| GBTC | Grayscale Bitcoin Trust ETF | 3.00% |
| VBMFX | Vanguard Total Bond Market Index Inv | 42.00% |
| GLD | SPDR Gold Shares | 15.00% |
Portfolio 2
| Ticker | Name | Allocation |
|---|---|---|
| SPY | SPDR S&P 500 ETF | 40.00% |
| GBTC | Grayscale Bitcoin Trust ETF | 2.00% |
| VBMFX | Vanguard Total Bond Market Index Inv | 43.00% |
| GLD | SPDR Gold Shares | 15.00% |
Portfolio 3
| Ticker | Name | Allocation |
|---|---|---|
| SPY | SPDR S&P 500 ETF | 40.00% |
| GBTC | Grayscale Bitcoin Trust ETF | 1.00% |
| VBMFX | Vanguard Total Bond Market Index Inv | 44.00% |
| GLD | SPDR Gold Shares | 15.00% |
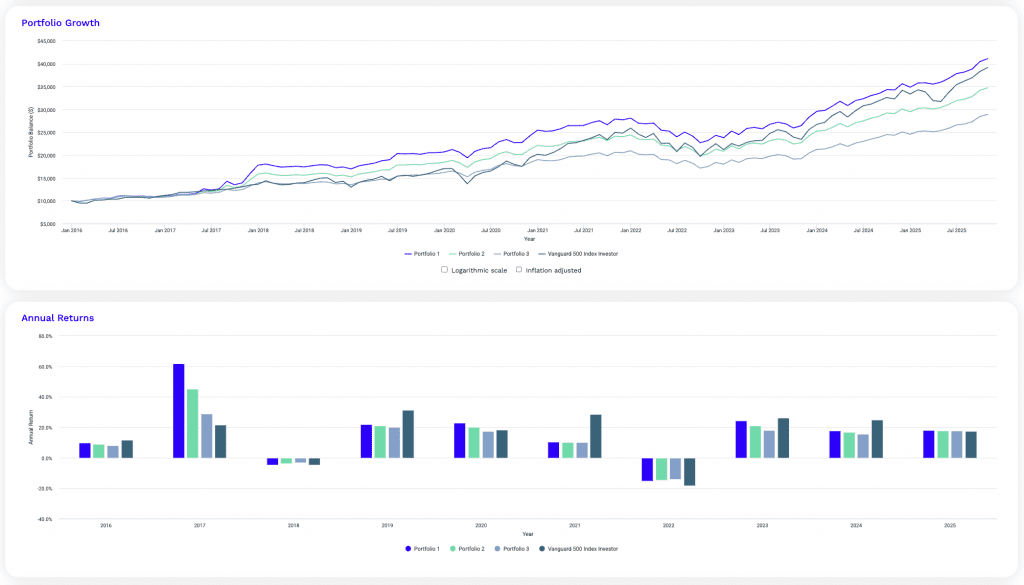
Performance Summary
| Metric | Portfolio 1 | Portfolio 2 | Portfolio 3 | Vanguard 500 Index Investor |
|---|---|---|---|---|
| Start Balance | $10,000 | $10,000 | $10,000 | $10,000 |
| End Balance | $41,123 | $34,743 | $28,924 | $39,178 |
| Annualized Return (CAGR) | 15.46% | 13.50% | 11.41% | 14.90% |
| Standard Deviation | 12.02% | 10.30% | 8.84% | 15.24% |
| Best Year | 62.00% | 45.38% | 28.77% | 31.33% |
| Worst Year | -15.22% | -14.60% | -13.97% | -18.23% |
| Maximum Drawdown | -19.15% | -18.63% | -18.11% | -23.95% |
| Sharpe Ratio | 1.08 | 1.08 | 1.03 | 0.85 |
| Sortino Ratio | 2.27 | 2.06 | 1.77 | 1.32 |
| Benchmark Correlation | 0.67 | 0.75 | 0.84 | 1.00 |
These three portfolios show how small allocations to Bitcoin can subtly improve a traditional balanced portfolio without dramatically increasing risk.
Each portfolio kept the core mix of 40% US equities (SPY), bonds (VBMFX) around 40-44%, and gold (GLD) at 15%, with Bitcoin’s weight varying between 3%, 2%, and 1%.
Over the nearly ten-year test period (2016–2025), all three portfolios performed competitively with the S&P 500, but with less volatility and smaller drawdowns.
Portfolio 1, holding 3% Bitcoin, achieved the highest overall return, compounding at 15.46% per year versus the S&P 500’s 14.90%. That small 3% Bitcoin sleeve lifted the end balance to $41,123, slightly above the index’s $39,178, while carrying only 12.02% volatility compared with the S&P’s 15.24%.
In simple terms, it delivered similar returns with about 20% less risk.
Portfolios 2 and 3 followed the same pattern, just with smaller Bitcoin exposure. As the Bitcoin share decreased from 3% to 2% and 1%, annualized returns tapered to 13.50% and 11.41%, respectively, while volatility declined further to 10.30% and 8.84%.
This trade-off is the essence of modern portfolio construction: each percentage of Bitcoin added slightly boosted growth potential, but removing it made the ride smoother.
Even the most conservative mix (1% Bitcoin) still had a higher Sharpe ratio (1.03) than the benchmark (0.85), meaning better returns per unit of risk.
Across all versions, drawdowns remained contained. The worst peak-to-trough losses ranged from -19.15% to -18.11%, shallower than the S&P’s -23.95%.
That stability comes from diversification. Is Bitcoin a “great” diversifier? No. But there is some evidence looking at returns, that it can diversify to an extent.
Bitcoin, bonds, and gold rarely move in the same direction as equities all the time, so they may cushion the impact during market downturns.
The thing is, can you trust Bitcoin to not go haywire in a downturn?
Because it’s not the average outcomes that you need to worry about, but what happens when there’s widespread market stress?
Based on the data we do have, each portfolio’s Sharpe and Sortino ratios were consistently higher than the S&P 500’s.
Portfolio 1’s Sharpe ratio of 1.08 and Sortino of 2.27 show that the mix generated stronger and steadier returns, even with a volatile asset like Bitcoin in play.
The correlations reinforce the diversification benefit. Portfolio 1 correlated 0.67 with the S&P 500, Portfolio 2 0.75, and Portfolio 3 0.84, meaning the more Bitcoin included, the less the portfolio moved in sync with the broader market.
In short, adding even 1-3% Bitcoin to a balanced mix of stocks, bonds, and gold modestly improved long-term returns, reduced drawdowns, and improved risk-adjusted performance.
So our takeaway is that a tiny slice provided measurable diversification and better efficiency without meaningfully increasing risk.
Portfolio 3 vs. Vanguard 500 Index Investor
| Market Type | Occurrences | Average Active Return | |||||
|---|---|---|---|---|---|---|---|
| Above Benchmark | Below Benchmark | Total | % Above Benchmark | Above Benchmark | Below Benchmark | Total | |
| Up Market | 13 | 71 | 84 | 15% | 1.64% | -1.99% | -1.43% |
| Down Market | 32 | 2 | 34 | 94% | 2.57% | -0.34% | 2.40% |
| Total | 45 | 73 | 118 | 38% | 2.30% | -1.94% | -0.32% |
During the test period, Portfolio 3 (with 1% Bitcoin) showed a clear defensive advantage compared with the Vanguard 500 Index.
Out of 34 down markets, it outperformed in 32 and lagged in only 2, a 94% monthly outperformance success rate during declines.
On average, it generated a +2.40% active return in down months, meaning it lost less, or even gained slightly, when the broader market fell.
This is an advantage of the portfolio’s improved return-to-risk ratio, largely due to its blend of bonds, gold, and a small dose of Bitcoin providing less correlated ballast.
In contrast, during up markets, Portfolio 3 tended to trail the S&P 500, outperforming in just 13 of 84 months (around 15% of the time).
When it did lag, the average shortfall was modest at -1.99%, and when it beat the index, gains averaged +1.64%.
This pattern, giving up some upside for better downside protection, with better return relative to the risk taken on, is typical of more balanced portfolios.
Overall, Portfolio 3 delivered smoother performance.
It captured most of the market’s gains but shielded investors from the majority of its losses.
That trade-off improved long-term efficiency: smaller drawdowns, steadier compounding, and a higher Sharpe ratio.
In essence, it shows that even a conservative allocation with just 1% Bitcoin can improve downside performance without meaningfully sacrificing long-term growth.
Portfolio Risk Decomposition
| Ticker | Name | Portfolio 1 | Portfolio 2 | Portfolio 3 |
|---|---|---|---|---|
| SPY | SPDR S&P 500 ETF | 48.04% | 55.61% | 62.76% |
| GBTC | Grayscale Bitcoin Trust ETF | 29.08% | 17.74% | 7.02% |
| VBMFX | Vanguard Total Bond Market Index Inv | 13.23% | 15.70% | 18.16% |
| GLD | SPDR Gold Shares | 9.64% | 10.95% | 12.06% |
| Risk attribution decomposes portfolio risk into its constituent parts and identifies the contribution to overall volatility by each of the assets. | ||||
This risk decomposition shows how each asset contributes to the overall volatility of the three portfolios, showing how the portfolio’s risk profile changes as Bitcoin exposure declines.
In Portfolio 1, with 3% Bitcoin, the S&P 500 (SPY) accounts for nearly half of total risk (48.04%), while Bitcoin (GBTC) contributes 29.08%, a significant share for such a small allocation.
Bonds (VBMFX) and gold (GLD) together add the remaining 22.87%, helping moderate the swings caused by equities and Bitcoin.
This balance creates a well-diversified mix where no single asset dominates completely.
As Bitcoin’s weight falls, its risk contribution drops sharply. In Portfolio 2 (2% Bitcoin), GBTC’s share of risk falls to 17.74%, while equities’ share rises to 55.61%. Bonds and gold also absorb slightly more of the total volatility, reflecting their stabilizing role.
By Portfolio 3 (1% Bitcoin), Bitcoin accounts for just 7.02% of portfolio risk, and the S&P 500 becomes the primary driver at 62.76%.
Bonds and gold collectively provide about 30% of the risk budget, emphasizing traditional defensive assets.
So, even small Bitcoin allocations can have an outsized impact on total portfolio risk, but that influence diminishes – and the benefits balance better – as exposure decreases.
In low allocations, the result is a smoother, more equity-like risk profile; still diversified, but with less volatility concentration in Bitcoin.
Risk and Return Metrics
| Metric | Portfolio 1 | Portfolio 2 | Portfolio 3 | Vanguard 500 Index Investor |
|---|---|---|---|---|
| Arithmetic Mean (monthly) | 1.26% | 1.10% | 0.94% | 1.26% |
| Arithmetic Mean (annualized) | 16.26% | 14.08% | 11.83% | 16.22% |
| Geometric Mean (monthly) | 1.21% | 1.06% | 0.90% | 1.16% |
| Geometric Mean (annualized) | 15.46% | 13.50% | 11.41% | 14.90% |
| Standard Deviation (monthly) | 3.47% | 2.97% | 2.55% | 4.40% |
| Standard Deviation (annualized) | 12.02% | 10.30% | 8.84% | 15.24% |
| Downside Deviation (monthly) | 1.58% | 1.48% | 1.40% | 2.75% |
| Maximum Drawdown | -19.15% | -18.63% | -18.11% | -23.95% |
| Benchmark Correlation | 0.67 | 0.75 | 0.84 | 1.00 |
| Beta(*) | 0.53 | 0.51 | 0.49 | 1.00 |
| Alpha (annualized) | 7.21% | 5.60% | 3.90% | 0.00% |
| R2 | 44.47% | 56.02% | 69.98% | 100.00% |
| Sharpe Ratio | 1.08 | 1.08 | 1.03 | 0.85 |
| Sortino Ratio | 2.27 | 2.06 | 1.77 | 1.32 |
| Treynor Ratio (%) | 24.77 | 21.98 | 18.75 | 12.99 |
| Calmar Ratio | 4.54 | 4.16 | 3.79 | 2.72 |
| Modigliani–Modigliani Measure | 18.66% | 18.60% | 17.86% | 15.12% |
| Active Return | 0.57% | -1.40% | -3.49% | N/A |
| Tracking Error | 11.51% | 10.17% | 9.22% | N/A |
| Information Ratio | 0.05 | -0.14 | -0.38 | N/A |
| Skewness | 0.88 | 0.30 | -0.24 | -0.50 |
| Excess Kurtosis | 2.64 | 0.90 | 0.15 | 0.66 |
| Historical Value-at-Risk (5%) | 3.57% | 3.60% | 3.39% | 7.06% |
| Analytical Value-at-Risk (5%) | 3.50% | 3.28% | 3.12% | 5.98% |
| Conditional Value-at-Risk (5%) | 5.38% | 4.94% | 4.74% | 9.31% |
| Upside Capture Ratio (%) | 68.39 | 62.20 | 55.59 | 100.00 |
| Downside Capture Ratio (%) | 42.99 | 43.16 | 43.36 | 100.00 |
| Safe Withdrawal Rate | 20.55% | 18.42% | 16.28% | 17.82% |
| Perpetual Withdrawal Rate | 11.47% | 9.80% | 7.94% | 11.00% |
| Positive Periods | 79 out of 118 (66.95%) | 80 out of 118 (67.80%) | 77 out of 118 (65.25%) | 84 out of 118 (71.19%) |
| Gain/Loss Ratio | 1.38 | 1.27 | 1.33 | 0.83 |
| * Vanguard 500 Index Investor is used as the benchmark for calculations. Value-at-risk metrics are monthly values. | ||||
This risk and return breakdown shows how even tiny allocations to Bitcoin can influence the behavior of traditionally balanced portfolios.
Starting with returns, the results are surprisingly strong given the small exposure.
Portfolio 1 (3% Bitcoin) posted a 15.46% annualized return, narrowly topping the S&P 500’s 14.90%, while Portfolios 2 and 3 returned 13.50% and 11.41% respectively. These gains came with much lower volatility.
The S&P’s annualized standard deviation was 15.24%, compared with just 12.02%, 10.30%, and 8.84% for the three portfolios. That means Portfolio 1 achieved similar returns to the benchmark with about 20% less risk, which is a nice efficiency upgrade.
The Sharpe and Sortino ratios confirm this. Each portfolio delivered stronger risk-adjusted returns than the S&P 500, with Sharpe values between 1.03 and 1.08, versus 0.85 for the index.
Sortino ratios, which emphasize downside protection were 2.27, 2.06, and 1.77, compared with 1.32 for the benchmark. So these portfolios earned more for every unit of downside risk taken.
Downside deviation, a measure of “bad volatility,” was roughly half the S&P’s (around 1.5% monthly vs. 2.75%).
Maximum drawdowns also remained shallower, around -18% to -19%, compared with -23.95% for the index. This explains the portfolios’ Calmar ratios, a measure of return per drawdown, which were significantly higher, peaking at 4.54 versus 2.72 for the S&P 500.
The data also shows strong defensive asymmetry. The downside capture ratios hover near 43%, meaning these portfolios only participated in about 40% of the market’s losses during downturns.
Yet upside capture ratios, though lower (56-68%), still provided meaningful participation in rallies.
This balance (less pain in downturns, modestly less gain in rallies) results in smoother compounding and fewer left-tail risks and deep recoveries needed to regain losses.
As for the tail-risk metrics… Value-at-Risk (VaR) and Conditional VaR figures are about half those of the S&P 500, showing reduced exposure to severe monthly losses.
Skewness and kurtosis improved, shifting returns toward slightly positive asymmetry (more right-tail events, fewer extremes).
Finally, the safe withdrawal rates, a proxy for sustainable long-term income, favor the Bitcoin-tilted portfolios. Portfolio 1’s rate of 20.55% exceeds the S&P 500’s 17.82%, signaling that the smoother, more efficient return stream supports higher long-term drawdowns.
The takeaway: a 1-3% Bitcoin allocation boosted returns and made the portfolio’s risk-reward profile fundamentally more balanced.
Of course, as we covered, this is all backwards-looking data, especially for Bitcoin.
Going forward, we need to look at its risk, return, and correlation dynamics to determine how it might fit.
Optimization Approach
Let’s try an approach where we optimize the amount of BTC we should have.
We’ll use two different approaches:
- Risk parity
- cVaR optimization (highest return subject to a maximum 4% monthly tail loss)
Risk Parity
Provided Portfolio
This is what we input as a baseline portfolio.
| Ticker | Name | Allocation |
|---|---|---|
| SPY | SPDR S&P 500 ETF | 40.00% |
| TIP | iShares TIPS Bond ETF | 15.00% |
| TLT | iShares 20+ Year Treasury Bond ETF | 10.00% |
| LQD | iShares iBoxx $ Invmt Grade Corp Bd ETF | 15.00% |
| GLD | SPDR Gold Shares | 15.00% |
| GBTC | Grayscale Bitcoin Trust ETF | 5.00% |
Equal-Weighted Portfolio
| Ticker | Name | Allocation |
|---|---|---|
| SPY | SPDR S&P 500 ETF | 16.67% |
| TIP | iShares TIPS Bond ETF | 16.67% |
| TLT | iShares 20+ Year Treasury Bond ETF | 16.67% |
| LQD | iShares iBoxx $ Invmt Grade Corp Bd ETF | 16.67% |
| GLD | SPDR Gold Shares | 16.67% |
| GBTC | Grayscale Bitcoin Trust ETF | 16.67% |
Risk Parity
What algorithmically it spit back:
| Ticker | Name | Allocation |
|---|---|---|
| SPY | SPDR S&P 500 ETF | 14.93% |
| TIP | iShares TIPS Bond ETF | 32.54% |
| TLT | iShares 20+ Year Treasury Bond ETF | 14.37% |
| LQD | iShares iBoxx $ Invmt Grade Corp Bd ETF | 19.42% |
| GLD | SPDR Gold Shares | 16.54% |
| GBTC | Grayscale Bitcoin Trust ETF | 2.21% |
This portfolio is designed to balance each asset’s risk contribution rather than its capital allocation.
Instead of weighting by dollars, the goal is to equalize volatility impact across the holdings, so no single asset dominates total portfolio risk.
Here, bonds are the core risk ballast. Treasury Inflation-Protected Securities (TIP) and long-term Treasuries (TLT) together make up nearly 47% of capital, reflecting their lower volatility and defensive characteristics.
Investment-grade corporates (LQD) add another 19%, offering yield without excessive risk. Gold (GLD) accounts for 16.5%, serving as a currency/long-run inflation hedge and a diversifier against both equities and bonds.
Equities (SPY) sit at only 14.9%, well below traditional 60/40 portfolios, because stocks carry higher volatility and thus require smaller allocations to balance their risk contribution.
Finally, Bitcoin (GBTC) represents just 2.2%, as return stream with some level of unique character with significant convexity potential.
The result is a portfolio where risk is distributed more evenly across asset classes (interest rate risk, equity beta, inflation protection, and alternative return sources), creating a smoother profile.
In theory, such a structure maximizes diversification per unit of risk and provides greater stability across economic cycles.
Performance Summary
| Metric | Provided Portfolio | Risk Parity | Equal Weighted |
|---|---|---|---|
| Start Balance | $10,000 | $10,000 | $10,000 |
| End Balance | $37,568 | $22,410 | $72,644 |
| Annualized Return (CAGR) | 14.41% | 8.55% | 22.34% |
| Expected Return | 14.23% | 8.59% | 22.69% |
| Standard Deviation | 11.89% | 8.47% | 22.95% |
| Best Year | 43.36% | 21.38% | 125.73% |
| Worst Year | -19.96% | -17.13% | -29.45% |
| Maximum Drawdown | -22.98% | -19.83% | -32.32% |
| Sharpe Ratio (ex-ante) | 1.02 | 0.76 | 0.90 |
| Sharpe Ratio (ex-post) | 1.02 | 0.76 | 0.90 |
| Sortino Ratio | 1.86 | 1.27 | 2.27 |
| Results based on historical returns. Expected return is the annualized monthly arithmetic mean return | |||
cVaR Subject to a 4% Monthly Tail Loss
Here, we did a cVaR approach.
Conditional Value at Risk (cVaR) measures the average loss expected (in this case, beyond the worst 4% of monthly outcomes), showing how severe losses could be in extreme market conditions.
We set maximum asset weights to prevent unrealistic or concentrated results during optimization.
Given limited data that’s optimizing off past results, it can over- or underemphasize certain assets.
Maximum Return at 4.00% Expected Tail Loss
| Ticker | Name | Allocation |
|---|---|---|
| SPY | SPDR S&P 500 ETF | 11.86% |
| TIP | iShares TIPS Bond ETF | 30.00% |
| TLT | iShares 20+ Year Treasury Bond ETF | 8.14% |
| LQD | iShares iBoxx $ Invmt Grade Corp Bd ETF | 30.00% |
| GLD | SPDR Gold Shares | 20.00% |
This portfolio represents the maximum-return solution under a 4% expected tail loss constraint, meaning it seeks the highest return while limiting extreme downside risk.
The optimizer allocated heavily to inflation-protected bonds (TIP, 30%) and corporate bonds (LQD, 30%) for stability and yield, while maintaining exposure to gold (GLD, 20%) as an inflation and crisis hedge.
Equities (SPY, 11.86%) and long Treasuries (TLT, 8.14%) provide balanced growth and duration exposure.
Notably… it did not allocate to Bitcoin, because even a small amount can make it harder to cap drawdowns relative to allocating to something else.
That means for risk-conscious investors, Bitcoin may be of no interest to them due to its volatility and the lumps it generates.
Conclusions
For a balanced portfolio, keep Bitcoin small. The sweet spot is generally 1 to 3 percent of total allocation, with potentially up to 5 percent for investors who can handle more variation.
That range preserved balance, lifted efficiency, and still had acceptable downside behavior in our tests without letting Bitcoin dominate the ride.
Why so little can matter
Bitcoin is highly volatile, often many times more than stocks, and deeper liquidity is still developing.
Even tiny slices carry weight.
In a traditional 60/40 mix, 1 to 2 percent in Bitcoin can consume roughly 10 percent of total portfolio risk – depending, of course, on what else is in the portfolio.
That is the core idea. Size by risk, not by dollars.
What the data suggests
Across 2016 to 2025, adding 1 to 3 percent Bitcoin to a simple blend of stocks, bonds, and gold raised Sharpe ratios, reduced downside deviation, and softened drawdowns versus the S&P 500.
Portfolio 3 in our set, with 1 percent Bitcoin, outperformed the index in 32 of 34 down months and kept peak losses shallower.
You’ll participate in rallies, just not fully, and you avoid much of the damage in selloffs.
That tradeoff helps long-run compounding.
If you want balance first
Consider 1 to 2 percent Bitcoin.
You get most of the modest diversification benefit and perhaps some long-run return enhancement with minimal disruption.
Downside capture remains muted, and the risk budget is still driven by stocks and high-quality bonds.
If you want growth with guardrails
Stretch to 3 percent, and only then to 5 percent if you accept sharper swings and the possibility of long drawdowns in the crypto sleeve.
At 3 percent, risk contribution is noticeable but not overwhelming.
At 5 percent, Bitcoin’s volatility begins to steer more of the portfolio’s day to day movement.
Sizing principles that help
Think in risk decomposition.
Decide what share of total risk you are comfortable assigning to Bitcoin, then back into the allocation.
Many balanced investors will cap Bitcoin at a lesser percentage of portfolio risk, which often translates to 1 to 2 percent of capital in a traditional portfolio with a mix of stocks, bonds, and commodities.
Implementation notes
Prefer clean wrappers with tight tracking to spot Bitcoin.
We used GBTC in this article, but holding BTC directly or via futures for capital efficiency is an option.
Hold in tax aware accounts when possible, and rebalance on a schedule.
Let the rules trim after big up moves and add after deep selloffs.
Pair the sleeve with high-quality bonds and some gold to keep overall variance in check.
Start at 1 percent, graduate to 2 or 3 percent if you want more punch, and only consider up to 5 percent if your tolerance, time horizon, and liquidity needs are aligned.
Small can do the job.