Why Valuation Alone Fails as a Stock Market Predictor


Valuation is one of the most popular lenses through which to view the stock market.
Whenever it becomes expensive you see headlines like this:
Valuation metrics like the price-to-earnings (P/E) ratio are nonetheless limited when it comes to market timing.
Valuations demonstrate strong correlations with long-term returns, but they offer virtually no insight into short-term market movements.
This creates an issue for value-minded investors – or traders who integrate value considerations – looking for actionable timing signals.
Key Takeaways – Why Valuation Alone Fails as a Stock Market Predictor
- Valuation metrics like P/E ratios are popular, but they don’t work well for short-term timing.
- Long-term drift is tiny: a 7% annual return is only ~0.02% per day, while daily volatility is ~1% – about 50x larger.
- That’s why markets are positive only ~53% of days and ~76% of the years.
- Noise dominates short horizons.
- Trailing P/E looks backward, forward P/E relies on one-year estimates, and both miss the long-term growth potential that are important for future returns.
- Value is subjective, shaped by discount rates: someone targeting 6% accepts higher prices than someone demanding 10%.
- Prices move on flows: (Money + Credit) / Quantity.
- Transactions and liquidity drive short-term markets, not valuation signals.
- Ultimately, who are the buyers, who are the sellers, how big are they, and what are they motivated to do?
- This gives you a more realistic understanding of why markets do what they do versus notional equilibrium value.
Price vs. Value
If a stock index delivers 7% per year on average, the equivalent daily return is about:
0.07/365 ≈ 0.000192, or 0.019% per day.
That’s the extent of your “signal.”
Now compare it to the “noise”: daily volatility in the US market is roughly 1%, which is about 50 times larger than the average daily drift.
Because the noise dominates, the market only closes higher about 53% of days – barely more than a coin flip. Over a week, that rises to around 56%.
This shows why valuation and long-term expected returns have close to no short-term predictive power: the daily signal is tiny, but drowned out by volatility.
Only over longer horizons do valuation considerations begin to matter.
Over a year, that ~7% sits against around 15% volatility taken as a standard deviation.
So, 76% of years are up, but the odds of a down year are still like flipping two heads in a row. That’s why it’s so important to have a multi-year perspective.
Historical Insights
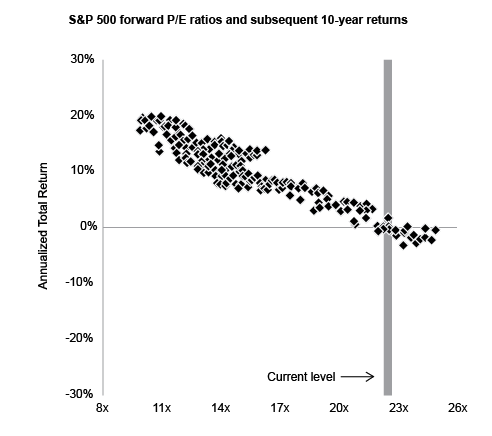
J.P. Morgan Asset Management looked at forward P/E ratios and subsequent returns.
Over nearly 324 monthly observations, the data showed a negative correlation of high P/E ratios and forward returns, but over a 10-year period.
P/E Ratios Aren’t Foolproof
Investors love to lean on valuation signals like the P/E ratio. The problem is that a trailing P/E only tells you where earnings have been, not where they’re going.
Forward P/E ratios try to fix that, but they’re based on estimates that look just one year out.
Analysts are often wrong, and even if they’re right, one year is a blink in market terms.
So the “signal” you think you’re getting is really just a guess layered on top of backward-looking data.
And high valuations don’t necessarily mean stocks are “too expensive.” They can be justified if earnings grow a lot. Because you’re not just discounting in the forward year (though the way the math works, the near-term is weighted heavily than the far future), but many years out.
Take the S&P 500 as an example.
Let’s say earnings right now are about 300 relative to the index level. That might look pricey when you compare it to today’s market value.
But fast forward thirty years. If earnings compound at 7% a year, that 300 turns into something closer to 2,300. Suddenly, what looked expensive now doesn’t look so crazy when thinking about your particular time horizon.
So someone with a 30-year perspective who wants stocks to fund their retirement might look ahead and see that the index is quite reasonable relative to what they need.
That’s why value signals are weak short-term predictors. Over a week, month, quarter, and even the yearly, the market is mostly a lot of noise — the volatility is a lot bigger than the tiny drift of long-term returns that it feels random.
Only when you stretch the horizon out many years do fundamentals start to overpower the noise, because compounding earnings growth has time to show up.
In that sense, using valuation as a means of short-term timing doesn’t make much sense.
The big picture only makes sense when you step back far enough.
Value Is Subjective
Another thing that’s easy to forget is that “value” itself is subjective.
It isn’t a universal truth written into the ticker tape. What looks cheap to one person might look expensive to another.
In finance, there’s a concept called the “discount rate” – i.e., the return we expect or require.
If you’re someone who only needs 6% a year for your investments, you’ll be comfortable paying a higher price for the same earnings stream than someone who demands 10%. The math of valuation is literally built on those assumptions.
Example
The higher the price, the lower the forward returns, generally speaking.
In the case below, we find that someone only needing 5% return per year could be willing to pay up to a fundamental value of around $560 per share.
On the other hand, someone wanting 10% return per year would want a price of just over $200 per share.
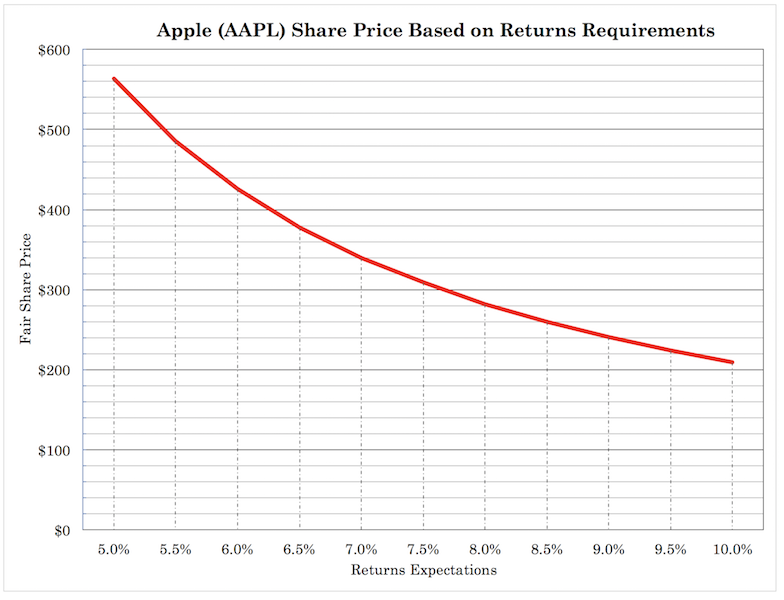
This is a huge difference.
That’s why debates about whether the market is “overvalued” or “undervalued” can sound so different depending on who’s opinion it is.
What are their goals? Time horizons? Risk tolerances?
A pension fund aiming to meet a steady liability might look at the same market and shrug, while a value investor chasing double-digit returns – who effectively would need P/E ratios at under 10x – sees it as wildly expensive.
Both are looking at the same earnings, but they’re using different lenses and have different goals and needs.
Of course, a day trader probably doesn’t care about valuation at all because their timeframe is so short. A market maker or stat arb trader is also pursuing a totally different strategy.
So when you hear someone say “valuations are too high” as if it’s an objective fact, take it with a grain of salt.
They’re really just revealing their own hurdle rate, their own expectations, or based on some historical metric. Markets aren’t priced to please everyone equally – they settle somewhere in the middle.
Summary
How Different Market Participants View Valuation
| Market Participant | Care About Value | Goals | Time Horizon |
| Day Trader | Low or Very Low | Capture short-term price moves, intraday profits | Minutes to hours |
| Market Maker / Stat Arb | Very Low | Exploit inefficiencies, provide liquidity | Milliseconds-days |
| Value Investor | High | Buy undervalued assets vs. intrinsic value | Years-decades |
| Growth Investor | Medium | Ride future earnings growth | Years-decades |
| Pension Fund | Medium | Fund long-term obligations reliably | Decades |
| Retiree (Needs 6%) | High | Preserve capital, steady 6% annual return | Decades |
| Aggressive Investor (10%) | Very High | Target double-digit returns, only buy cheap enough | Years-decades |
So, If Valuation Doesn’t Have Much Predictive Power, Then What Does?
Markets don’t move on abstract “fair value” calculations — they move because real participants place real trades.
The concept of agent-based modeling, which we covered in more depth here, helps make this tangible by asking: who are the buyers, who are the sellers, how big are they, and what motivates them to do what they do?
A day trader chasing momentum, a pension fund rebalancing, and an algorithm exploiting microsecond inefficiencies all interact in the same marketplace, but with very different goals and time horizons.
Their combined actions generate the short-term price path, which often looks chaotic when compared to any notional equilibrium value predicated on earnings.
In the medium term, flows of capital, credit conditions, and institutional positioning dominate, while valuation considerations remain only one influence among many.
From modeling the market as a collection of agents with distinct strategies and incentives, you gain a clearer view of why prices diverge from fundamentals, why trends persist longer than expected, and why mean reversion can take years.
It’s less about a perfect weighing machine and more about a living ecosystem of competing motives.
Prices = (Money + Credit) / Quantity
At the end of the day, markets clear at the price where actual transactions happen.
You can build models, argue about “fair value,” and run endless P/E screens, but none of that moves the tape. What moves prices is money meeting quantity.
A simple way to think about it is:
Prices = (Money + Credit) / Quantity
If there’s more money and credit chasing the same amount of stock, prices go up. If people pull money out, or if credit tightens, prices go down. Valuation sensitivity matters.
Some investors do step in when they see something as cheap, or step back when it feels expensive.
But they’re just one subset of market participants.
The aggregate price is set by all the trades crossing the market: buyers with cash or leverage, sellers needing liquidity, institutions rebalancing, speculators chasing momentum, algorithms moving in fractions of a second.
That’s why valuation signals don’t reliably predict where prices go in the short run. They influence behavior at the margin, but the market is first and foremost a clearing mechanism for transactions.
Think of it less like a weighing machine and more like an auction. The bids and offers on the floor can be influenced by perceived value, but they’re just as much about flows of capital, risk appetite, and liquidity conditions.
So yes, valuation can matter over decades, because earnings growth eventually shows up and long-term investors care about the return on their money.
But in the moment, what sets the price is simply who has the money (or credit) to transact, and how much stock is available at that instant.
In the end, other factors consistently override valuation signals in the short to medium term. Markets are driven by investor sentiment, fear, and greed cycles that can persist for extended periods, completely detaching stock prices from their underlying fundamentals.
During the dot-com bubble, many technology companies traded at P/E ratios exceeding 200 times earnings (or had no genuine earnings at all), yet the market continued climbing for months before correcting.
The Efficient Market Challenge
Modern markets are sophisticated information-processing machines that quickly incorporate known valuation relationships.
The Efficient Market Hypothesis suggests that if valuation metrics truly predicted returns, rational investors would arbitrage away these opportunities.
The persistence of valuation effects over decades indicates either:
- Markets are systematically inefficient (supporting behavioral finance theories)
- Valuation premiums represent compensation for unidentified risk factors
- Structural barriers prevent arbitrage (such as career risk for fund managers)
Behavioral Biases Distort Valuation Signals
Multiple cognitive biases interfere with valuation-based market timing (example).
Overconfidence leads investors to believe they can time entry and exit points precisely, despite evidence showing professional fund managers consistently fail at this task. Studies indicate that 86% of active funds underperformed their indices over 20-year periods.
Anchoring bias causes investors to fixate on historical valuation ranges, failing to account for structural changes in markets, corporate behavior, or economic conditions that may permanently shift “normal” valuation levels.
Herding behavior creates momentum that can drive valuations far beyond rational levels for extended periods.
This makes it impossible for the vast majority of market participants to predict when mean reversion will occur.
The Mean Reversion Mirage
While valuation metrics show mean reversion over very long periods, this reversion can take decades to materialize.
The Japanese stock market peaked in 1989 and took 35 years just to reach those levels again (in nominal terms), despite appearing “expensive” by traditional metrics for only a brief period.
Similarly, US markets have traded above historical average valuations for most of the past 30 years without experiencing the predicted correction – at least in a “permanent” Japan-style sense.
Mean reversion timing strategies face several critical flaws:
- Unknown timeframes – Mean reversion may take 5-20 years to occur
- Moving targets – The “mean” itself changes over time due to structural market evolution
- Opportunity costs – Sitting out of markets waiting for reversion can be devastating to long-term wealth accumulation
The Valuation Paradox Resolution
Valuation metrics can serve as a means of understanding realistic long-term returns, but are not reliable as a tactical timing tool.
They excel at setting long-term return expectations and adjusting portfolio risk levels but don’t have much value when used for short-term market entry and exit decisions.
Successful approaches recognize this paradox by:
- Using valuations to calibrate long-term return assumptions
- Maintaining strategic asset allocations regardless of short-term valuation concerns
- Using dollar-cost averaging to reduce timing risk
- Focusing on factors within investor control (your savings rate, costs, taxes, diversification)
The Path Forward
Rather than abandoning valuation analysis, it’s best to recalibrate expectations about what these metrics can and cannot accomplish.
Valuations provide important context for long-term planning. But they should never drive short-term portfolio decisions.
The evidence overwhelmingly supports a time-in-market approach over attempting to time the market for most market participants, even when valuations appear extreme by historical standards.
An elevated valuation environment might suggest modest long-term returns may lie ahead. But this doesn’t justify selling or sitting on the sidelines waiting for a correction that may never come – or may be preceded by further substantial gains that would dwarf any subsequent decline.
Related