Price Action Trading


Price action trading is about stripping your charts back to the basics – price, structure and momentum. It’s popular with day traders because it lets you react quickly to real-time price movements without relying on lagging indicators.
This beginner’s guide to trading on price explains what to look for in your charts, unpacks popular setups, and shares tips for managing risk.
Quick Introduction
- What Trading Price Is: Price action trading is a form technical analysis that involves reading how buyers and sellers are pushing the price of an asset around – using swings, key levels and candlestick behavior to time entries and exits directly from charts.
- Price > Indicators: While they serve a purpose, avoid technical indicator overload. Focus on raw price movement and candle structure to see who’s in control: buyers or sellers.
- Market Structure First: Learn to spot clear uptrends (higher highs/lows), downtrends (lower highs/lows) and ranges (sideways “coiling” zones) and trade with that structure, not against it.
- Support & Resistance Zones: Mark a few obvious zones (not 20 lines) where price has reversed multiple times. Draw zones on the daily, then refine on lower timeframes.
- Candles in Context: The body shows who won that period, wicks show rejection, and size shows conviction. Patterns like pin bars, engulfing candles and inside bars only matter at key levels.
- Four Setups for Trading Price Action:
- Breakout: Price closing strongly outside a range, then retesting the level.
- Pullback: Entering with the trend after a retrace to support/resistance or a trendline.
- Reversal: Double tops/bottoms plus a break of structure at major levels.
- Inside Bar Breakout: Trading the expansion after a small candle trapped inside a bigger “mother” bar, ideally at key zones.
- Common Pitfalls to Avoid: Overtrading every price wiggle, ignoring structure, chasing moves late, moving stops when trades go bad, and constantly changing short-term trading strategies.
Top 4 Brokers for Price Action Trading
Short-term traders acting on price need brokers with clean charts, reliable price data, and fast execution. These brokers tick the boxes based on our hands-on tests:
-
1
 Interactive Brokers
 -
2
 NinjaTrader
 -
3
 eToro USAeToro USA LLC and eToro USA Securities Inc.; Investing involves risk, including loss of principal; Not a recommendation
 -
4
 Plus500USTrading in futures and options involves the risk of loss and is not suitable for everyone.
What Is Price Action Trading?
When you first open a trading platform, you’re probably tempted to load up every indicator you can find. I did the same thing. Moving averages, MACD, Bollinger bands, RSI, Ichimoku cloud, – you name it, I had it cluttering my screen.
Here’s what I learned the hard way: none of that matters as much as watching the price itself.
Price action trading is just you and the chart. No fancy algorithms. No lagging indicators. Just learning to read the story that each candle is telling you about the battle between buyers and sellers.
Once you get comfortable with this approach, everything else starts falling into place. You’ll know why you’re entering a trade, not just following some signal blindly.
How Markets Actually Move
Before you even think about placing a trade, let’s get clear on how markets actually work.
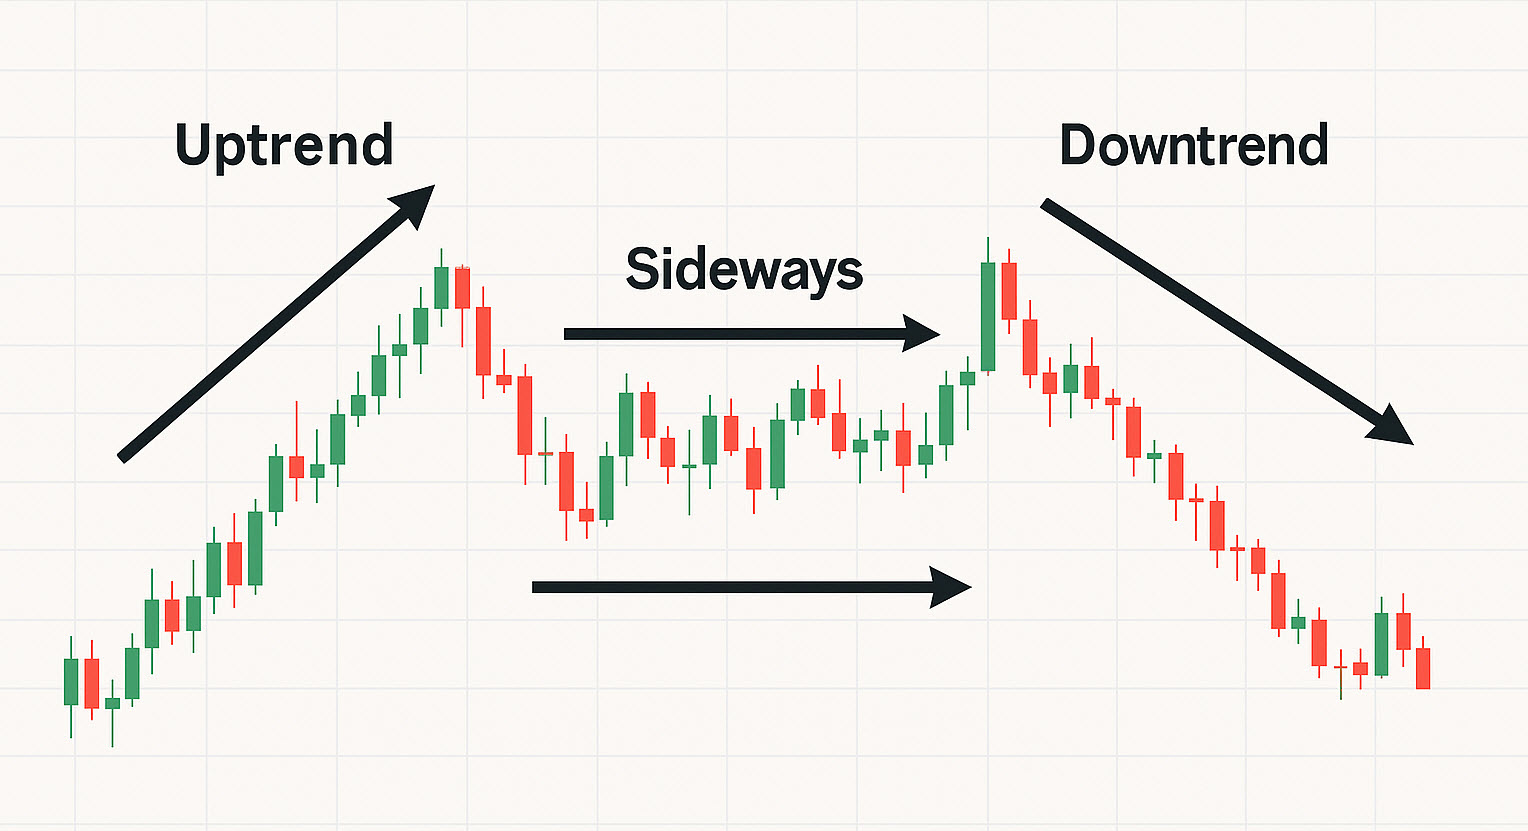
- When You See An Uptrend: You’re looking for higher highs and higher lows. That’s buyers winning. Each time they raise the price, they’re willing to pay more than before. Each time the price pulls back, new buyers enter at higher levels than during the previous pullback.
- When You See A Downtrend: It’s the opposite – lower highs and lower lows. Sellers are in control, and they continue to step in at lower prices. Don’t overthink this. Your job is to trade with the trend, not against it.
- When Price Goes Sideways (Ranges): Sometimes the market takes a breather. Price bounces between roughly the same high and low points. Neither buyers nor sellers have the upper hand. Think of these as ‘coiling’ zones – pressure builds, and eventually something’s gotta give.
- The Rhythm You Need To Recognize: Markets breathe. They expand (with big moves) and contract (through pullbacks or sideways action). When you start recognizing this rhythm, you’ll stop buying just as a move is exhausted or selling right before the price bounces.
Drawing Your Support & Resistance Zones
This is where you start marking up your chart, but don’t go crazy. I see beginners draw 20 lines and wonder why they’re confused.
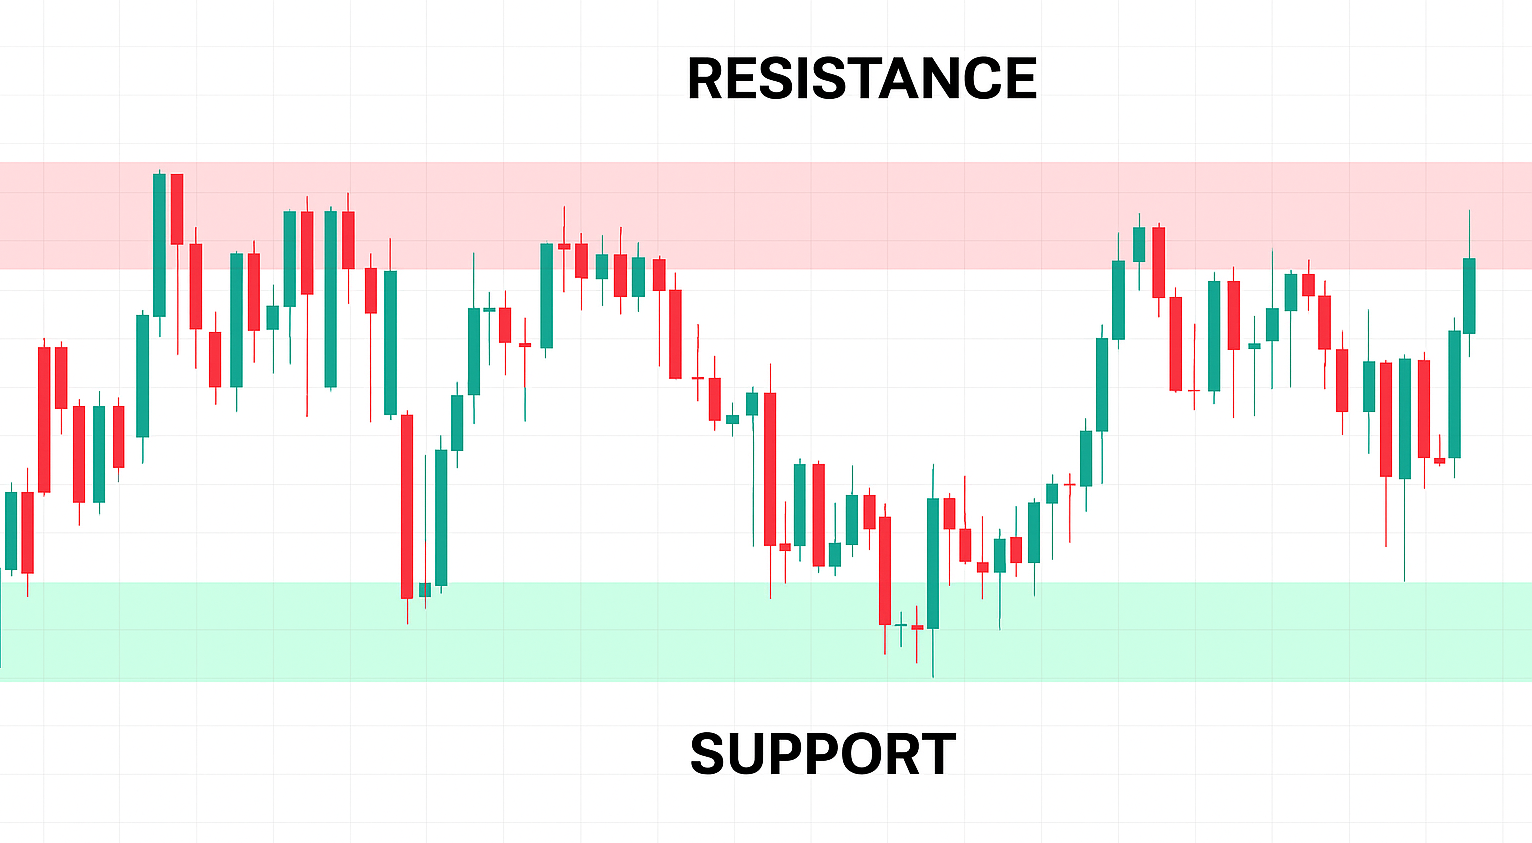
- Support Zones: These are areas where buyers have stepped in before. Prices tend to bounce here because traders remember these levels and react to them again.
- Resistance Zones: Where sellers have previously appeared, the price is often rejected here.
Here’s how I do it:
- Start on the daily chart – that’s where the important levels live.
- Look for spots where the price reversed at least twice. Those are your zones.
- Draw zones, not hairline-thin lines. Give price some room – it rarely respects exact numbers.
- Drop down to a lower timeframe to fine-tune your entry.
Reading Individual Candles
Each candle is trying to convey a message. Let’s break down what to look for:
- The body shows who won that period – buyers or sellers.
- The wicks indicate where the price was rejected. Long wicks indicate that someone pushed hard in that direction and was pushed right back.
- The overall size shows conviction. Big body? Strong move. Tiny body? Indecision.
Patterns That Actually Matter
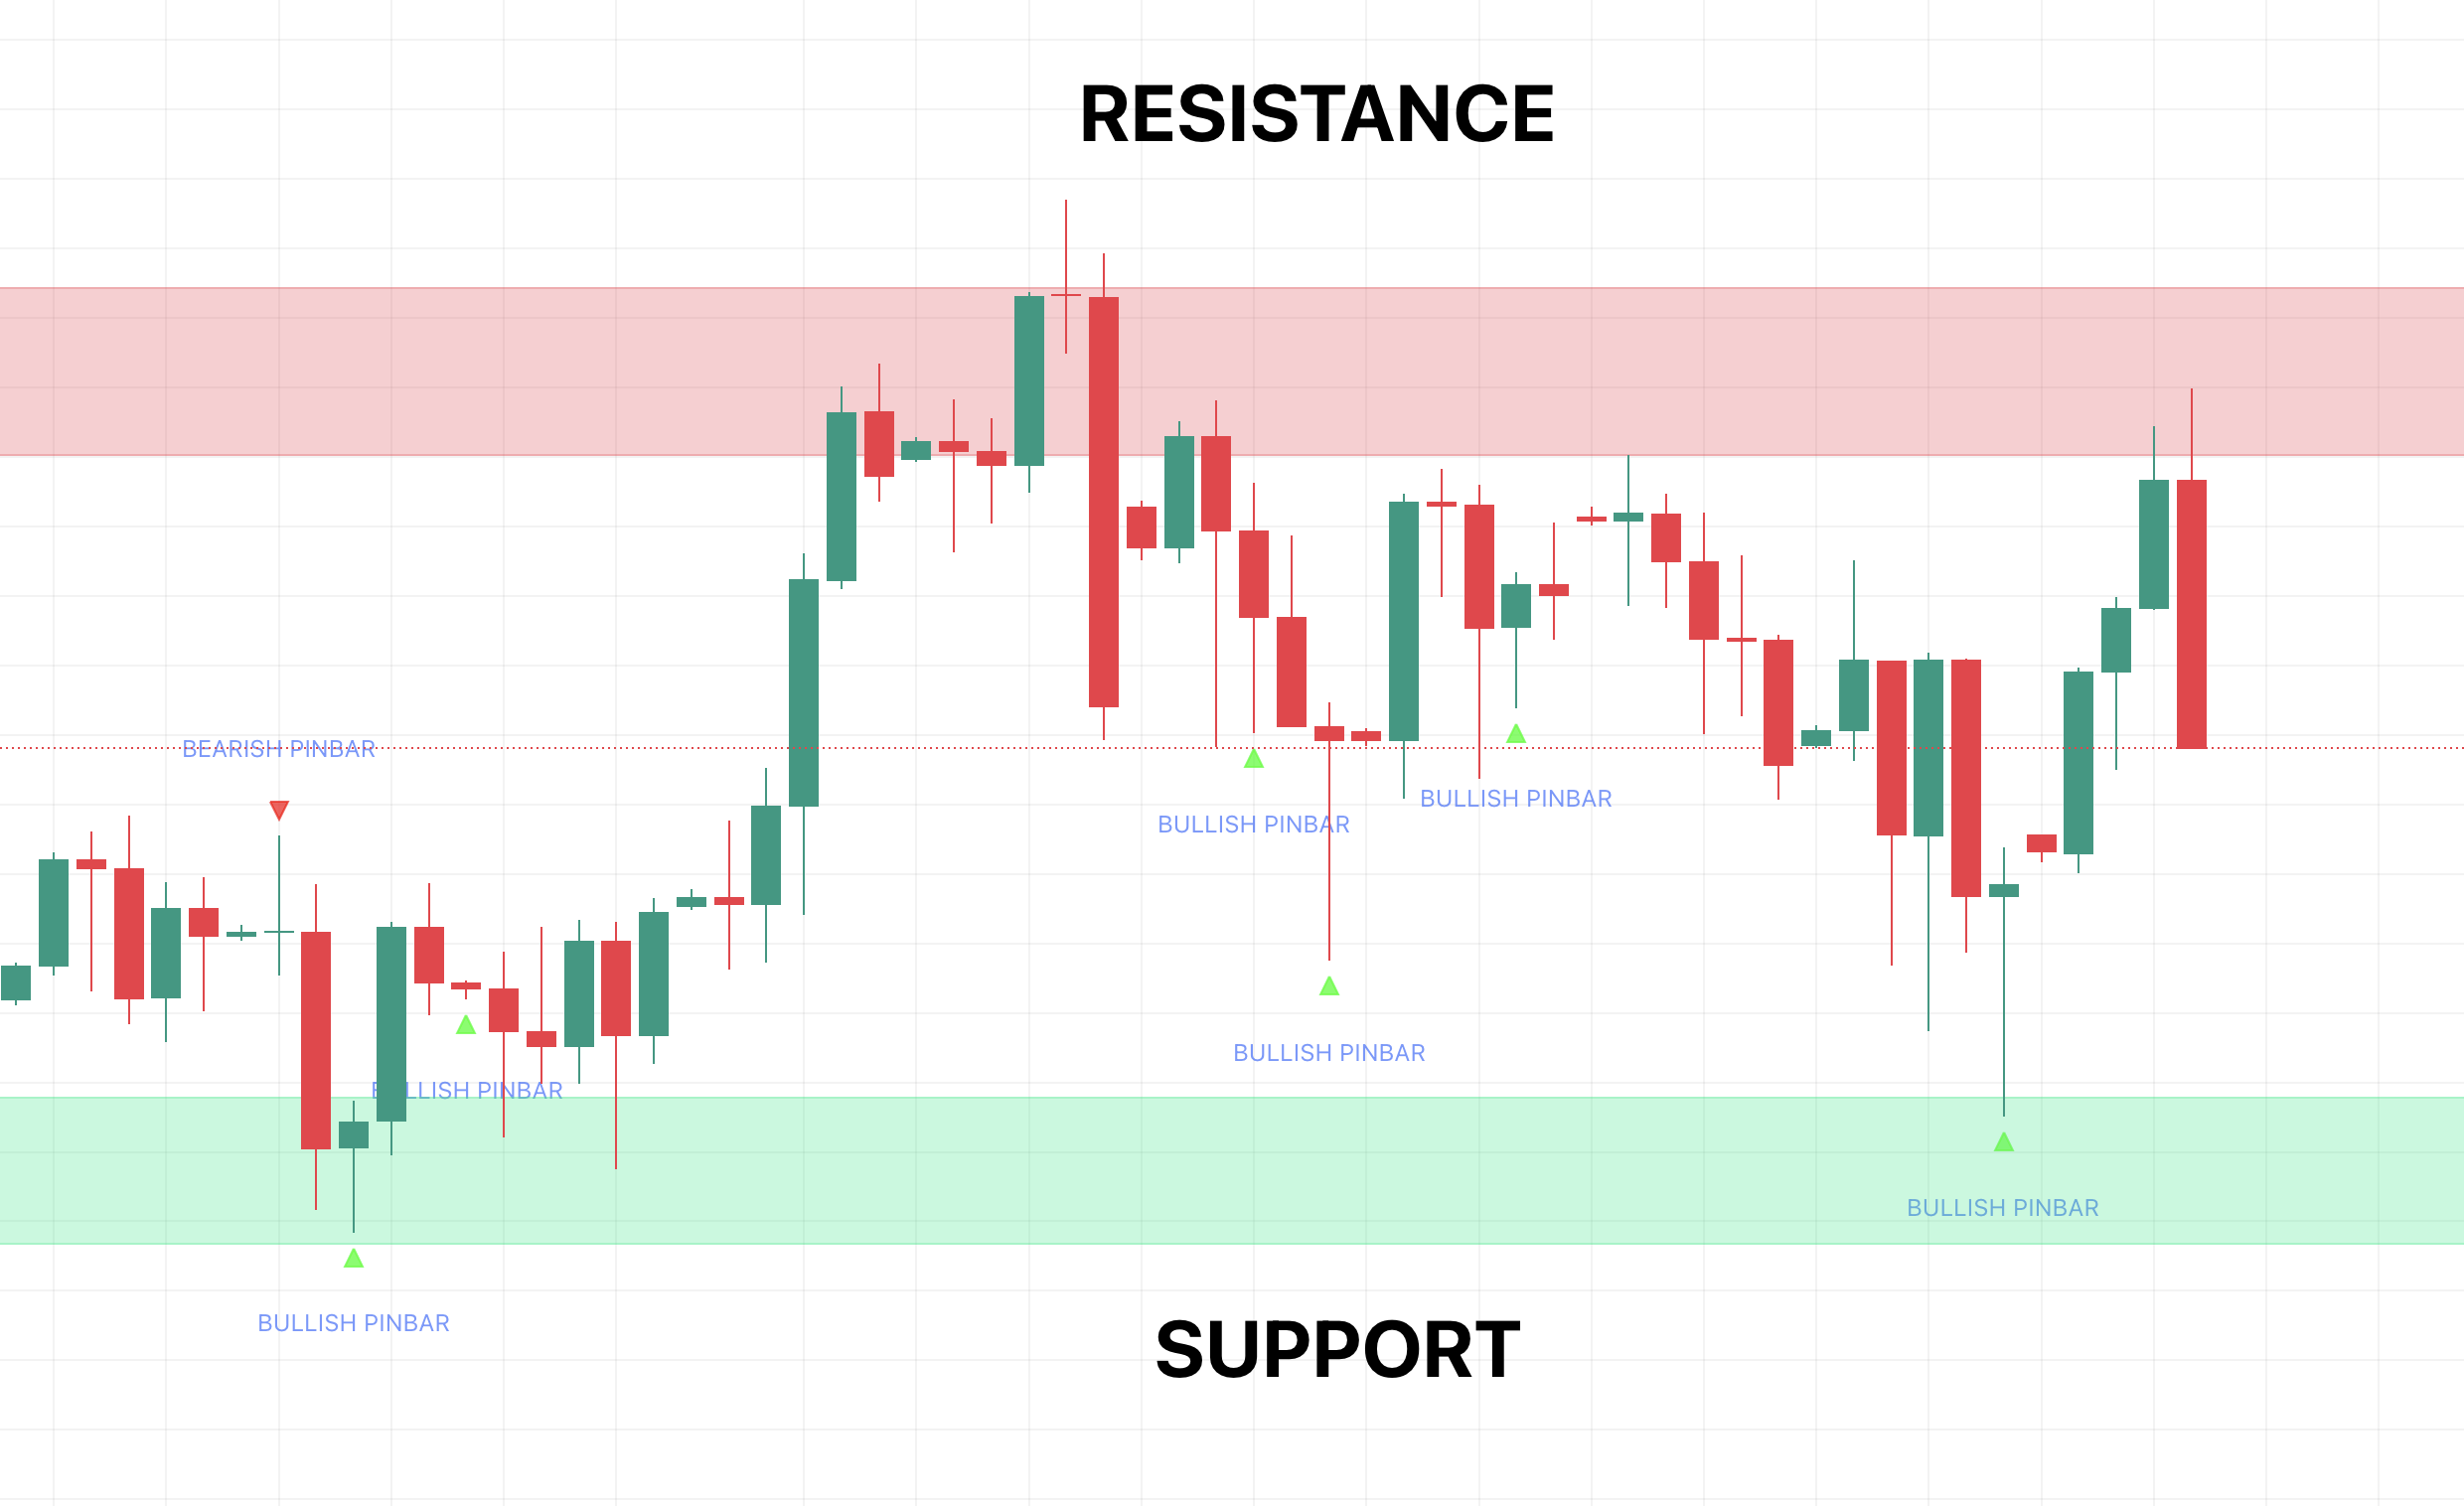
- Pin Bar: Long wick, small body. This indicates that the price was rejected hard. If you see this at a support zone, buyers just defended that level aggressively.
- Engulfing Candle: A big candle that completely swallows the previous one. This is a shift in control – one side just overwhelmed the other.
- Inside Bar: A small candle tucked inside the previous one. The market is pausing, consolidating. Often happens right before a breakout.
But here’s the thing – context is everything. A pin bar at random is meaningless. A pin bar at a major support level? Now we’re talking.
The Setups Worth Trading on Price
Here are the core setups beginners can focus on. Demo trading accounts are a great way to explore these setups risk-free.
A. The Breakout Setup
What you’re doing: Trading when the price finally breaks free from a range or key level.
Step by step:
- Find a clear range – price has been bouncing between a high and a low for a while.
- Wait for a strong candle to close beyond that range. Not just poke out – actually close outside.
- You want momentum here. Look for a solid-bodied candle with a strong close.
- Wait for the price to come back and retest the breakout level. This is your entry.
- Place your stop-loss just below the breakout candle. Your target is the next major structure level.
I think of it like this: When price breaks above a week-long range and pulls back to test that same zone, those buyers are showing up to defend their breakout. That’s your cue.

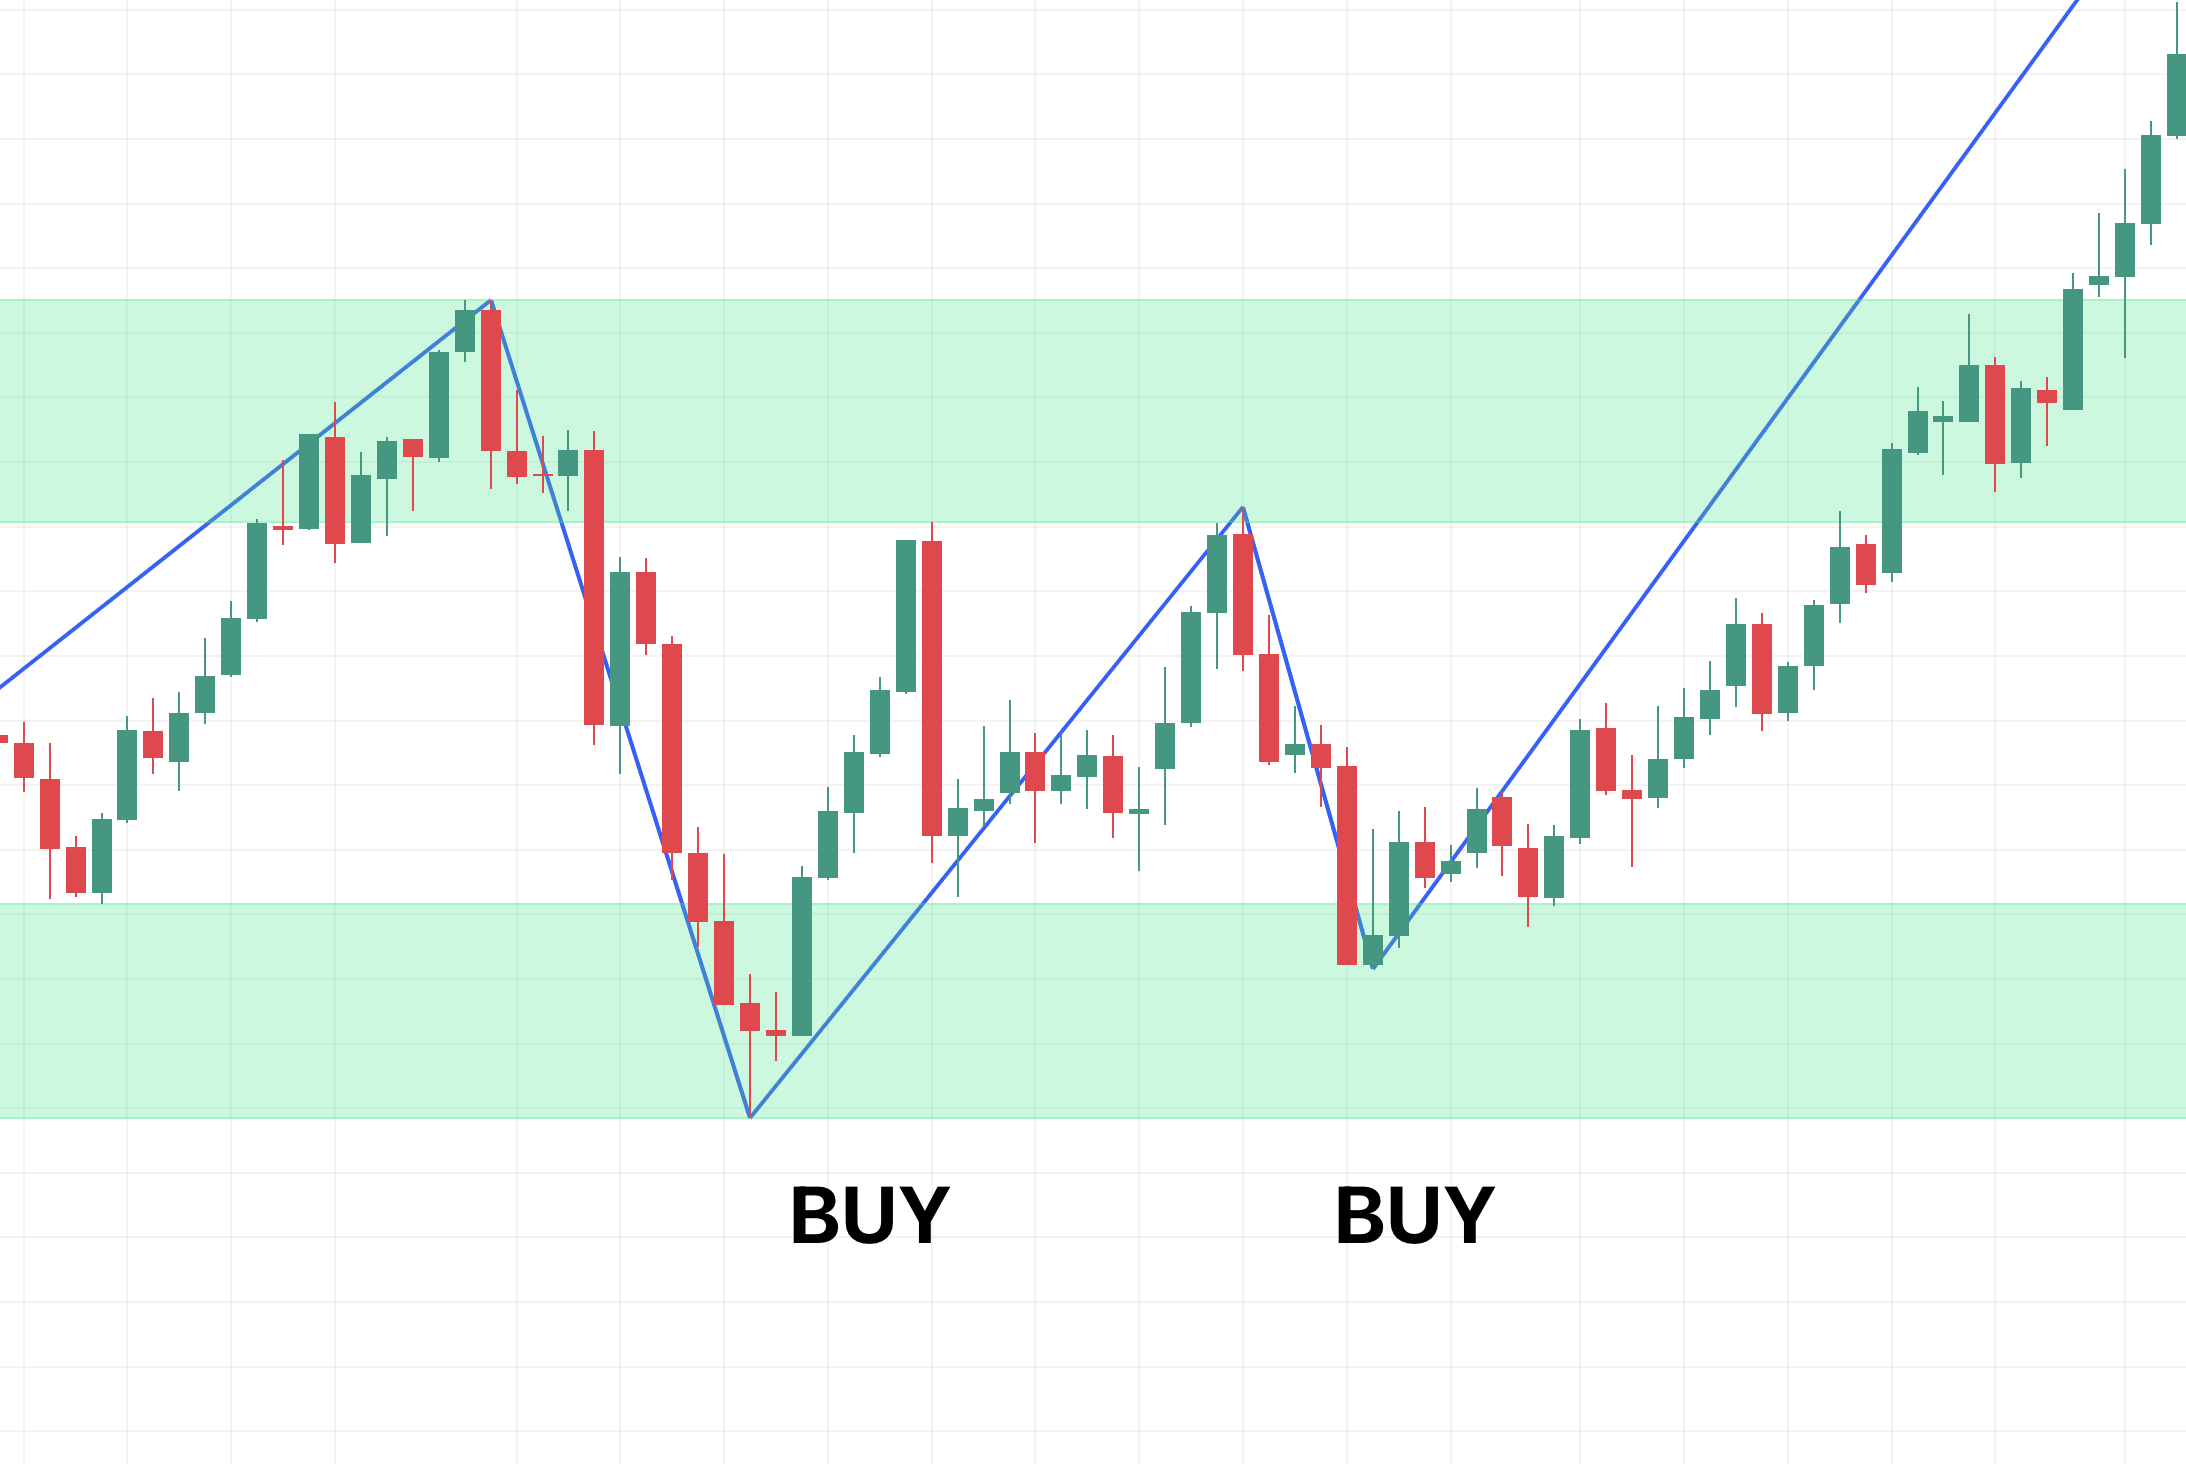
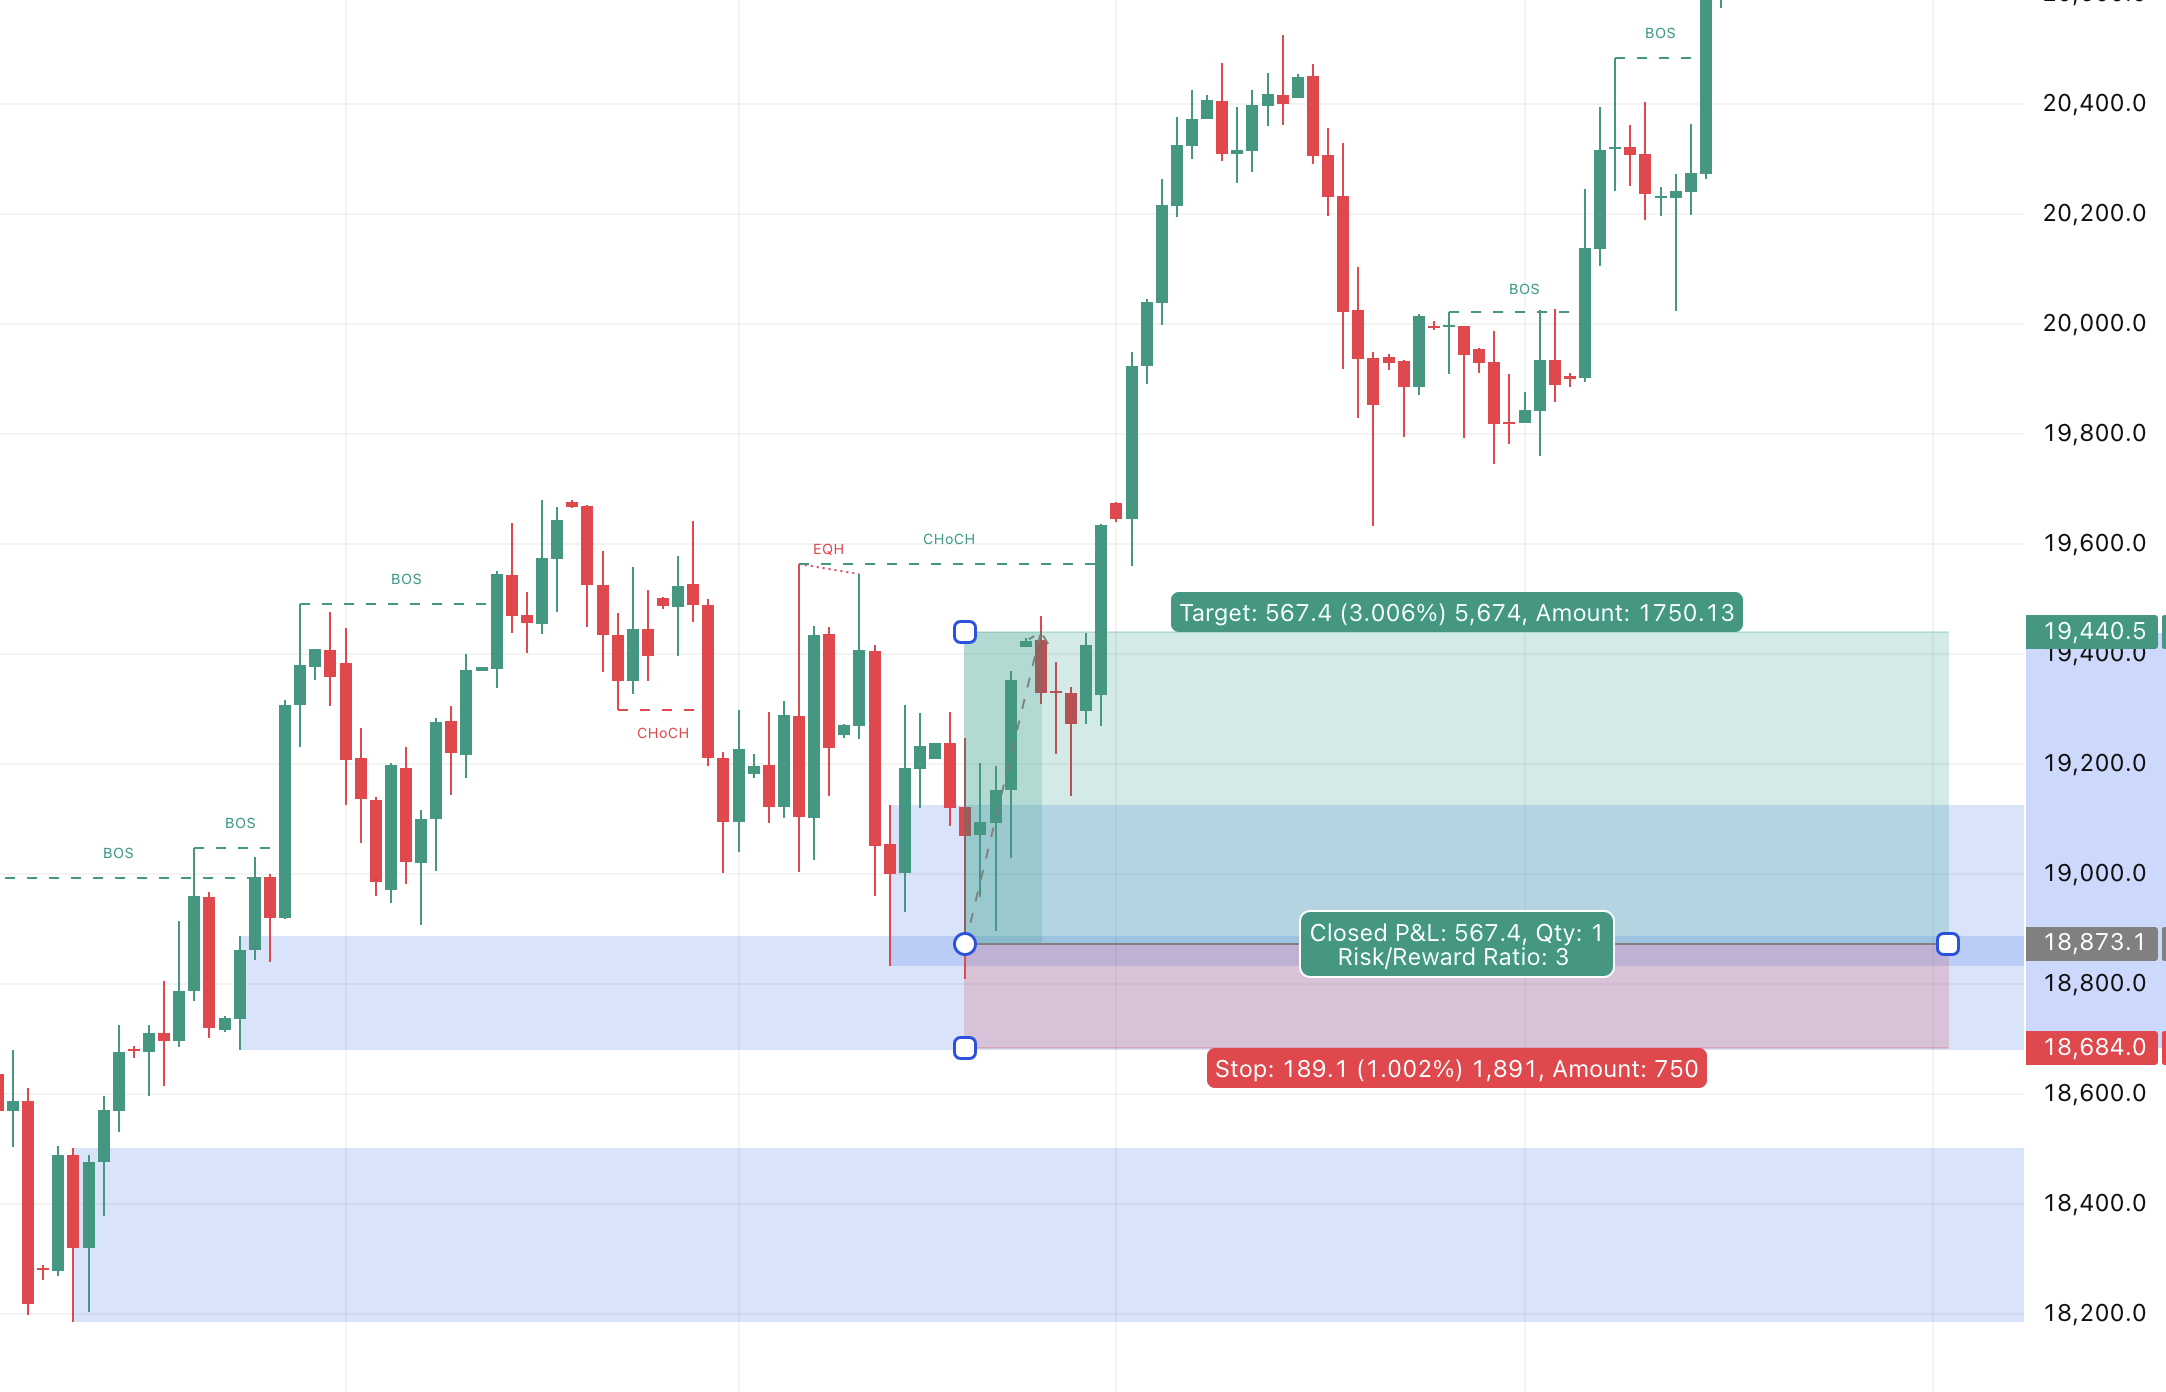
B. The Pullback Setup (Trading With The Trend)
What you’re doing: Jumping into an existing trend after price takes a breather.
Step by step:
- Confirm the trend on your higher timeframe. You need to see clear higher highs and higher lows (or lower highs and lows for downtrends).
- Wait for the price to pull back to a prior support level – this could be an old resistance that’s now support, or a trendline.
- Look for a rejection candle. In an uptrend, you want to see a bullish pin bar or an engulfing candle at that support level.
- Enter after the rejection with your stop below the recent swing low. Target the next logical high or aim for 2x your risk.
This can be a staple. The trend is already established, you’re just catching the next wave.
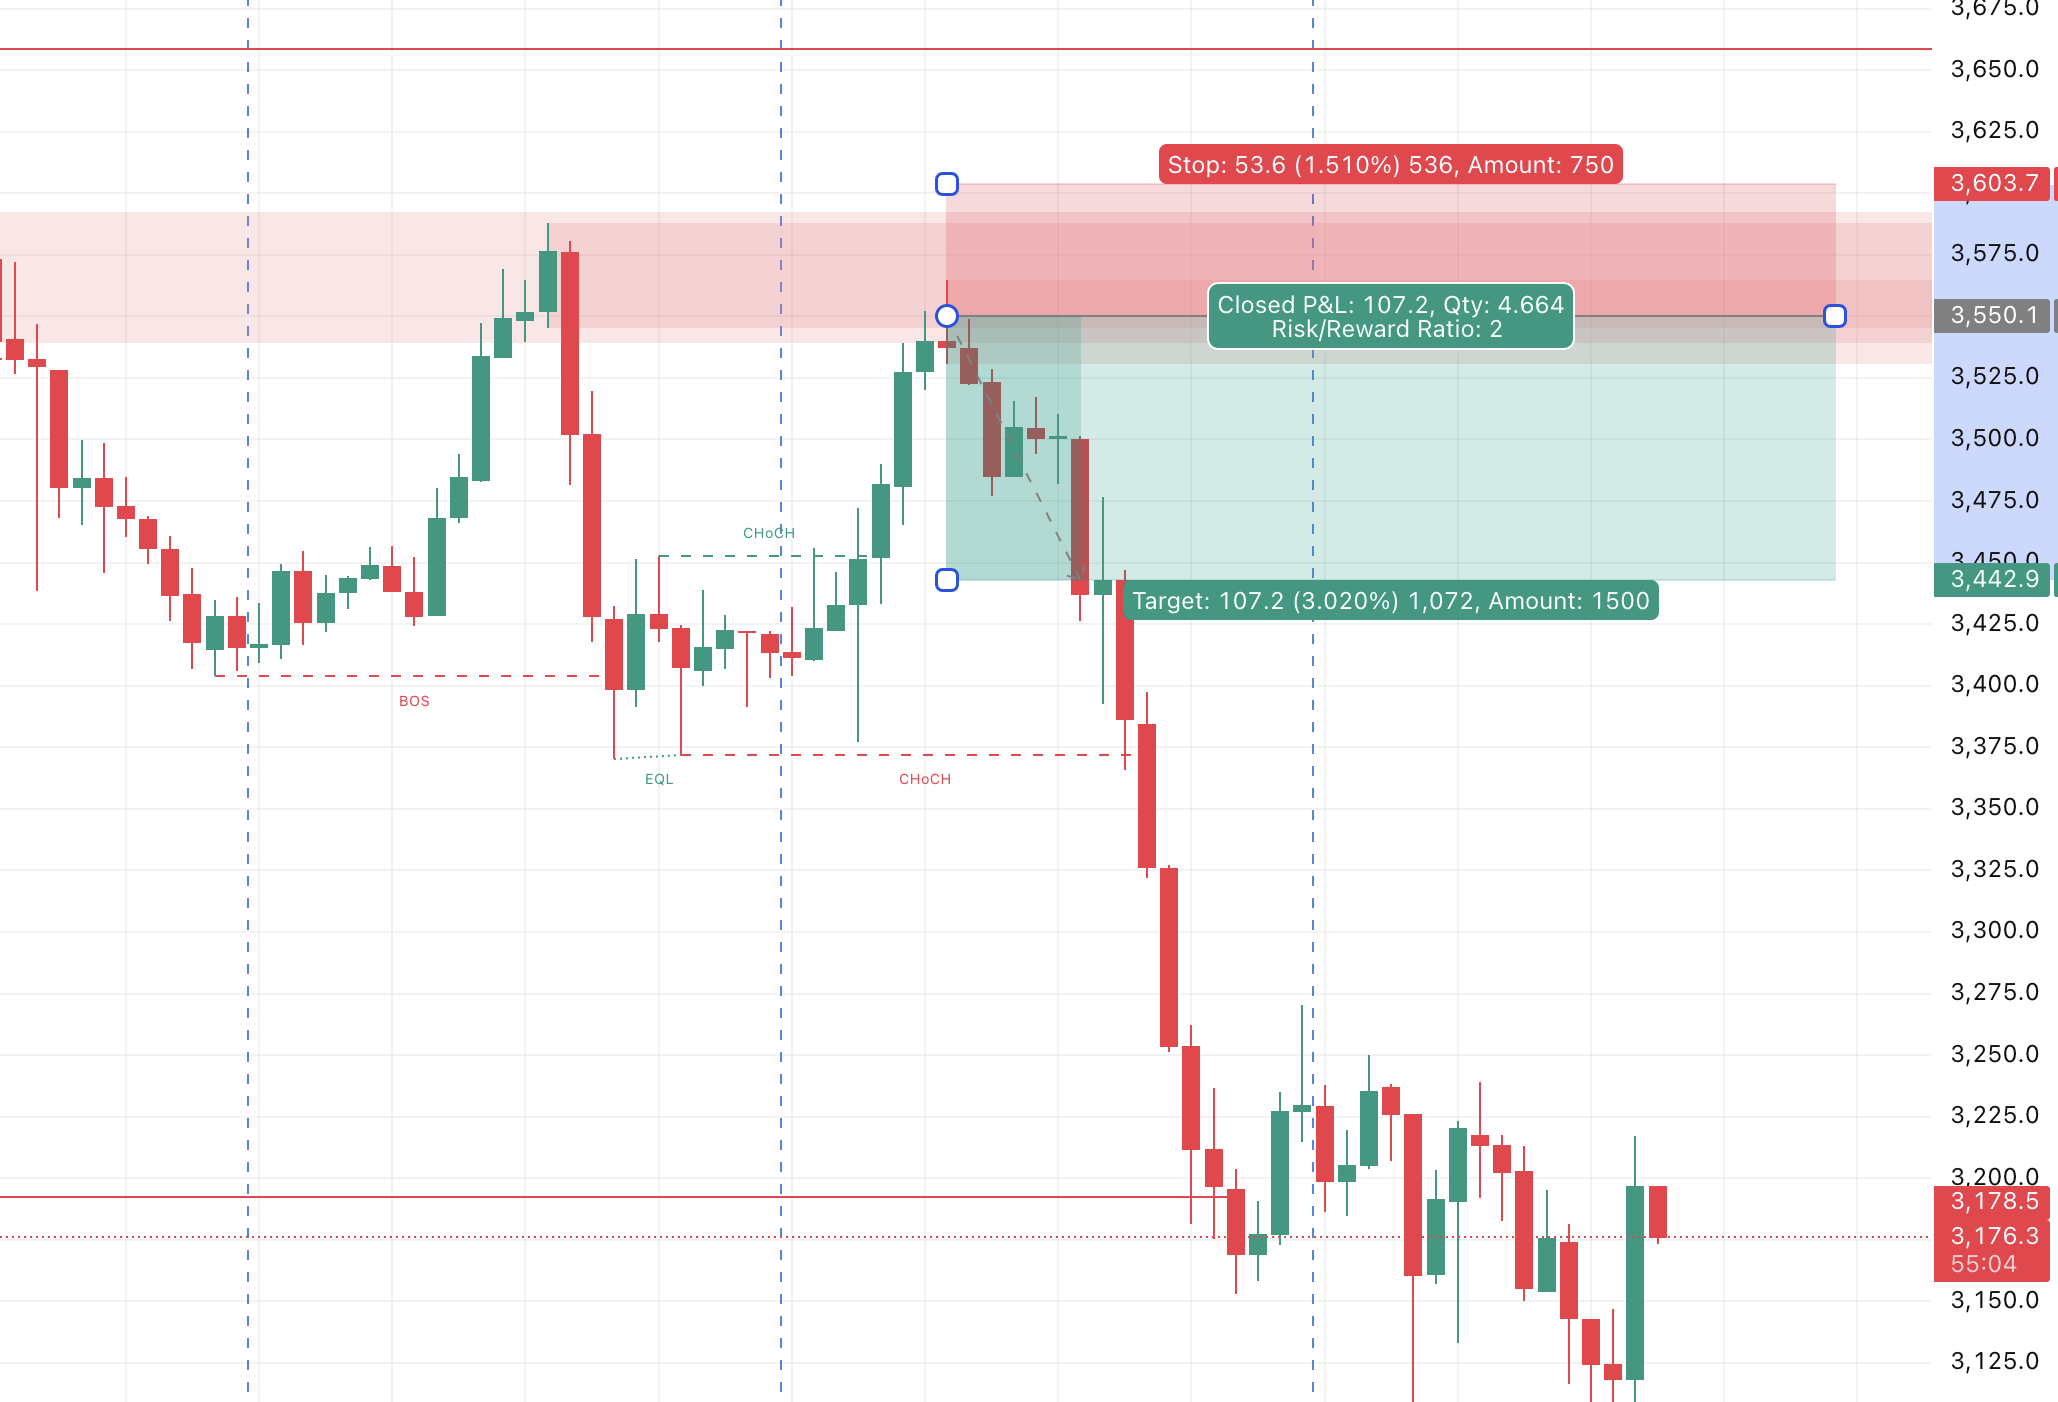
C. The Reversal Setup
What you’re doing: Catching the turn when momentum shifts direction.
Step by step:
- Look for double tops or double bottoms at major support or resistance levels. You need rejection candles at those peaks or troughs.
- Watch for the break of structure. In an uptrend, that means the price makes a lower high for the first time. In a downtrend, watch for a higher low.
- Enter after that structure breaks and price retests it.
Here’s an example: You see a double top at resistance with a big bearish engulfing candle. That tells you buyers tried twice and failed – they’re losing interest. That’s when you start watching for the reversal.

D. The Inside Bar Breakout
What you’re doing: Trading the expansion after compression.
Step by step:
- Spot an inside bar – a small candle completely inside the range of the previous ‘mother’ bar.
- Set a buy stop above the mother bar’s high and a sell stop below its low. You’re letting the market choose the direction.
- Keep your risk tight. False breakouts happen with inside bars.
This works best at key support/resistance zones or during strong trends. Otherwise, you’ll get whipsawed.
How I Manage Every Trade
You can have the perfect setup and still lose money if your risk management sucks.
Here are my rules when trading on price:
- Never risk more than 1-2% of your account on a single trade.
- Stop Loss Placement: Always behind structure. If you’re going long at support, your stop goes below that support zone. Don’t just pick random pip amounts.
- Take Profit: I aim for at least 2x my risk (2R). Sometimes 3x if there’s room to the next significant level.
- Trailing Stops: Once the trade moves in my favor, I move my stop behind each new swing high (in a long) or swing low (in a short).
The math is simple: If you risk $100 to make $200, you only need to be right 40% of the time to make money. That’s the power of consistency.
Risk management is especially important if you’re day trading derivatives on margin, where losses can be amplified and the risk to your capital is high.
Example Trade
Let’s put this all together with a concrete trade scenario.
The setup: pullback in an uptrend
The process:
- I’m on the daily chart, and I see clear higher highs and higher lows. Uptrend confirmed.
- Price pulls back to what used to be resistance but is now acting as support.
- I wait. I need confirmation, I’m not catching falling knives.
- A bullish engulfing candle forms right at that support zone. Buyers just showed their hand.
- I enter on the close of that candle or the open of the next.
- My stop goes just below the last swing low – below the structure that should hold.
- My target is either the next resistance zone or 2x my risk, whichever comes first.
When you trade prices like this, you’re not gambling. You’re reading what the market is showing you and reacting accordingly.
Mistakes I’ve Made (So You Don’t Have To)
- Trading Every Little Price Movement: Not every candle is a signal. You need patience. Wait for your setup.
- Ignoring Structure: A fancy candle pattern means nothing if it’s in the middle of nowhere. Context is king.
- Chasing Price: I used to jump in after a big move, thinking it would keep going. It usually didn’t. Wait for pullbacks or retests.
- Moving My Stop Loss: When a trade goes against me, I used to move my stop, hoping it would turn around. That’s how small losses become significant losses. Stick to your plan.
- Trying Too Many Things At Once: I started with simple price action, then added indicators, followed by strategies from YouTube, and then… You get the idea. Pick one or two setups and master them.
If you avoid these mistakes, you’re already ahead of 80% of retail traders.
Building Your Own Price Action Trading Plan
Here’s how to get started:
- Pick one or two setups from this guide. Start with pullbacks – they’re forgiving and offer a good risk-to-reward ratio. Backtest them. Review old charts to see how these setups have played out. Most platforms have replay features.
- Keep a trading journal. Write down why you entered, where your stop and target were, and what happened. This is where real learning takes place. It might feel boring but it can be valuable.
- Refine as you go. Notice patterns in your wins and losses. You’re building a skill here, not looking for a magic formula.
Bottom Line
Price action isn’t about predicting the future. It’s about reading what’s happening right now – understanding structure, seeing momentum shifts, recognizing when buyers or sellers are in control.
Keep your approach simple. Be patient and wait for your setups to be completed. Trade what you actually see on the chart, not what you hope will happen.
The clarity will come. Trust me, I’ve been exactly where you are now. Start with one setup. Master it. Then expand.