S&P 500 – Average Percent Gain in Up Year vs. Down Year


Based on historical data for the S&P 500 index going back to 1928:
- In up years (when the index has a positive annual return):
- The average annual percentage gain is around +20%.
- Up years occur around 72% of the time.
- In down years (when the index has a negative annual return):
- The average annual percentage loss is around -13.5%.
- Down years occur around 28% of the time.
- Up Year-to-Down Year ratio for the S&P 500 is 2.6:1
Variability in Year-to-Year S&P 500 Returns
Note that there is significant variability in both the down and up years.
The losses in down years have ranged from around -40% during the Great Depression to single-digit declines in milder corrections.
Similarly, the gains in up years span a wide range, with some very strong bull markets producing returns over +30%, while other up years have seen more modest gains in the +0-15% range.
A few additional data points
- The S&P 500 has averaged an annual return of close to +10% since 1928, with expectations of future returns equal to around the nominal growth rate of the economy (with a lot of variability due to changes in discount rates, risk premiums, and other factors).
- There have been positive years around 72% of the time historically.
- The largest single year loss was -47% in 1931.
- The largest single year gain was +54% in 1954.
While down years average around -13.5% and up years +20%, the actual yearly movements can vary considerably from these averages, both to the upside and downside.
These averages can vary a lot based on the time period and economic conditions considered.
Therefore, it’s essential to contextualize these figures within specific market cycles or historical periods for more accurate analysis.
This volatility highlights the importance of taking a long-term, diversified approach when investing in equities.
What Percent of the Years are Down Years and What Percent are Up Years?
Based on historical data for the S&P 500 index going back to 1928:
Up Years
Approximately 72% of the calendar years have been positive/up years for the S&P 500.
Down Years
Approximately 28% of the calendar years have been negative/down years for the S&P 500.
So nearly 3 out of every 4 years have seen the S&P 500 rise over the calendar year period, while just over 1 out of every 4 years have produced a down year for the index.
Note that down years can cluster together, like during the Great Depression years of the 1930s or the multi-year bear market of the early 2000s after the tech bubble burst.
But overall, the historical data shows that positive years outweigh negative years by about a 2.6-to-1 ratio for the S&P 500 index over its lifetime.
Why This Information Can Be Important for Options Strategies
This isn’t necessarily random trivia, it can actually be important to know for certain strategies.
For example, for traders employing options strategies over a 1-year timeframe, the historical averages for S&P 500 returns in up and down years become less relevant.
What matters more is the probability of an up year versus a down year, and the potential payoffs relative to the defined risk of the option premiums paid – i.e., the expected value.
Specifically:
Options Traders May Care More About Discrete Events Than Averages over Continuous Time
The 72% historical probability of an up year is more pertinent than the average +20% gain in those years.
As an options trader, you may not need to capture the full upside, just profit if the index is higher at expiration.
Capped Downside
In a down year, the downside is capped at just the upfront premium paid for put or call options. So the average -13.5% drop is less critical than just the 28% probability of any negative return occurring.
In this context, an options trader may be willing to “set and forget” defined-risk option trades if they are comfortable with the probabilities based on the historical tendencies – capturing a 72% chance of an up year with potentially high payoffs using spreads if successful, while risking only the premium paid (capped loss) if it’s a down year.
More Customized Exposures with Better Risk/Reward
Option strategies can be structured to have far better risk/reward parameters than just buying/selling the underlying index itself.
Judiciously trading spreads can reduce cost while still participating in a bullish or bearish directional move.
Rather than fretting over the specific extent of annual moves, the trader utilizing options likely puts more emphasis on stacking the odds in their favor and maximizing risk/reward through skilled option structuring and strategy design.
The historical tendencies guide trade structuring more so than precisely predicting future average returns.
Example of How We Can Use This Information in Real-Life
Let’s say a trader wants to buy a bull spread on the S&P 500 to capture up to 15% upside on the index over a one-year timeframe.
Let’s say the trader does this on the SPY and pays $3,950 for an at-the-money call with a one-year expiration and sells a 15% out-of-the-money call with a one-year expiration for $650.
The net outlay is $3,300. And let’s say this is 6.6% of the value of the index.
Some important info before calculating our expected values:
- Of the up years, 57% had a return of less than 15%.
- 43% of the up years had a return of over 15%.
- For the 57% of up years for the S&P 500 that had an annual return under 15%, the average gain was 8.5%.
So, we have 3 basic buckets – mild up year, good up year, and down year.
Expected Value
Running some expected value calculations using this info:
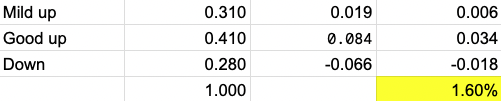
So we have an expected value of 1.6% for this trade.
This seems low, but with defined-risk, we have benefits to consider:
Benefits
- We aren’t using available cash in our account because we’re doing this as an options trade rather than buying the underlying. So there are opportunity cost considerations given this ties up less collateral.
- Since we have a defined risk, we can leverage this trade by simply buying more of it. We always know the maximum we can lose, which is the net premium.
- If we bought 5x the amount we would normally buy, we would have a maximum loss of $16,500 (5 * $3,300 net premium) and an expected value on the trade of around 8.0% (5 * 1.60%).
- You’re long vega (volatility) with an long ATM call/short 15% OTM call type structure.
- This is because the long ATM call contributes more to the spread’s vega than the short 15% OTM call subtracts from it. Thus, the spread benefits from an increase in implied volatility, as the increase in the value of the long ATM call due to higher volatility will outweigh the loss in value of the short OTM call.
- Advanced traders who don’t have a tactical view on volatility may choose to be compensated for neutralizing their vega by shorting something else (e.g., a deeper OTM call or in some other part of the portfolio), which can bring in income and add to the overall yield of the trade.
- But it can also bring subsequent changes to the portfolio elsewhere, such as changing delta and gamma exposure, which has to be monitored (and could induce other hedging costs that negate that benefit).