Fractals in Finance, Markets & Trading (Scale Invariance)


Fractals and scale invariance are two interrelated concepts in mathematics and physics that also have applications in finance, markets, and trading.
These concepts provide a framework for understanding the behavior observed in financial markets and for developing trading strategies that can adapt to the nature of market data.
Key Takeaways – Fractals in Finance, Markets & Trading (Scale Invariance)
Benoit Mandelbrot & Fractals in Markets
Benoit Mandelbrot was a mathematician who discovered that financial markets exhibit fractal geometry in the 1960s, best known for studying fractals in cotton futures markets (paper is the second-linked citation at the bottom of this article).
He showed that price movements aren’t smooth or predictable but rather chaotic and self-similar across different time scales.
His work challenged the traditional view of market efficiency.
It introduced the concept that markets are a lot more complex than known at the time, and that their movements can be better understood through the lens of fractal mathematics.
It argued that there are patterns and structures previously unrecognized.
He’s known for his book The (Mis)Behavior of Markets.
Fractals & Scale Invariance in Markets – Key Concepts
Fractals
Fractals are complex geometric shapes that can be split into parts, each of which is a reduced-scale copy of the whole.
This property is known as self-similarity.
In finance, fractals are used to describe the self-similar patterns observed in market prices over different time scales – this could mean finding similarity in trends at the daily level as well as at the multi-year level.
Scale Invariance
Scale invariance refers to the property of a system or process that looks similar at any scale.
In financial markets, this means that patterns of market behavior (such as price movements, volatility clusters, etc.) are similar regardless of the timeframe observed, from minutes to days to years.
Math Behind Fractals
Here’s a basic overview of the mathematics behind fractals and fractal geometry:
Key Properties of Fractals
- Self-similarity – The shape repeats at smaller scales
- Fractional dimension – Usually exceeds topological dimension
- Derived from recursive or iterative processes
Key Equations
Similarity dimension:
- Ds = log(N)/log(1/r)
Where:
- N = number of self-similar pieces
- r = scaling ratio
Box-counting dimension:
- Db = lim ε→0 (log Nε)/log(1/ε)
Where:
- Nε = number of boxes of side length ε covering the fractal.
Iterated Function Systems
- Fi(X) = ψi(X) + ei
Where:
- Fi = contraction mapping
- ei = offset
- ψi = transform
Fractals arise from nonlinear dynamical systems, chaos, and recursion. They model many natural patterns.
The math reveals self-similarity across scales via fractional dimensions.
Analytic fractal geometry complements classical Euclidean geometry.
Applications in Finance & Markets
Modeling Market Behavior
Fractals and scale invariance allow analysts to model market behavior in a way that better accounts for market prices.
These models help in understanding the underlying structures and dynamics of financial markets.
Risk Management
Recognizing instances of fractal market behavior can help with understanding the likelihood of extreme market events (tail risks) that fractal models can better capture.
Trading Strategies
Traders use fractal-based indicators (such as the Bill Williams Fractals indicator) to identify potential trend reversals and to set entry and exit points.
These strategies are based on the idea that certain patterns precede price movements, which can be identified and exploited for profit.
Market Analysis
Fractal analysis helps in identifying patterns that repeat across different time scales.
Aids in the analysis of long-term trends and short-term fluctuations.
This approach provides a more holistic view of market dynamics than traditional linear analysis.
How Traders Use Fractals
Fractal Indicators in Technical Analysis
Some traders use fractal-based technical indicators to identify repeating patterns in price charts.
These indicators highlight potential turning points in the market, where price movements may be likely to change direction.
Time Scale Flexibility
Traders apply fractal analysis across multiple timeframes to confirm trends and signals.
This multiscale approach may enhance the reliability of trading signals, as market trends generally exhibit scale invariance (or at least do more often than they don’t).
Entry and Exit Points
By identifying fractal patterns, traders can pinpoint more precise entry and exit points.
This could improve the timing of trades, which can potentially lead to higher profitability.
Volatility Clustering & Risk Management
Understanding the fractal nature of volatility (where applicable) allows traders to adjust their risk management strategies.
Challenges & Limitations of Fractals in Finance
Coding Example – Simulating a Fractal Financial Time Series
We’ll implement a basic example of fractals in finance using Python, focusing on the concept of self-similarity and fractal geometry to model financial time series data.
import numpy as np
import matplotlib.pyplot as plt

# Parameters for the simulation
time_steps = 1000 # Total number of time steps
volatility = 0.04 # Base level of volatility
base_price = 100 # Starting price

# Initialize the price series
price_series = np.zeros(time_steps)
price_series[0] = base_price

# Generate the price series with volatility clustering
for t in range(1, time_steps):
    random_walk = np.random.normal(0, np.sqrt(volatility))
    price_series[t] = price_series[t-1] * (1 + random_walk)

# Plotting the generated fractal-like time series
plt.figure(figsize=(14, 6))
plt.plot(price_series)
plt.title('Simulated Fractal-like Financial Time Series with Volatility Clustering')
plt.xlabel('Time')
plt.ylabel('Price')
plt.grid(True)
plt.show()
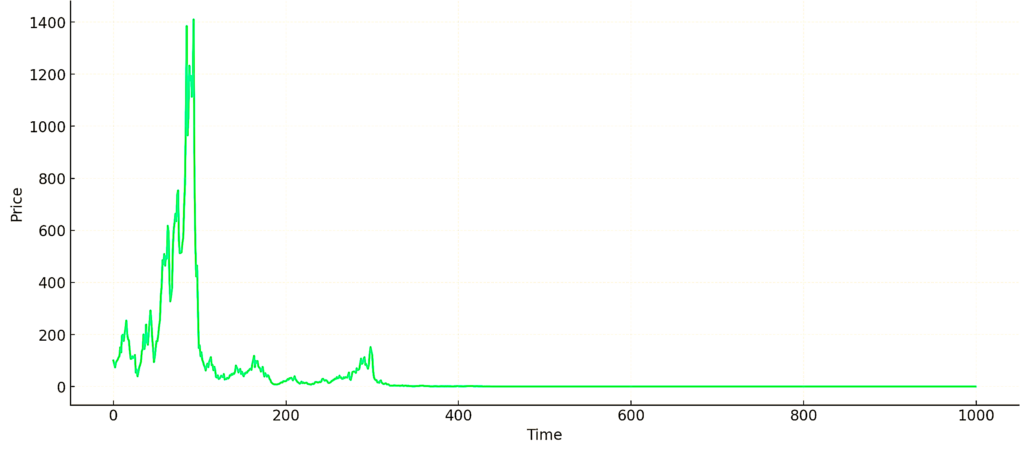
Explanation
Volatility Clustering
This script simulates a price series where changes are based on a normal distribution (for simplicity) with a fixed level of volatility.
This reflects how real market prices can exhibit periods of high and low volatility – a fractal-like property known as volatility clustering.
Simple Random Walk
Each price is calculated by applying a random change to the previous price.
This emphasizes the incremental and unpredictable nature of financial markets.
Visualization
The resulting plot shows how prices evolve over time, with the pattern of changes hinting at the complex and self-similar structure of financial time series data.
This code provides a simplified model of a financial time series that captures basic fractal properties – such as self-similarity and unpredictability – without going into the recursive fractal generation.
Visual Plot
The plot below displays a simulated fractal-like financial time series with volatility clustering, demonstrating how prices can evolve over time in a manner that reflects the complex and self-similar structure of financial markets.
This visualization captures the essence of volatility clustering – a key fractal property – showing periods of relative calm interspersed with sudden movements, a characteristic often observed in real financial data.
Simulated Fractal-Like Financial Time Series with Volatility Clustering
Conclusion
Fractals and scale invariance enable traders and analysts to develop more nuanced models of market behavior, improve risk management practices, and devise trading strategies that are adaptable to changing market conditions.
Nonetheless, no model or strategy can perfectly predict market movements, and the use of fractals could be part of a comprehensive approach that includes other forms of analysis and risk management techniques.
Article Sources
- https://link.springer.com/book/10.1007/978-1-4757-4017-2
- https://www.jstor.org/stable/2351623
The writing and editorial team at DayTrading.com use credible sources to support their work. These include government agencies, white papers, research institutes, and engagement with industry professionals. Content is written free from bias and is fact-checked where appropriate. Learn more about why you can trust DayTrading.com