The Effects of Stock Buybacks


This article answers the questions of what is a stock buyback and the effects of share repurchase programs on financial metrics.
What is a stock buyback program?
Stock buyback programs are made by companies in order to reduce the number of shares held by the public.
Given a company cannot act as its own shareholder, any shares repurchased are absorbed back into the company.
This serves to increase the ownership stake of each investor in the company given the pie would thereby be effectively sliced into fewer pieces.
This tactic serves to boost earnings per share by increasing the net income relative to the number of shares outstanding ratio.
A repurchase can be a beneficial investment for a company when its stock may be undervalued or when it’s the best use of cash. (Other options include issuing dividends, new capital expenditures, hiring more employees, investing in new R&D or technology, etc.)
However, a company buying back its own shares may also indicate a strategy used to artificially inflate earnings per share (EPS) ratios to make the company appear more financially robust than it actually is.
Studying the effect of stock buybacks
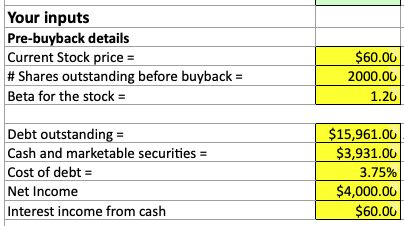
To implement this model in spreadsheet form, we need the following inputs with respect to the pre-buyback details:
- Current stock price before the announced buyback
- Number of shares outstanding before the buyback
- Beta of the stock (how volatile it is relative to the market)
- Debt outstanding
- Cash and marketable securities
- Cost of debt
- Net income
- Interest income from cash
There is also a place in the spreadsheet to enter a “fair value” price for the stock.
This is most typically completed through a discounted cash flow (DCF) model or by looking at the work of several other analysts. It is perfectly fine to enter no. (This spreadsheet can be found on Aswath Damodaran’s website under corporate finance.)
![]()
The “fair value” figure will help determine the value transfer to remaining shareholders, which is equal to:
- Value transfer = (Value per share (“fair value”) – Price per share at which the stock is repurchased) / Number of shares repurchased
As for buyback inputs we need the following information:
- Expected buyback price
- Number of shares bought back
- Amount of cash funding the buyback
- Amount of new debt funding the buyback
- Cost of new debt
- Risk-free rate
- Market risk premium
- Marginal tax rate
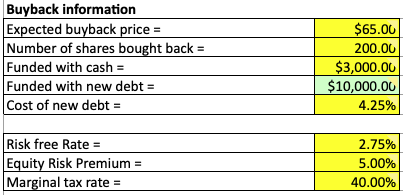
The cost of new debt is the interest rate at which the firm could take out a loan.
The risk-free rate is the long-term government bond yield.
The market risk premium, often termed the equity risk premium, or ERP, is specific to the company and where it operates geographically.
There are also ERPs available online for each country and can be a reasonable approximation that won’t significantly throw off the outputs of the model.
Value Impacts of Share Buybacks
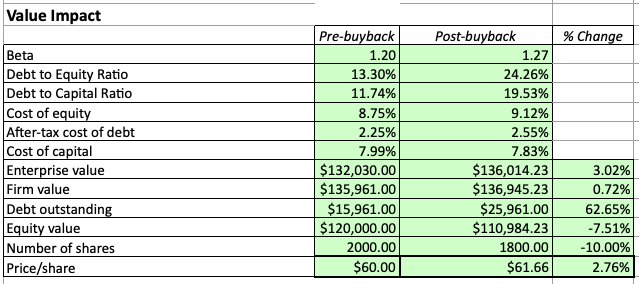
The value impacts determine the extent to which those inputs affect the following variables both before and after the buyback:
- Beta
- Debt to equity ratio
- Debt to capital ratio
- Cost of equity
- After-tax cost of debt
- Cost of capital
- Enterprise value
- Firm value
- Debt outstanding
- Equity value
- Number of shares
- Price/share
Beta
Post-buyback beta is equal to:
- [Pre-buyback beta / (1 + (1 – Debt to equity ratio, pre-buyback))] * (1 + (1 – Debt to equity ratio, post-buyback))
Debt to equity ratio
Debt to equity ratio pre-buyback is the amount of debt outstanding divided by market capitalization or:
- Debt outstanding / (Current stock price * Number of shares outstanding before buyback)
For the debt to equity ratio post-buyback the relationship is a bit more complex:
- Debt outstanding + (Expected buyback price * Number of shares repurchased– Amount of buyback funded with cash) / (Market cap – Total buyback sum)
The denominator could further be broken into:
- Current stock price * Number of shares outstanding before buyback – Expected buyback price * Number of shares repurchased
Debt to capital
Our debt to capital ratio is the debt to equity ratio divided by the sum of the debt to equity ratio plus one:
- Debt to equity ratio / (Debt to equity ratio + 1)
Cost of equity
For the cost of equity we use the standard cost of equity formula using the Capital Asset Pricing Model (CAPM):
- Cost of equity = Risk-free rate + ß * Equity risk premium
After-tax cost of debt
The after-tax cost of debt before the buyback equals:
- Cost of debt * (1 – Marginal tax rate)
If the buyback was coordinated using 100% cash, then we can use the same formula as above for the post-buyback after-tax cost of debt.
However, if that was not the case the we simply take the new interest rate attached to the debt used to fund the repurchase:
- Cost of new debt * (1 – Marginal tax rate)
Cost of capital
The cost of capital takes into account the capital structure of the firm and how it is comprised. It is the discount rate in the FCFF discounted cash flow model. In this model it can be calculated as:
- Cost of capital = Cost of equity * (1 – Debt to capital ratio) + After-tax cost of debt * (1 – Debt to capital ratio)
In general, cost of capital takes the general form of weighting each component of the capital structure by its relative proportion and adding them together. Above, we are simply taking the cost of equity figure and multiplying it by the relative proportion of equity in the firm, and doing the same with respect to debt.
Enterprise value
The enterprise value of a firm in the pre-buyback period is equal to the market cap of the company plus its debt outstanding minus any cash or marketable securities.
It is made to denote the value of the firm, or the purchase payment that would be reached with all security holders.
Enterprise value is commonly used in valuation multiples.
Firm value
The firm value is the enterprise value plus any cash listed on the firm’s recent financial statements.
In the post-buyback period, enterprise value takes on a more complex form:
- EV = EV, pre + EV, pre * (Cost of capital, pre – Cost of capital, post) / (Cost of capital, post – Risk-free rate)
Equity value
Equity value in the pre-buyback period is the same as market capitalization, or share price multiplied by the number of fully diluted shares outstanding.
(Diluted shares are the number of shares that would be available if all sources of conversion were exercised. Undiluted shares simply refer to common stock and do not include preferred stock, stock options, convertible bonds, and so forth.)
Equity value in the post-buyback period is firm value minus debt outstanding.
Price per share
The price per share is of course the equity value divided by the number of shares outstanding.
In a buyback transaction, the price per share should increase as the number of shares circulating will be lessened. Equity value will often be lower in a buyback if it was financed through taking out more debt.
But if [equity value / shares] < [(equity value – new debt) / (shares – shares purchased)], the share price will increase.
Value Transfer in Stock Buybacks
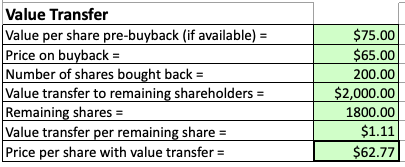
When the buyback is completed, we must look to see how the value is transferred. Namely, how does total equity increase or decrease, what is the value increase or decrease per share, and what is the new share price?
The total increase in equity can be calculated by:
- Equity increase = (Fair value per share – Buyback share price) * Number of shares purchased
This is the total amount of wealth that would be distributed to all current shareholders. To find the value transfer per remaining share, we take the value of that equity increase and divide by the number of shares outstanding after the buyback is completed.
Effect on EPS
When a company completes a stock buyback they are often chiefly concerned about the effect on earnings per share, as this is a metric that determines the operational efficiency and financial health of the business.
We can calculate the before and after effect on five main variables:
- Market capitalization
- Price per share
- Net income
- Earnings per share
- PE ratio
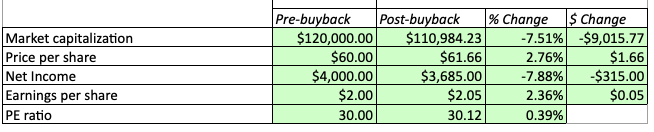
Market capitalization
Market capitalization, as mentioned is price per share multiplied by the number of outstanding shares (fully diluted). In the post-buyback assessment, market capitalization is equal to enterprise value minus debt outstanding.
Price per share
Price per share pre-buyback is equal to the market capitalization divided by the number of shares. In the post-buyback period, it is equal to:
- $/share, post = Market cap, post / (Number of shares – Number of share repurchased)
Net income
Net income can be gleaned right off the income statement, and refers to the pre-buyback state. For the post-buyback state, we must deduct any items that reduce the figure.
So net income equals:
- NI, post = NI, pre – Interest income from cash – Debt – Interest rate on debt * (1 – Tax rate)
Earnings per share
Earnings per share, or EPS, is simply pre-buyback net income divided by the number of shares for the pre-buyback period.
For post-buyback, we calculate as follows:
- EPS, post = NI, post / (Number of shares – Number of shares repurchased)
P/E ratio
And the price/earnings ratio, or P/E ratio, is the price per share divided by earnings per share.
P/E ratios can have different meanings and interpretations.
Stocks with higher P/E ratios tend to have:
- higher forecasted earnings growth
- relatively low current earnings (based on expectations), or
- are simply overvalued (i.e., future earnings growth may not be realized)
Stocks with lower P/E ratios will tend to have:
- lower forecasted earnings growth (i.e., may represent a company not growing much or projected to decline)
- relatively high current earnings (based on expectations), or
- may represent a bargain
If all other things are held equal, and stock A has a P/E of 30 while stock B has a P/E of 10, stock B will be considered a more attractive investment as it may signal an undervalued investment.
However, stock A may be a better investment in the long run, which is why investors are paying more for its current level of earnings relative to stock B. Namely, stock A is discounted to provided more earnings further out in the future.
The longer duration nature of a high P/E stock’s cash flows tend to make these investments more volatile relative to the market.
Conclusion
A company will choose to buy back stock if company decision-makers deem that it’s in the best interest of the company.
They may feel their stock is undervalued and its price could use a boost by “mopping up any excess” shares at the slight expense of a dip in equity value.
However, it could be used less as a means of investment, but rather to artificially enhance suffering financial ratios.
It is in the best interest of investors and analysts to do their due diligence in deciding the motive for the buyback and whether it represents an organic financial motivation or to unnaturally prop up financial ratios that may paint a less than appealing picture of the firm’s quality as a stock investment.