Stock Market Making New Highs: Can It Continue?


This article was published on November 6, 2019.
The US stock market recently made new highs.
Recession fears caused by inverted yield curves are overblown. While an inverted yield curve has been a strong statistical correlate to a recession over the past five business cycles in the US, it doesn’t get at the underlying reasons for them.
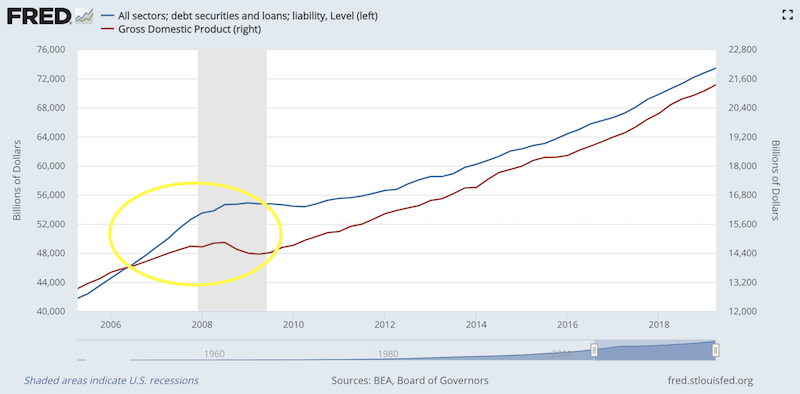
In reserve currency countries, recessions typically occur because of a contraction in private sector credit creation. This is caused by the inability for debt to be paid back, leading to defaults, which lowers creditworthiness. This causes creditors to pull back and become more cautious, which compounds the issue. Less borrowing leads to less spending, asset prices decline, which leads to less collateral availability. So, credit situations are made either better or worse in a self-reinforcing way on both the upside and downside. This pattern quickly begins to resemble a cycle.
As a general principle, debt growth cannot exceed income growth indefinitely. It’s one of the major market equilibriums to keep track of.
Broadly speaking, there are three main sectors in the economy to watch – the household sector (also often called the consumer), the corporate sector, and the government sector.
At the household level, we don’t see the same type of debt issues that emerged in 2007 where consumer debt growth – and the servicing requirements associated with it – were well in excess of income. Debt growth is currently more or less in line with income growth, so the vulnerabilities aren’t there in the consumer sector.
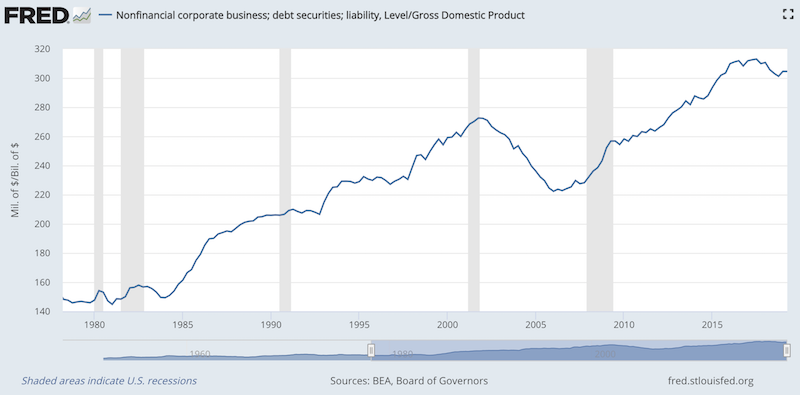
There are some issues with respect to corporate debt growth and commercial real estate. But with rates so low, the debt servicing is not a problem.
The government sector has bloated debt to GDP levels, though in the US it’s been declining this cycle.
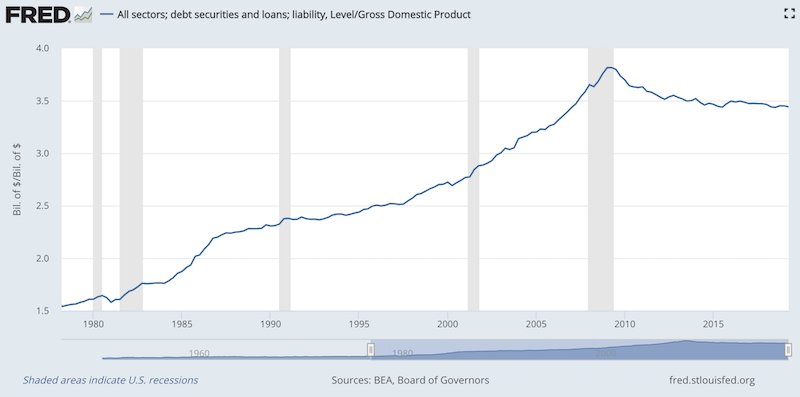
These liabilities are more manageable at the sovereign level (assuming they’re denominated in domestic currency, which allows them to control these obligations). Governments can buy their own debt. In other words, the central bank can create reserves (a cash asset), buy the debt directly and put it on its balance sheet. They can also, depending on the laws, monetize it directly, or virtually pay it off.
These are not costless decisions, as they have ramifications for the value of its currency. (It depreciates.)
But “printing money” is often the easiest among the various options. It’s hard to cut spending because so many people rely on these types of obligations being fulfilled. It’s hard to raise taxes without causing capital flight or people leaving in general.
Growth and Earnings Looking Forward
Based on various forward indicators – i.e., hard data that leads output and survey-based measures – economic growth and earnings will be soft.
We estimate that US GDP will run at about 1 percent annualized in the near-term. Investment and exports are weak, but consumption and the labor market is holding output growth in the 1.5%-2% range.
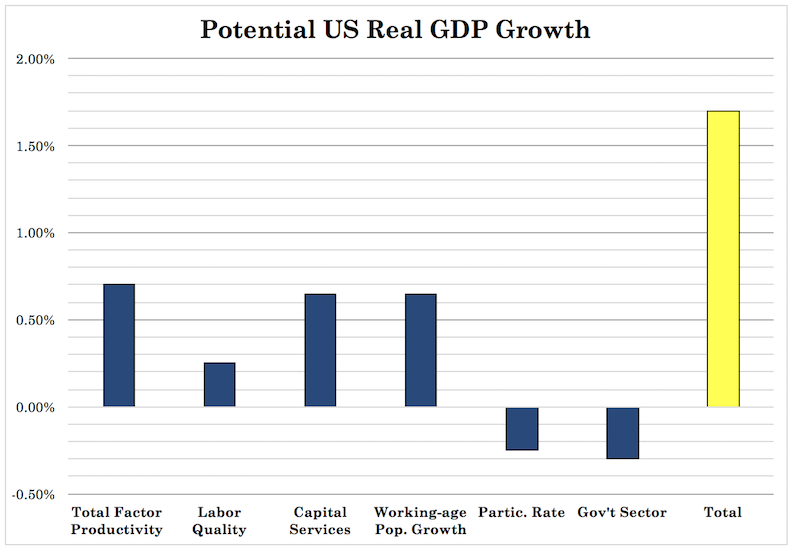
Long-term US potential is around 1.7-1.8 percent. This accounts for the following breakdown:
– Total factor productivity = ~70bps
– Labor quality = ~25bps
– Capital services = ~65bps
– Working-age population growth = ~65bps
– Participation rate = ~minus-25bps
– Government = ~minus-30bps
As mentioned, you don’t have the same issues in 2007 with the large debt growth in the household sector and the housing- and bank-related vulnerabilities in relation to income growth.
Sovereign debt and non-debt (e.g., pensions, healthcare obligations) growth is too high and primary deficits are getting worse. Developed market rates will need to keep declining to keep the servicing manageable. Currency devaluations and debt monetizations will pick up over time.
When the rates get very low it’s like an automatic rollover of the debt, which means they can defer paying back the principal. The US Treasury could also consider cutting the coupon sizes on its debt to accommodate more Treasury bill issuance and also ease the tax-related seasonal issues that takes liquidity out of the financial system in April.
So, it’s likely that there’s going to be a general slump in growth without the sharp, surgical drop we saw 11 years ago.
Fiscal surplus countries – e.g., Germany, Netherlands, Switzerland, Norway – could also chip in to avoid having so much of the stimulus responsibility from falling on central banks. Those four countries represent about $110 billion worth of spending potential if they were to get back in balance, which is worth about 80bps of total euro area GDP. This would raise global real rates by about 12bps in terms of its proportion to total global GDP, which is a bit above $90 trillion.
Where will stocks go?
With stocks, you have a current effective duration of 18. In other words, when you put up a lump sum investment into stocks, you would expect to earn that amount back (in a sense, double your investment) in 18 years.
Only one additional 25-bp rate cut is priced in the rates market in perpetuity. So, the Federal Reserve has 130bps to work with.
Multiplying the two together will get you to the potential stimulative boost to equities – 18 multiplied by (potentially) 130bps worth of contraction in corporate borrowing costs, assuming a parallel shift and one-to-one feed-through – is a 23-24 percent tailwind to stocks, holding all else equal.
With the S&P 500 index at 3,075 at the time of writing, that gives a potential price of 3,800 (3,075 * (1 + 18*1.30/100).
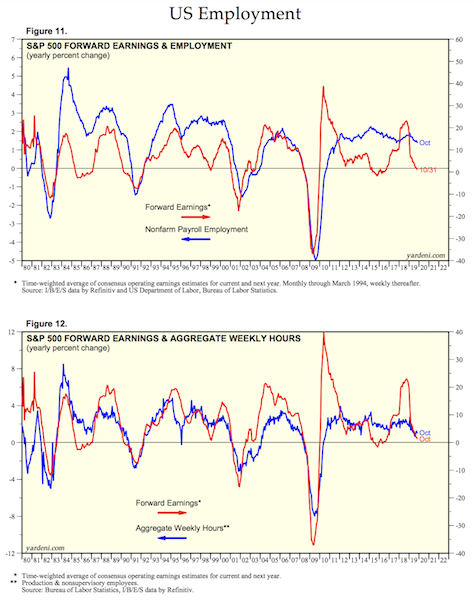
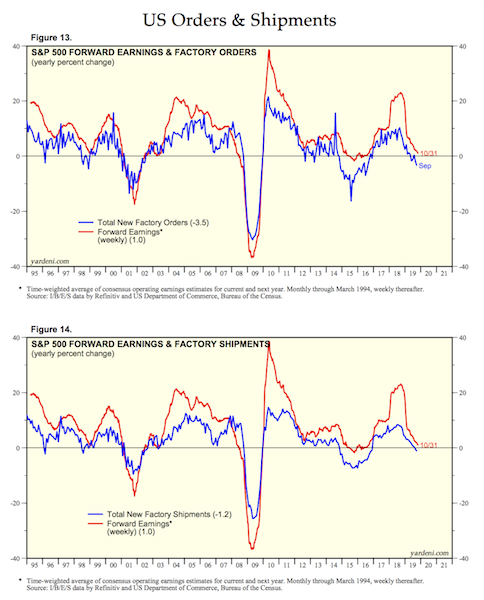
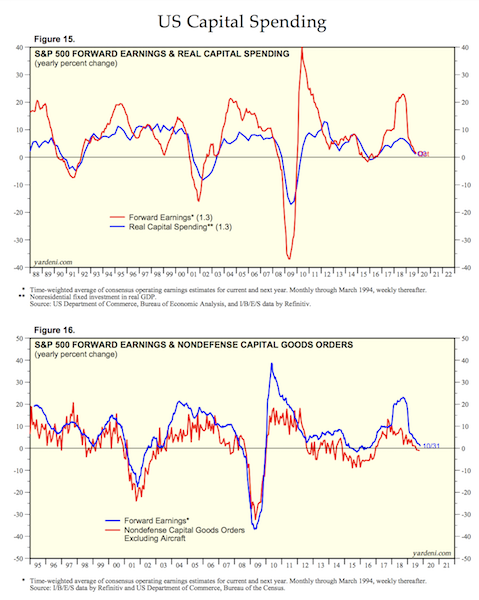
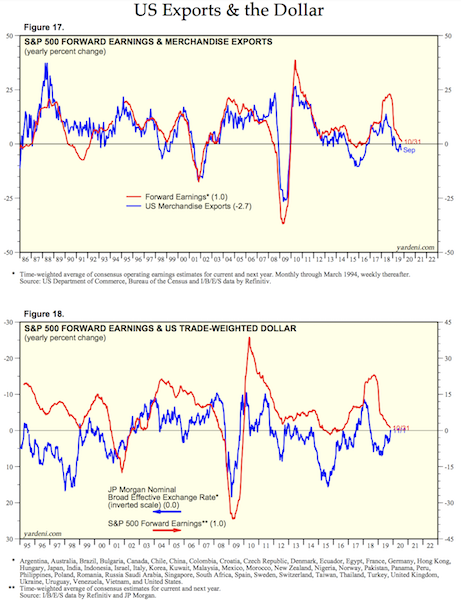
Based on various forward leads, earnings will be about flat going forward – e.g., ISM (manufacturing / services / prices), raw industrials, industrial production, business sales, merchandise exports, global exports, trade-weighted USD, capital spending, non-defense capital goods orders, factory orders and shipments, hours worked.
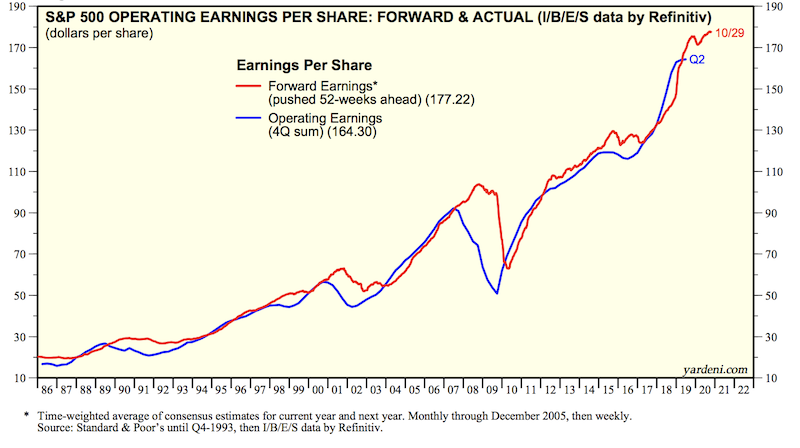
US Earnings
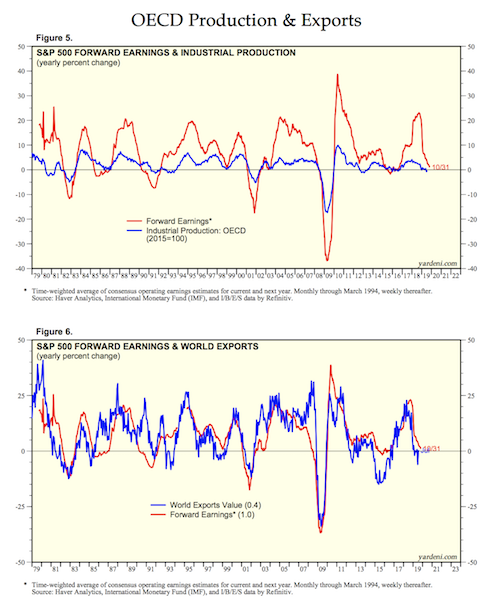
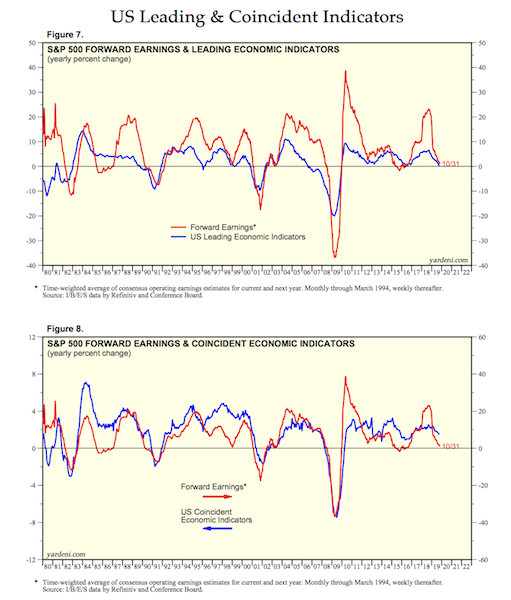
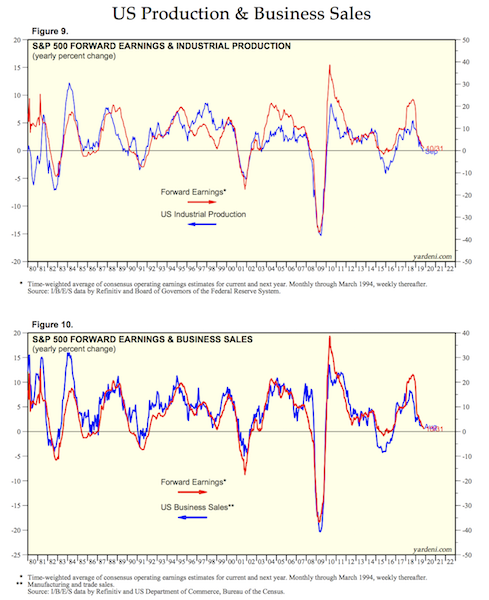
Here are various charts produced by Yardeni Research on metrics tying together corporate earnings and the economy. As you can see by triangulating among these readings, earnings growth is projected to be very low.
General earnings per share data
OECD Production and Exports
US Leading and Coincident Indicators
US Production and Business Sales
US Employment
US Order and Shipments
US Capital Spending
US Exports and the Dollar
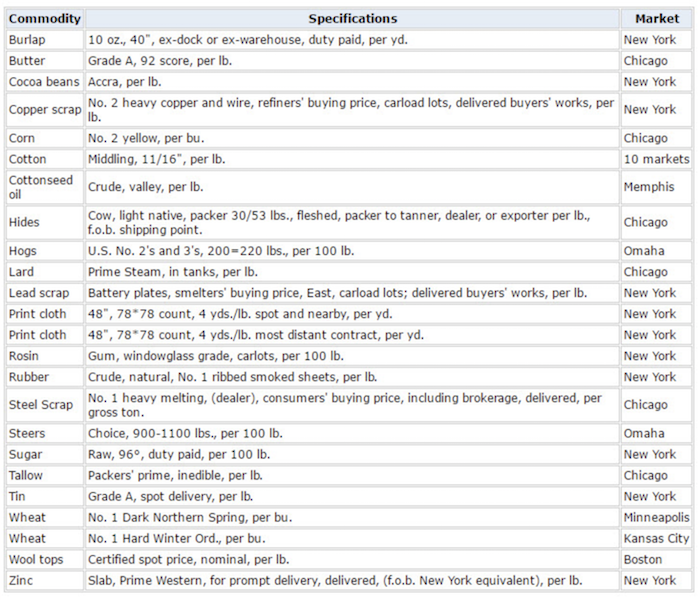
CRB Raw Industrials Index
The CRB raw industrials index has traditionally been a strong indicator of where stocks will go.
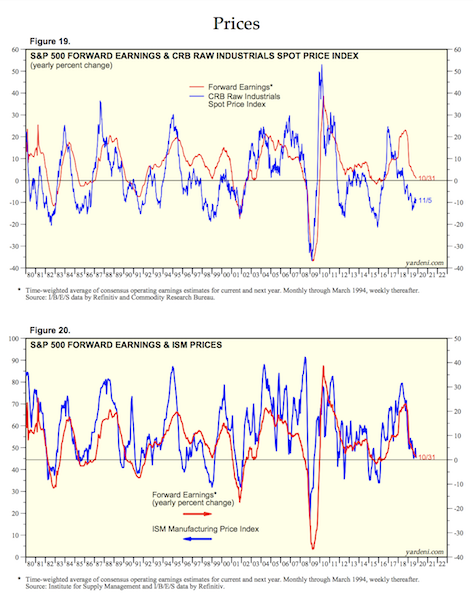
Its components include a mix of various commodities, which are industrial feed-ins:
US Managers Indexes
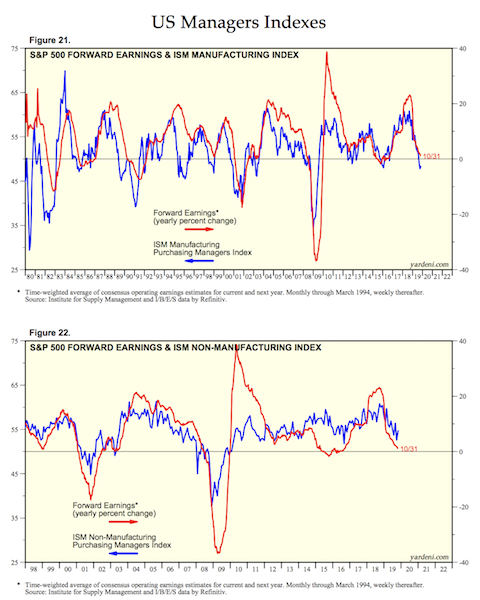
Many assume that if economic growth and earnings are strong then stocks will go up in conjunction.
However, stocks are priced off a combination of the forward expectations of earnings in relation to the forward expectations in the path of interest rates. If earnings come in to expectations (almost always expected to grow), but rates increase beyond what’s priced into the curve, then stocks will decline.
This is what makes trading more difficult than what it seems to be about in a general way – whether things turn out good or bad.
If you’re a sports bettor, it’s pretty easy to know what teams are going to be good and what teams are going to be bad going into a season. But turning this knowledge into profitable bets is not easy because those expectations are already reflected in the lines on each of the bets. We know with a pretty high degree of resolution what companies are going to be profitable and produce positive cash flow and to what degree. But the fluctuations in the price are relative to how new data and information comes in with respect to expectations.
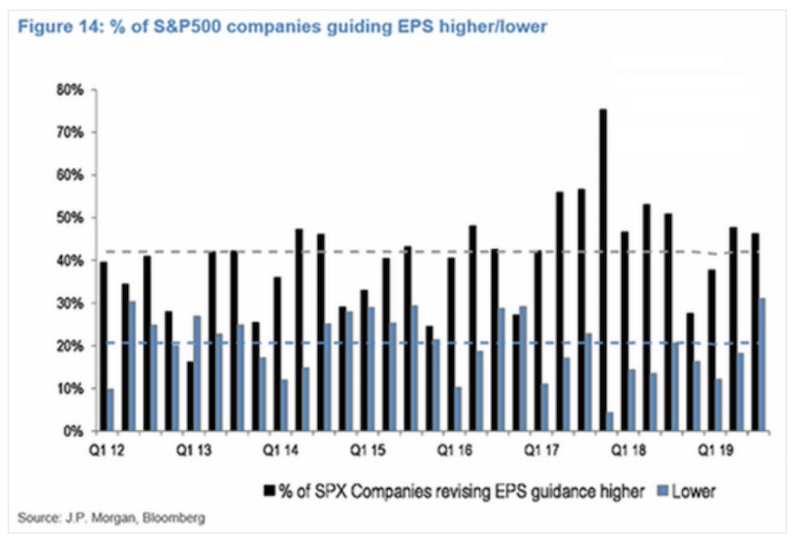
Earnings declined during points in the 2015-16 period – there was an “earnings recession” over six quarters – but the drop in rates more than compensated. Accordingly, at least in the US, stocks rose.
For now, more companies are guiding higher than lower.
Current Yields and Risk Premiums
Another one of our main equilibriums is how the yield on cash compares to the yield on various forms of bonds and how those compare to equities.
For the economic system to work properly, the yield on cash must be below the yield on bonds, which must be below the yield on stocks and by the appropriate risk premiums. Only occasionally and for short periods can these premiums be inverted. (Sometimes, they are a preferred policy choice by central banks to pull back on excess risk taking.)
Cash has a yield specified by a short-term sovereign bond, which is about as risk-free as any financial security out there. In the US, a three-month Treasury bill yields 153bps. This is roughly considered the US cash rate. It might also be similar to the rate you receive on cash in a savings account, though this is set at the discretion of the bank and may be higher or lower than the rate set by the country’s central bank for various reasons.
Bonds have a yield, though they vary materially based on the duration and level of credit risk priced by the market. Many pay attention to yields like the US 10-year. US Treasuries are considered the world’s reserve asset. For those looking in the other main reserve currency countries (e.g., EUR, JPY), they might look at the 10-year German bund yield and Japanese government bond 10-year.
We can also look at the yield on corporate bonds of various credit grades. The grading system is determined by various ratings agencies. AAA is considered the highest credit grade. These are the closest to being a “sure thing” in terms of avoiding default. CCC or lower is considered the lowest grade, which is typically given to companies that are distressed and in danger of going bankrupt.
Stocks also have an implied yield, though it is not explicitly stated in the same way it is on cash and bonds. Stocks are also much more volatile than cash and more volatile than most forms of bonds. Moreover, they don’t have a set expiration date like most fixed-income securities as their cash flows are theoretically perpetual. Though some produce dividends, these types of payments are not guaranteed and much of the returns of stocks come from capital appreciation rather than dividend payments.
So, the idea of stocks having a “yield” is more conceptual than explicit. We can, however, infer the yield of stocks through the price earnings ratio.
For example, if the S&P 500 index is projected to yield 170 in earnings one year forward and its current level is 3,075, that “yield” is 5.38 percent. Traditionally, the implied yield of the US equities market is comparable to the US B yield.
Another way is by backing out forward returns estimations using growth estimation. The inescapable reality is that the value of an asset cannot over the long term grow faster than its earnings do.
So, if using 1.7-1.8 percent long-run growth, 1.8 percent inflation, and some effect from financial engineering (lower interest rates, central bank asset buying, more corporate consolidation, more buybacks, and so on) that gives an extra 1-2 percent per year, that would also get in the high-4 percent to high-5 percent range.
This is where we are currently across all the main US-based asset buckets:
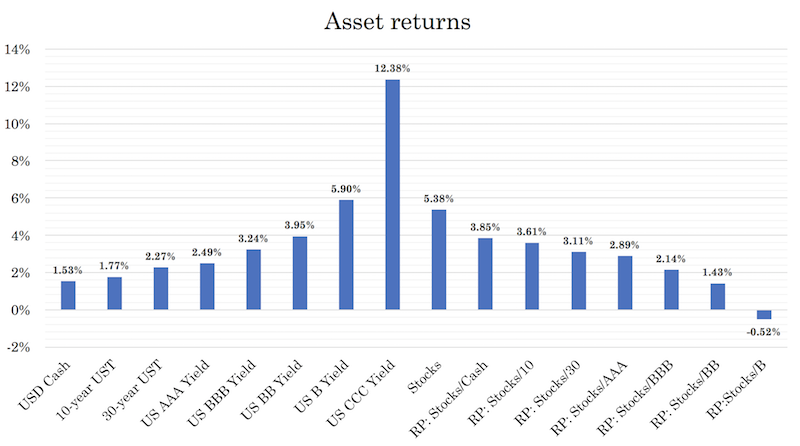
The implied premium of stocks over cash is 385bps based on the 3-mo UST and forward implied earnings yield. This puts the forward Sharpe at exactly 0.25 using annualized volatility of 15.4 percent (3.85 divided by 15.4), which is pretty standard for excess returns relative to excess risks. A range of 0.2 to 0.3 is the expected Sharpe ratio of any traditional asset class – e.g., stocks, bonds, real estate, private equity – where excess risks will necessarily outweigh excess returns. Sharpe ratios cannot be very high over the long-run otherwise large amounts of capital would flow into them, bid up their prices, and reduce their forward returns.
You may also note that this only compares US assets, but it’s important to keep things in constant currency terms only. Bond rates in most of developed Europe are negative, but when hedged into US dollars they are very comparable to the mildly positive returns on US Treasuries. This is due to interest rate parity, covered more in a separate article. Asset returns, because of the foreign exchange differences, don’t mean that much.
The returns between stocks and bonds are indeed different between markets even when the FX is hedged. But this largely reflects a different overall mix in terms of duration and credit risk.
One’s starting point should be that all assets are equally good. All assets compete with each other and can be made to yield comparably through the use of leverage (e.g., through the futures market or through other forms of leverage or leverage-like techniques). There are very few no-brainers. Generating alpha is not an easy thing to do and a zero-sum game.
Forward potential
Central banks have broad authority over where asset markets go. They control a large part of the liquidity in an economy.
Central banks are responsible for creating cash and influencing the credit creating capacity of the economy. Accordingly, this is why investors and traders pay such close attention to them and why such subtle variations relative to expectations can cause material changes in asset prices.
Currently, there’s a huge supply of capital to invest courtesy of the central banks, and not enough viable outlets for it. This has gotten to the point where in certain cases high creditworthy borrowers are being paid to take out spending capacity by their creditors (i.e., negative interest rates).
You also see it with startups and CCC-rated companies that don’t have viable unit economics and have shown no path to being profitable. The idea for central bankers is to push liquidity into the system. This will, in theory, help push money and credit into the real economy to push up activity and inflation. But the most creditworthy participants have the lowest propensities to spend and want to invest it instead.
At the same time, the least creditworthy people have limited access to this capital pile, which exacerbates wealth and opportunity gaps. It also contributes to shifting political winds where populism has become more popular. Because some people feel left behind they have a stronger likelihood of electing political leaders with stronger personalities who will claim to fight for the common people against the “elites” and there are flavors of populism across the ideological spectrum.
In all developed countries, there are large amounts of not only debt but non-debt obligations such as healthcare and pensions that will be increasingly unfunded. The returns they assume to remain funded long-term (6-7 percent) are unlikely without pursuing excessive risk. Moreover, due to demographics, a smaller proportion of earners will be tasked with funding them, as the expected receivers of these benefits grows.
To fund growing spending deficits, governments will have to sell a lot of bonds. Most of this cash to buy the bonds won’t feasibly be absorbed by the private sector, but will have to come from the central banks. Lower spending and higher taxes are an option, but that capacity is limited and politically unpopular. Even though the funds aren’t available to service all these obligations, it’s very unlikely that they’ll be defaulted on.
Debt is essentially a “short money” position. To cover it, the central banks will need to create more cash, which means currency depreciations. While not a common topic now in the financial media, currency depreciations will become increasingly prevalent in the future. At the same time, currency depreciations are very zero-sum in nature in that they are always relative to another currency. It’s simply a form of financial engineering.
Currency depreciations also occur before the fall in bond yields. Though currency devaluations are inherently inflationary, they don’t produce much in the way of inflation because what’s really happening is deflation is being negated. Countries have been through this over and over throughout history. The US depreciated its currency and bought up its own debt during the Great Depression in the early 1930s.
While currency devaluations typically come with increased inflation expectations, causing bond yields to rise and their prices to fall, but long-term rates will generally decline thereafter (assuming this process is being done in a reserve currency where there are minimal debt obligations in a foreign currency). This is because people want safety and liquidity. Traders value the US dollar as the world’s top reserve currency and prize Treasury bonds, which are a deep and liquid market with minimal credit risk. So even though the currency declines, it doesn’t necessarily mean that the bond market – the promise to deliver a lot of that currency in the future – is bad.
In the short-term, central banks, most notably the US Federal Reserve, have some capacity to push up asset prices. For now, asset markets look fine. But longer-term commitments will squeeze growth rates. Obligations coming due will create a funding squeeze, which will also diminish the long-run returns of financial assets and pressure the viability of the world reserve currencies as store-holds of wealth.
For the past decade-plus coming out of the financial crisis, the lowering of interest rates and asset buying (over $15 trillion worth) has created more money and credit, lifted asset prices, and made people wealthier.
But the long-term path is unsustainable and these problems will become more difficult to kick the can down the road on going forward.