Poisson Processes in Finance, Markets & Trading


Poisson Processes are a fundamental concept in stochastic processes, which are widely used in finance, markets, and trading to model random events that occur independently of each other within a fixed period of time.
These events are characterized by some level of unpredictability (and sometimes rarity), such as defaults on loans, arrivals of orders in an exchange (coding example below), or jumps in asset prices.
Understanding the key concepts and applications of Poisson processes can provide traders with better insights into market behavior and can help in developing trading strategies.
Key Takeaways – Poisson Processes in Finance, Markets & Trading
- Poisson Processes offer a mathematical framework for modeling the randomness and discreteness of events in financial markets.
- Modeling Event Frequencies
- Poisson processes are ideal for modeling the frequency of discrete events in finance, such as trades, order arrivals, or defaults.
- Provides a framework to estimate the likelihood of events over a specific timeframe.
- Risk Analysis and Management
- By quantifying the expected number of events, traders can better assess and manage the risk associated with rare but impactful financial events.
- Strategic Decision Making
- Understanding event distributions helps traders and portfolio managers make informed decisions about timing – e.g., optimizing trade execution or adjusting portfolios in anticipation of market movements.
Poisson Processes – Key Concepts
Poisson Distribution
Central to the Poisson process, it describes the probability of a given number of events happening in a fixed interval of time or space, assuming these events occur with a known constant mean rate and independently of the time since the last event.
Rate Parameter (λ)
This is the average rate at which the events occur per unit of time.
A higher λ indicates a higher frequency of events.
Time Homogeneity
The property that the process is independent of time – i.e., the probability of an event occurring is the same in any time interval of equal length.
Discrete Events
The Poisson process models occurrences that are discrete; there is no half-event.
It’s suited for counting events like transactions, defaults, or jumps in asset prices.
Math Behind Poisson Processes
Here’s a basic overview of the mathematics behind Poisson processes:
Key Properties
- Counting process N(t) that has independent increments
- Increment ∆N(t) ~ Poisson(λ∆t)
- Number of events in interval (s, t] is Poisson with mean λ(t – s)
Key Equations
- P(N(t) = n) = (λt)^n * e^(-λt) / n!
- m(t) = E[N(t)] = λt
Where λ is the rate parameter.
Poisson processes, outside of finance, are often used to model event arrival times in queueing systems, radioactive decay, and phone calls.
The memoryless property leads to mathematical tractability. Poisson processes form the foundation for more complex point processes.
Applications in Finance, Markets, and Trading
Order Arrivals
In high-frequency trading, order arrivals at stock exchanges can be modeled using Poisson processes.
Provides insights into the flow of orders and helping in the design of algorithmic trading strategies.
Credit Risk Modeling
The default events of loans or credit instruments can be modeled as a Poisson process.
Useful in calculating the probability of default over a time period, and thus in pricing credit derivatives and managing portfolio risk.
Market Jump Risk
Asset price jumps, often caused by sudden news or events, can be modeled with a Poisson process.
This is important for options pricing models that account for jump risk, like the Merton model.
Operational Risk
Financial institutions use Poisson processes to model the frequency of operational loss events, such as system failures or fraud incidents, which helps in risk management and regulatory capital determination.
How Traders Can Use Poisson Processes
Risk Management
By understanding the likelihood and frequency of extreme market events, traders can better manage risk through diversification and hedging positions to protect against unexpected jumps or downturns.
Strategic Trading
Traders can use Poisson processes to anticipate the arrival rate of orders and adjust their trading strategies accordingly – i.e., optimizing order execution in algorithmic trading.
Options Pricing
Traders involved in pricing options can incorporate jump risks into their models.
Offers more accurate pricing in markets known for sudden movements.
Portfolio Diversification
By modeling the occurrence of rare events across various asset classes or instruments, traders can make informed decisions on portfolio diversification to mitigate concentration risk.
Coding Example – Poisson Processes in Financial Markets
Below we design a simple Poisson process to plot a visualization of a Poisson process representing “event arrivals” over time (e.g., the number of trades made in a market each day), with an average rate of 5 events per unit time over a 30-day horizon.
This example simulates the occurrence of events (such as trades in a financial market), and shows how they might randomly distribute over a specified period.
import numpy as np
import matplotlib.pyplot as plt

# Set the rate parameter for the Poisson process (e.g., average number of trades per unit time)
lambda_param = 5 # Average number of events (e.g., trades) per unit time (e.g., per day)

# Sim a Poisson process over a time horizon
time_horizon = 30 # Total time horizon (e.g., 30 days)
num_events = np.random.poisson(lambda_param * time_horizon)

# Generate event times
event_times = np.sort(np.random.uniform(0, time_horizon, num_events))

# Plot the Poisson process - number of events over time
plt.figure(figsize=(10, 6))
plt.step(event_times, range(1, num_events + 1), where='post')
plt.xlabel('Time')
plt.ylabel('Number of Events')
plt.title('Poisson Process - Event Arrivals Over Time')
plt.grid(True)
plt.show()

# Estimate the probability of observing a specific number of events
n = 100 # Number of events to observe
prob_n_events = ((lambda_param * time_horizon) ** n) * np.exp(-lambda_param * time_horizon) / np.math.factorial(n)
print(f"Probability of observing {n} events: {prob_n_events:.4f}")
Poisson Process (ex. Trades Made in a Market Over Time)
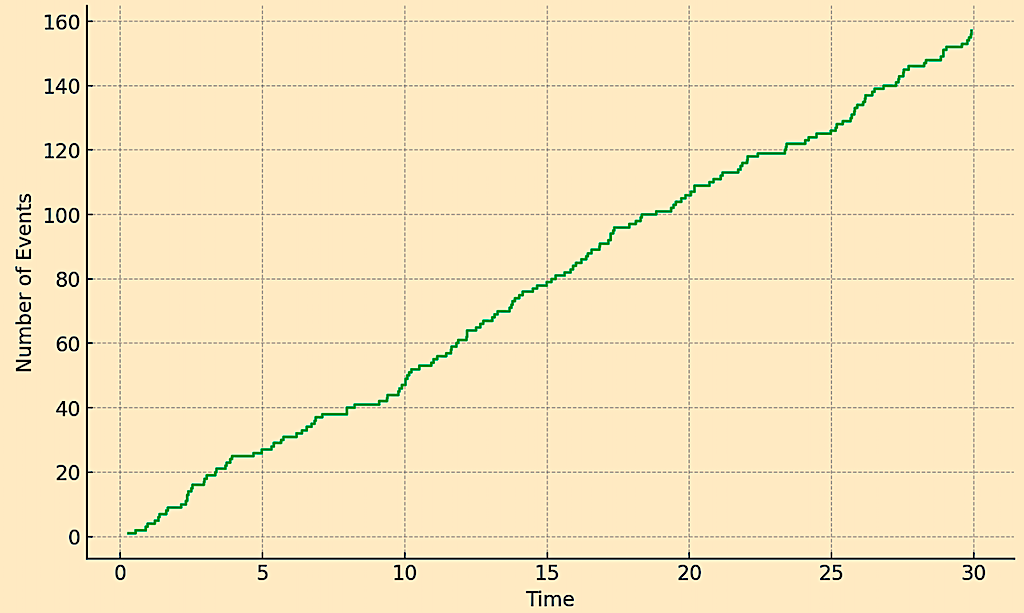
The calculated probability of observing exactly 100 events in this timeframe is extremely low (rounded to 0.0000 in this specific simulation) since about 150 would be expected (5 events for every 30 days).
This highlights the Poisson process’s use in estimating the likelihood of different numbers of events occurring over time, which can be important for planning and risk assessment in finance and markets.
But let’s say we shortened the timeframe to 5 days and 5 events per day.
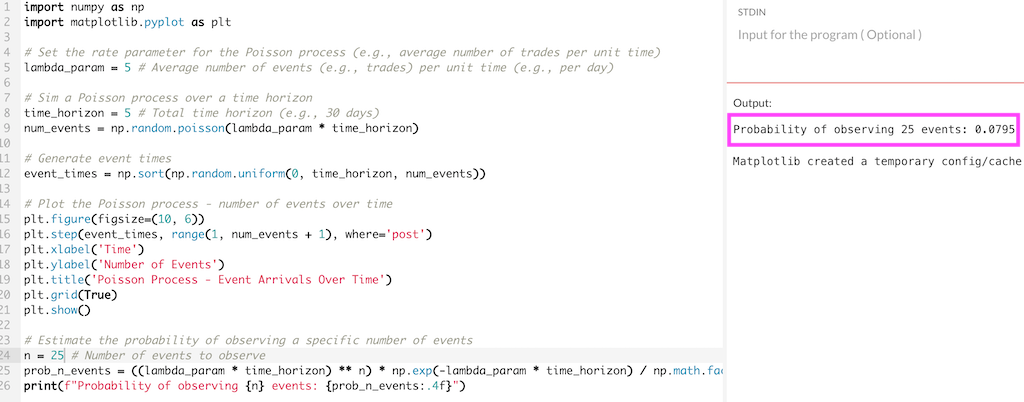
Now the probability of getting exactly 25 events would be around 8%.