High-Returning ETFs


What are the highest-returning – but sustainable – ETFs?
What we’re doing in this article isn’t just listing option-income funds (like JEPI or QYLD) or levered ETFs (which aren’t appropriate beyond day trading purposes due to tracking error) but ETFs that are more strategically engineered to provide higher returns.
These could include overlays, alt exposures, or risk premia captured in a systematic way. Funds that could have a real chance to beat stock indexes over time.
Most of the ETFs we list here typically might generate higher returns than a basic stock index fund while keeping the volatility profile similar to, or slightly above, the S&P 500 or a global stock index.
For the typical saver or market participant, most of these may be unappealing.
However, for those who are young and prefer to take more risk, or those who want a higher return profile and are more risk tolerant, these could be something worth exploring.
Key Takeaways – High-Returning ETFs
- Look for ETFs that primarily involve overlays, alternative exposures, and risk premia captured systematically.
- Goal = Beat stock indexes with volatility similar to, or a bit above, the S&P 500.
- At the very least, improve risk-adjusted returns.
- Suits younger or more risk-tolerant market participants most.
- Core ideas:
- GDE (equity plus gold)
- HFGM/HEQT (hedged equity overlays)
- NTSX/NTSE/NTSI (90/60 stocks/bonds)
- Diversifiers:
- DBMF/CTA/KMLM (managed futures)
- RSBT (bonds plus futures)
- BTAL (anti-beta; long low-beta/short high-beta)
- PFIX (rate convexity)
- GDX (miners)
- There isn’t a “this is the one” fund that captures every goal, and you’ll still want to build a portfolio.
- One option is a core-satellite build: core NTSX, GDE, HFGM; satellites DBMF, CTA, BTAL or PFIX.
- Expect higher return potential with better risk-adjusted outcomes over cycles, though of course depends on construction.
- You can replicate many of these with futures. The key to market-beating returns is largely about capital efficiency and managing downside.
- But manage carry, sizing, and leverage carefully.
- Avoid overleveraging. Discipline and rebalancing matter.
- We run an example backtest toward the end of this article.
High-Returning ETFs
With all of these, we briefly describe the strategy, why it works, the return profile, and the appropriate use case.
1. GDE – WisdomTree Efficient Gold Plus Equity ETF
- Strategy – Combines global equities with a gold futures overlay. It’s essentially a 90/90 portfolio, giving 180% total exposure.
- Why it works – Gold has a different character as an asset and can potentially hedge equity drawdowns. It correlates reasonably well with inflation long-term (though very weakly short-term). It protects against currency devaluations. The overlay allows exposure to both without splitting capital. We listed GDE in our article about capital-efficient ETFs for that reason.
- Return profile – Historically ~10-15% in good years; smoother than pure equities. Because gold is owned as futures, leverage is embedded in the futures cost (contango-shaped curve).
- Use case – Core equity replacement with those who want gold exposure without taking away from core assets.
2. HFGM – Simplify Hedged Equity ETF
- Strategy – Core equity exposure (S&P 500) at slightly over 100% of the fund with a long overlay in various currencies, bonds, and commodities via futures overlays or other ETFs.
- Why it works – Designed to perform best in choppy, volatile markets (in relative terms).
- Return profile – In bull markets it still has the full stock exposure, but its use of other assets means those can kick in during periods that are less strong than the stock market.
- Use case – Long-term equity with diversification from other asset classes.
3. DBMF – iMGP DBi Managed Futures Strategy ETF
- Strategy – Replicates managed futures hedge funds with the use of trend-following models. Designed to be uncorrelated or even slightly negative correlated with equities.
- Why it works – Profits from momentum + crisis trends (commodities, rates, FX).
- Return profile – Low correlation to stocks; has returned 10-20% in bad years for stocks. It did well in 2022, for example.
- Use case – It’s better as a diversifier and not a long-term compounder. It can boost risk-adjusted returns, especially during equity drawdowns.
4. NTSX – WisdomTree 90/60 US Balanced Fund
- Strategy – 90% equities, 60% Treasuries via futures. Essentially levered balanced exposure.
- Why it works – Efficient capital use, improves return versus 60/40 portfolios.
- Return profile – Historically 10-14% with balanced drawdowns. The Treasuries are owned via futures, so you won’t receive coupons like being in a cash bond or the dividends like you would from a bond ETF.
- Use case – Those who want to own stocks up to nearly full exposure but with diversification from bonds.
5. PFIX – Simplify Interest Rate Hedge ETF
- Strategy – Convex long-rate options designed to profit from rising yields. Offers a distribution.
- Why it works – Acts as a hedge in inflationary or yield-spiking regimes. Generally has a negative correlation with stocks.
- Use case – Not a core holding, but can improve risk-adjusted returns when tactically used alongside equities.
Asset Correlations
| Name | Ticker | PFIX | SPY | Annualized Return | Daily Standard Deviation | Monthly Standard Deviation | Annualized Standard Deviation |
|---|---|---|---|---|---|---|---|
| Simplify Interest Rate Hedge ETF | PFIX | 1.00 | -0.59 | 17.65% | 2.51% | 10.80% | 37.42% |
| SPDR S&P 500 ETF | SPY | -0.59 | 1.00 | 12.86% | 1.11% | 4.62% | 15.99% |
| Asset correlations for time period 06/01/2021 – 09/30/2025 based on monthly returns | |||||||
6. BTAL – AGFiQ US Market Neutral Anti-Beta ETF
- Strategy – Long low-beta stocks, short high-beta stocks.
- Why it works – Typically gains in market stress periods when high-beta sells off.
- Return profile – Lags in big bull runs but can add value over full cycles.
- Use case – Market-neutral “vol dampener” that improves long-term compounded return when used in combination with equity beta. Basically the idea behind BTAL isn’t its returns on its own, but it can help smooth leveraged equity beta. It did well in 2018, the Covid-19 drawdown in 2020, and in 2022.
7. RSBT – Return Stacked Bonds & Managed Futures ETF
- Strategy – Combines bond exposure with a managed futures overlay.
- Why it works – Both income and trend-driven upside without splitting capital. Another entrant on our “capital efficiency ETF” list.
- Return profile – Similar total return potential to equities but designed to be uncorrelated.
- Use case – Defensive diversifier.
8. CTA – Simplify Managed Futures Strategy ETF
- Strategy – It’s like DBMF. Systematic trend-following across global futures.
- Return profile – 10-15% potential in sustained trends or macro dislocations.
- Use case – Adds asymmetric “crisis alpha” that compounds well with equities.
9. GDX / GOAU – Gold Miner ETFs
- Strategy – Equity exposure to gold producers.
- Why it works – Miners provide leveraged exposure to gold prices, often outperforming gold in bull cycles.
- Return profile – Modest correlation to equities (+0.24 to S&P 500) and strong correlation to gold (+0.83).
- Use case – Equity-based gold exposure with upside torque.
How to Build These Into a Portfolio
If your goal is to outperform a stock index sustainably, a core-satellite mix might work best:
- Core (60-80%): NTSX/NTSE/NTSI, GDE, and/or HFGM
- Satellites (20-40%): DBMF + CTA + BTAL or PFIX
That setup gives you broad equity growth, trend/carry overlays, and convexity exposure.
This is the same structure many institutional “return-stacked” or “risk parity-lite” portfolios use for high real returns and without taking on reckless leverage. (Leverage is used more for volatility/risk targeting.)
You can replicate many of these by using futures on your own. But you also need to learn about roll mechanics, the embedded leverage costs, and carefully calculate the exposure.
With products like futures it’s very easy to overleverage. The ETFs can recreate this exposure in a more passive way.
1. Overlay & Derivative-Enhanced Equity ETFs
These funds use futures, options, or structured overlays to amplify risk-adjusted returns.
NTSI / NTSE / NTSX – WisdomTree Efficient Core series
NTSX (US), NTSI (Int’l), NTSE (EM) use 90% equities + 60% bonds through futures.
- Capital-efficient “return stacking.”
- Expected returns – 10-14% over long cycles.
Pairing all three gives more global exposure with leverage efficiency.
SPD / SPYI – Simplify US Equity PLUS
This is an S&P 500 base plus option overlays or tail hedges.
- SPD (Defensive), SPYI (income-focused but still growth-oriented)
SPYI’s structure yields income but captures equity upside better than covered calls like JEPI.
JEPI – JPMorgan Equity Premium Income ETF
JEPI invests in large-cap US stocks and sells covered calls to generate consistent monthly income.
It targets lower volatility (about 25-30% lower than the S&P 500) and steady mid-to-high single-digit returns, trading some upside potential for reliable cash flow and smoother performance than the S&P 500.
It carries around a 90% correlation to the S&P 500. It performs best in more sideways or modestly bullish markets.
HEQT – Simplify Hedged Equity ETF
Similar to HFGM, but broader hedge timing logic using dynamic put spreads and convex options.
Think of it like “JEPI meets long vol with better convexity.”
About half the volatility of the S&P 500 with a bit better risk/return profile.
2. Managed Futures & Alternative Beta ETFs
These are systematic trend and carry strategies that thrive in high-volatility, macro-driven regimes.
KMLM – KFA Mount Lucas Managed Futures Index ETF
- Diversified across commodities, rates, FX, and equity index futures.
- Historically strong in 2022–2023 when stocks and bonds both fell.
- Return potential = 10-20% in macro dislocations, but weaker other times.
RSBT – Return Stacked Bonds & Managed Futures
Combines 100% bond exposure with 100% managed futures overlay.
- Double duty: income + trend
Currently one of the most innovative “return stacking” ETFs out there.
CTA – Simplify Managed Futures
Systematic trend-following, global, similar to DBMF but with more adaptive volatility sizing.
AMAX – Astoria US Enhanced Equity ETF
AMAX is a core equity ETF that uses factor tilts and derivatives to boost exposure.
A type of “smarter beta plus” portfolio.
3. Real Asset + Inflation Overlay ETFs
These deliver equity-like returns but with commodity and inflation exposure.
COM / PDBC – Broad Commodity ETFs
Direct commodity exposure via futures. In inflationary or dollar-weak regimes, these can outperform equities.
Best use is a small sleeve (5-10%) for inflation beta.
GUNR – FlexShares Global Upstream Natural Resources
Equities of commodity producers (energy, metals, agri).
Structural inflation hedge with growth exposure.
REMX – VanEck Rare Earth/Strategic Metals ETF
Encapsulates long-term electrification, defense, and tech metals.
Volatile, and poor returns looking backward, but high expected real return over a decade.
Can also be susceptible to strong rises and falls based on how “hot” a “smart” trend is.
4. Factor & Quantitative Equity Enhancers
These funds seek structural alpha through systematic tilts rather than simple beta.
AVUS – Avantis US Equity ETF
Smart-beta with small/value/profitability factors.
Tend to outperform standard cap-weighted indexes over full cycles.
AVGE – Avantis Global Equity ETF
AVGE is effectively a one-stop global “smart equity” portfolio.
DFAC – Dimensional U.S. Core Equity 2 ETF
Similar to AVUS, grounded in academic factor research (value, size, quality).
Expected long-term alpha = 1-2% annual over S&P 500, compounding meaningfully over time.
RPAR – Risk Parity ETF
Balanced exposure to global stocks, bonds, commodities, and TIPS.
Lower volatility, but strong risk-adjusted return profile.
5. High-Odds Diversifiers (Volatility & Convexity Premia)
These aren’t “core,” but they add convex return potential that helps the overall portfolio outperform through better volatility control and compounding.
IVOL – Quadratic Interest Rate Volatility & Inflation Hedge
Long volatility on yield curves + TIPS exposure.
Best in volatile rate environments.
PFIX – Simplify Interest Rate Hedge ETF
Deep OTM rate options that explode higher in rate spikes.
Tactical position that can pair well with equities.
6. Multi-Strategy Hybrids (Institutional-Style Return Stackers)
These are newer, more sophisticated ETFs that combine several sources of risk premia into one wrapper.
TYA – Simplify Risk Parity Treasury ETF
Bonds + convex rate hedges; volatility targeting.
This can complement risk assets.
Nonetheless, both stocks and bonds took a spill in 2022, and an inverse correlation isn’t a given.
DECT – Defiance Quantitative Tactical Equity ETF
Uses technical and macro models to shift between offense and defense.
A tactical quant fund that can meaningfully outperform buy-and-hold equities in volatile cycles.
In Short
Here’s a sample “Next-Gen ETF” shortlist designed to help beat standard stock indexes and/or improve risk-adjusted returns over time:
| Category | ETF | Core Idea | Estimated Return Range |
| Overlay Core | NTSX | Levered balanced portfolio | 10-14% |
| Hedge Overlay | HFGM / HEQT | Equity + convex vol overlay | 10-15% |
| Trend / Futures | DBMF / CTA / KMLM | Managed futures | 10-20% (uncorrelated) |
| Commodity Overlay | GDE | Equity + gold (90/90) | 10-15% |
| Smart Beta | AVUS / DFAC | Factor-driven equities | 10-12% |
| Convex Hedge | PFIX / CYA | Long convexity tail protection | Asymmetric |
Using Futures Instead of ETFs
You can do this directly using futures and options instead of ETF wrappers.
The idea is the same: use overlays to layer exposures on top of your base capital instead of trading one off for another.
With a commodity and futures overlay, you can hold your main assets (like stocks or bonds) and then add exposure to gold, other commodities, or trend-based strategies through futures contracts. This gives you these exposures without trading off your core.
If you get the structure right, you’ll likely end up with a portfolio that has better long-run returns per unit of risk and a smoother equity curve.
Futures are the most direct way to achieve this and are available to most traders/investors with margin capability.
Example Setup
A simple setup might look like this:
- Core – Long equities or equity index futures (e.g., S&P 500 or Nasdaq). Quality bonds are also good as the base, which can be a mix of nominal government/safe corporate and inflation-linked.
- Overlay – Gold or broad commodity futures to better protect against inflation. If you hold your base in bonds, then stocks can be an overlay. (A stocks and bonds portfolio will tend to get hurt when inflation comes in higher than expected.)
- Stability – Hold bonds or cash directly to offset leverage risk.
Because futures represent large notional exposure with small margin, you can control several hundred thousand dollars of assets with a fraction of that in capital.
Carrying Costs and Reducing Them
But it’s important to account for carrying costs, which reflect the financing rate embedded in futures pricing. These are reflected directly in the shape of the curve where you pay more in the future relative to the spot price.
To offset carry, there are various tactics traders can use.
Some use options overlays such as selling out-of-the-money calls on your futures exposure. This generates premium income that helps cover carry costs while modestly hedging downside.
Some use the yield from their core, like bonds.
Keep Leverage Reasonable
Keep leverage disciplined. Know your notional-to-capital ratio, backtest your exposure, and stay within prudent limits.
Futures come in fixed sizes, so use micro contracts for precision, if necessary. Rebalance as your portfolio grows to keep leverage stable.
Ultimately, the goal is capital efficiency, not amplifying movement for speculative purposes.
You’re using derivatives to gain diversified exposures (commodities, rates, or indices) on top of what you already hold. Manage carry, hedge with options, and size positions carefully.
If done correctly, a futures-and-commodity overlay portfolio gives you equity-like – or better than equity-like – returns but better diversified, lower drawdowns, and a higher reward-to-risk profile, just without relying on ETFs to do it for you.
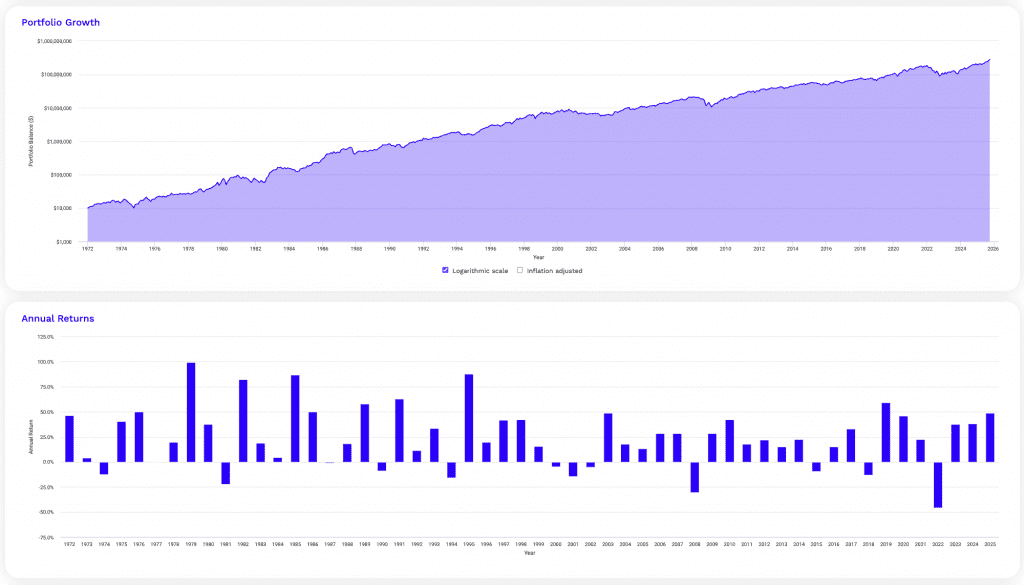
Backtest
Let’s say we ran this portfolio at 2x leverage (for every $1 of our own money, we had $1 borrowed, which we can do via futures):
| Asset Class | Allocation |
|---|---|
| US Stock Market | 45.00% |
| 10-year Treasury | 40.00% |
| Gold | 15.00% |
Assume that our cost of leverage is effectively 3%. We covered this calculation more in detail here.
Performance Summary
This covers a very long period, from 1972 to today:
| Metric | Portfolio 1 |
|---|---|
| Start Balance | $10,000 |
| End Balance | $283,505,282 |
| Annualized Return (CAGR) | 21.01% |
| Standard Deviation | 26.00% |
| Best Year | 99.32% |
| Worst Year | -45.73% |
| Maximum Drawdown | -51.67% |
| Sharpe Ratio | 0.70 |
| Sortino Ratio | 1.11 |
The worst year was 2022 because it was heavy in stocks/bonds (85%).
2008 did a bit better because bonds were good that year.
1981 was the third-worst year due to monetary tightness.
Some other summary statistics collected:
Risk and Return Metrics
| Metric | Portfolio 1 |
|---|---|
| Arithmetic Mean (monthly) | 1.88% |
| Arithmetic Mean (annualized) | 25.11% |
| Geometric Mean (monthly) | 1.60% |
| Geometric Mean (annualized) | 21.01% |
| Standard Deviation (monthly) | 7.51% |
| Standard Deviation (annualized) | 26.00% |
| Downside Deviation (monthly) | 4.51% |
| Maximum Drawdown | -51.67% |
| Benchmark Correlation | 0.84 |
| Beta(*) | 1.39 |
| Alpha (annualized) | 6.51% |
| R2 | 69.99% |
| Sharpe Ratio | 0.70 |
| Sortino Ratio | 1.11 |
| Treynor Ratio (%) | 13.06 |
| Calmar Ratio | 2.37 |
| Modigliani–Modigliani Measure | 15.43% |
| Active Return | 10.15% |
| Tracking Error | 15.49% |
| Information Ratio | 0.66 |
| Skewness | -0.22 |
| Excess Kurtosis | 1.40 |
| Historical Value-at-Risk (5%) | 10.31% |
| Analytical Value-at-Risk (5%) | 10.46% |
| Conditional Value-at-Risk (5%) | 14.48% |
| Upside Capture Ratio (%) | 163.19 |
| Downside Capture Ratio (%) | 127.48 |
| Safe Withdrawal Rate | 15.33% |
| Perpetual Withdrawal Rate | 14.31% |
| Positive Periods | 413 out of 645 (64.03%) |
| Gain/Loss Ratio | 1.07 |
| * The US Stock Market is used as the benchmark for calculations. Value-at-risk metrics are monthly values. | |
Year by year statistics:
Annual Returns
| Year | Inflation | Portfolio 1 Return | Portfolio 1 Balance | US Stock Market | 10-year Treasury | Gold |
|---|---|---|---|---|---|---|
| 2025 | 2.91% | 48.67% | $283,505,282 | 14.25% | 7.03% | 46.81% |
| 2024 | 2.89% | 37.95% | $190,697,749 | 23.61% | -0.96% | 26.66% |
| 2023 | 3.35% | 37.84% | $138,231,858 | 25.87% | 3.64% | 12.69% |
| 2022 | 6.45% | -45.73% | $100,281,271 | -19.60% | -15.19% | -0.77% |
| 2021 | 7.04% | 22.29% | $184,772,166 | 25.59% | -3.33% | -4.15% |
| 2020 | 1.36% | 45.77% | $151,099,171 | 20.87% | 10.01% | 24.81% |
| 2019 | 2.29% | 59.06% | $103,652,572 | 30.65% | 8.03% | 17.86% |
| 2018 | 1.91% | -13.14% | $65,165,531 | -5.26% | 0.99% | -1.94% |
| 2017 | 2.11% | 33.09% | $75,024,988 | 21.05% | 2.39% | 12.81% |
| 2016 | 2.07% | 15.16% | $56,373,188 | 12.53% | 1.00% | 8.03% |
| 2015 | 0.73% | -9.44% | $48,954,165 | 0.29% | 1.12% | -10.67% |
| 2014 | 0.76% | 22.51% | $54,058,048 | 12.43% | 10.63% | -2.19% |
| 2013 | 1.50% | 15.11% | $44,126,010 | 33.35% | -8.57% | -28.33% |
| 2012 | 1.74% | 22.02% | $38,332,959 | 16.25% | 2.73% | 6.60% |
| 2011 | 2.96% | 17.82% | $31,416,125 | 0.96% | 16.24% | 9.57% |
| 2010 | 1.50% | 42.31% | $26,665,169 | 17.09% | 7.92% | 29.27% |
| 2009 | 2.72% | 28.27% | $18,737,002 | 28.70% | -10.17% | 24.03% |
| 2008 | 0.09% | -30.23% | $14,607,861 | -37.04% | 20.53% | 4.92% |
| 2007 | 4.08% | 28.63% | $20,937,073 | 5.49% | 10.42% | 30.45% |
| 2006 | 2.54% | 28.63% | $16,277,023 | 15.51% | 2.19% | 22.55% |
| 2005 | 3.42% | 13.24% | $12,654,452 | 5.98% | 3.01% | 17.76% |
| 2004 | 3.26% | 17.67% | $11,175,047 | 12.52% | 4.50% | 4.65% |
| 2003 | 1.88% | 48.80% | $9,496,673 | 31.35% | 0.15% | 19.89% |
| 2002 | 2.38% | -4.93% | $6,382,296 | -20.96% | 15.45% | 25.57% |
| 2001 | 1.55% | -14.18% | $6,713,442 | -10.97% | 5.40% | 0.75% |
| 2000 | 3.39% | -4.57% | $7,823,103 | -10.57% | 17.28% | -5.44% |
| 1999 | 2.68% | 15.77% | $8,197,511 | 23.81% | -7.83% | 0.85% |
| 1998 | 1.61% | 42.14% | $7,080,976 | 23.26% | 14.64% | -0.83% |
| 1997 | 1.70% | 41.63% | $4,981,775 | 30.99% | 11.97% | -21.41% |
| 1996 | 3.32% | 19.65% | $3,517,440 | 20.96% | -0.00% | -4.59% |
| 1995 | 2.54% | 87.97% | $2,939,815 | 35.79% | 25.55% | 0.98% |
| 1994 | 2.67% | -15.77% | $1,563,994 | -0.17% | -7.19% | -2.17% |
| 1993 | 2.75% | 33.68% | $1,856,904 | 10.62% | 12.97% | 17.68% |
| 1992 | 2.90% | 11.54% | $1,389,104 | 9.11% | 7.23% | -5.73% |
| 1991 | 3.06% | 62.87% | $1,245,380 | 32.39% | 18.91% | -8.56% |
| 1990 | 6.11% | -8.71% | $764,635 | -6.08% | 7.70% | -3.11% |
| 1989 | 4.65% | 57.92% | $837,621 | 28.12% | 17.84% | -2.84% |
| 1988 | 4.42% | 18.36% | $530,395 | 17.32% | 6.90% | -15.26% |
| 1987 | 4.43% | -0.89% | $448,107 | 2.61% | -2.64% | 24.53% |
| 1986 | 1.10% | 49.92% | $452,138 | 14.57% | 21.35% | 18.96% |
| 1985 | 3.80% | 87.06% | $301,592 | 31.27% | 29.85% | 6.00% |
| 1984 | 3.95% | 4.32% | $161,226 | 2.19% | 14.87% | -19.38% |
| 1983 | 3.79% | 18.78% | $154,551 | 22.66% | 2.30% | -16.31% |
| 1982 | 3.83% | 82.28% | $130,113 | 20.50% | 39.57% | 14.94% |
| 1981 | 8.92% | -22.05% | $71,382 | -4.15% | 5.28% | -32.60% |
| 1980 | 12.52% | 37.74% | $91,579 | 33.15% | -1.29% | 15.19% |
| 1979 | 13.29% | 99.32% | $66,484 | 24.25% | 1.83% | 126.55% |
| 1978 | 9.02% | 19.57% | $33,355 | 8.45% | -0.74% | 37.01% |
| 1977 | 6.70% | -0.65% | $27,896 | -3.36% | 0.53% | 22.64% |
| 1976 | 4.86% | 50.05% | $28,077 | 26.47% | 15.29% | -4.10% |
| 1975 | 6.94% | 40.39% | $18,712 | 37.82% | 5.52% | -24.80% |
| 1974 | 12.34% | -12.54% | $13,329 | -27.81% | 4.05% | 66.15% |
| 1973 | 8.71% | 4.05% | $15,240 | -18.18% | 3.29% | 72.96% |
| 1972 | 3.41% | 46.47% | $14,647 | 17.62% | 2.35% | 49.02% |
| Annual return for 2025 is from 01/01/2025 to 09/30/2025 | ||||||