High-Low Logic Index

The High-Low Logic Index is a technical indicator for market breadth. Namely, how do the various components of an index act in relation to each other?
If you’ve ever noticed divergence in the various components of an index while it continues to increase and whether the broader market agrees with what you’re seeing, the High-Low Logic Index was built for exactly this purpose.
Developed by Norman Fosback (also known for the negative volume index) in 1979 and introduced in his foundational book Stock Market Logic, the HLLI is one of the most notable breadth indicators available to technical analysts.
Its goal is to tell you whether the market is moving in a coherent, unified direction or splintering under the surface.
Key Takeaways – High-Low Logic Index
- The High-Low Logic flags when both new highs and new lows are high at the same time.
- This notes a fragile, divided market.
- The High-Low Logic Index reframes breadth analysis.
- Before Fosback, most indicators asked: Are more stocks rising or falling?
- Fosback asked a different question: Are stocks behaving consistently?
- That shift turned breadth analysis into a coherence test for the market rather than just a participation count.
- Modern quant researchers use HLLI as a breadth stress indicator, a risk-off signal, and an input to market regime models.
- Below 1% = healthy, broad participation. Above 5% = warning, something is breaking under the surface.
- A rising index with a rising HLLI means the rally may be dependent on a relatively small group of winners, not real strength.
- It’s lagging/coincident, meaning it confirms what’s already happening/currently happening rather than predicting what’s next.
- It helped flag the 2000 and 2007 tops before the full damage was obvious in headline prices.
- Like all indicators, it works best alongside other indicators, metrics, and forms of analysis. It’s not recommended as a standalone signal.
- We provide code for the High-Low Logic Index for TradingView
Best Brokers With The High-Low Logic Index Indicator
Each of these top-rated brokers supports TradingView, a user-friendly platform with various versions of the High-Low Index indicator:


What the High-Low Logic Index Actually Measures
The High-Low Logic Index is calculated by taking the lesser of two values:
The number of NYSE stocks hitting 52-week highs or the number hitting 52-week lows…
…then dividing that smaller figure by total NYSE issues traded.
The result is expressed as a percentage. It’s typically smoothed with a 10-week exponential moving average to reduce week-to-week noise.
The logic behind this construction is counterintuitive.
In a healthy bull market, you would expect lots of new highs and very few new lows.
In a confirmed bear market, the reverse holds.
But the HLLI gets genuinely interesting in the middle ground, the kind of environment where the index is grinding higher while underneath, many stocks are quietly making new lows.
That disconnect is what the index is designed to expose.
Why Would You Want to Know This?
Basically to know whether a market rally is real or hollow.
If major indices are climbing but the HLLI is rising too, it means under the surface there’s less agreement, with winners and losers multiplying at the same time.
That split reveals a market that’s more fragile, not genuine “rising tide lifts all boats” broad participation.
Why the Minimum Value Is the Idea
Using the lesser of highs or lows, rather than a simple ratio between them, is what makes this indicator structurally unique.
A high reading on the HLLI means something troubling is happening: a large portion of stocks is hitting 52-week highs while another large portion is hitting 52-week lows at the same time.
That kind of bifurcation doesn’t happen in genuinely strong markets because it shows internal inconsistency. It happens when market leadership is narrow, speculative, or unsustainable.
Fosback’s original research found that readings below 1% were historically consistent with bullish market conditions, while readings above 5% were associated with bear market environments.
Indicator Reading
Interpretation
Historical Observation
< 1%
Strong market consensus
Usually bullish conditions. Broad participation across the market.
1-5%
Neutral or mixed breadth
Normal market environment where leadership and laggards coexist without major internal stress.
≥ 5%
Severe market divergence
Rare conditions historically associated with fragile markets and elevated downside risk.
These thresholds have held up reasonably well across decades and market cycles.
At the same time, most modern practitioners treat them as guidelines rather than something that would unilaterally make trading decisions.
Reading the Signal – What Each Zone Tells You
Low Readings = The Market in Unison
When the HLLI sits in low territory, it means that few stocks are making new lows while many may be making new highs.
Low readings are normal.
The market isn’t divided. Participation is broad, and there’s genuine underlying conviction in the direction of price.
For long-term trend followers, this is the environment you want to be operating in.
Low HLLI readings historically precede continued market strength more often than not, and they give you confidence that what you see in an index isn’t just a handful of megacap stocks dragging the average higher.
High Readings = The Market Is Arguing With Itself
A high HLLI reading is a warning flag.
When both new highs and new lows are elevated at the same time, the market is internally incoherent.
Some sectors or stocks are thriving while others are falling.
This kind of breadth has historically preceded some major market tops, because it reflects a market where momentum is concentrated in a shrinking group of winners propping up broader averages.
The 2000 dot-com peak was an example as “new economy” internet stocks were in while “old economy” stocks were out of favor.
The 2007 pre-crisis environment both saw elevated HLLI readings as early warning signs.
In both cases, the headline indices – as averages – were still performing reasonably well even as the breadth data was waving a red flag.
Traders who paid attention to that divergence are more likely to reexamine their positioning.
Visualizing the High-Low Logic Index
Let’s look at the HLLI on the S&P 500:
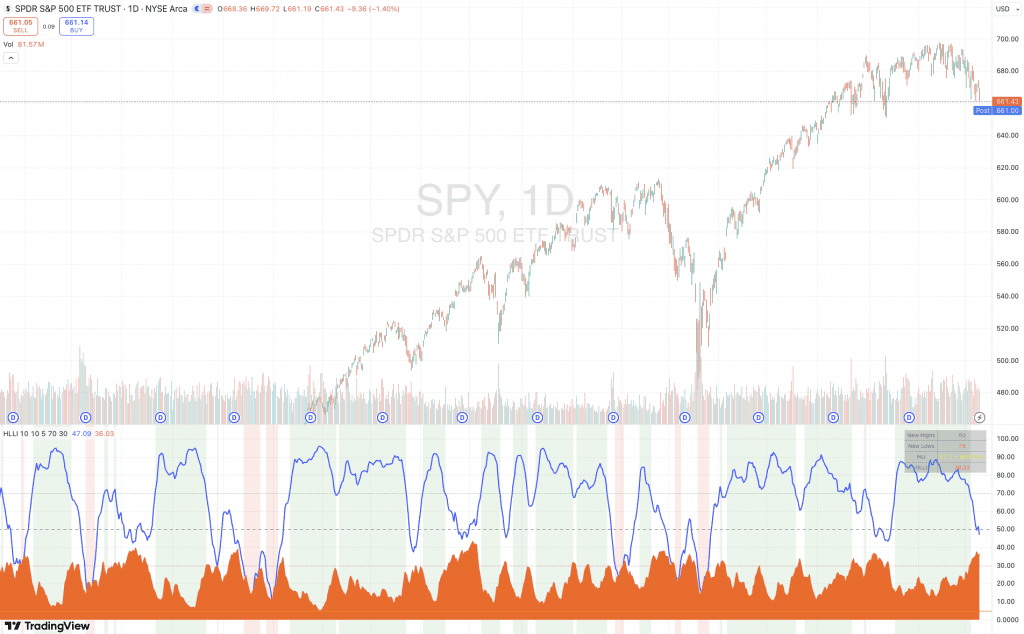
(High-Low Logic Index on TradingView)
The HLLI susses out price and breadth disconnect. When the S&P holds an uptrend while the HLLI stays high, that’s a classic sign of narrow leadership.
When you see repeated elevated zones on the HLLI, that suggests the market is going from broad participation to selective, concentrated winners carrying the index higher.
It’s a sign of fragility, not timing.
A high HLLI doesn’t mean immediate downside, just increased vulnerability.
Clusters matter. Like we mentioned with the Hindenburg Omen, if you see multiple elevated readings in close succession strengthen the validity of the signal. It’s more consistent with topping processes.
A recent downturn + rising HLLI = risk confirmation
If prices begin to roll over while the HLLI stays high, that adds more confirmation to the signal.
Low HLLI periods earlier = healthy trend phases
Earlier green zones note strong, sustainable advances driven by broad participation
Big picture
When the market shifts from green, to clear, to red, that’s meant to tell you that the market has shifted from “everything working” -> “few things working” and, in turn, and that tends to foreshadow weaker forward returns
How to Add the High-Low Logic Index to Your Charts
The HLLI doesn’t come natively on most (close to all) charting software.
On TradingView, though, you can custom code the indicator onto your charts.
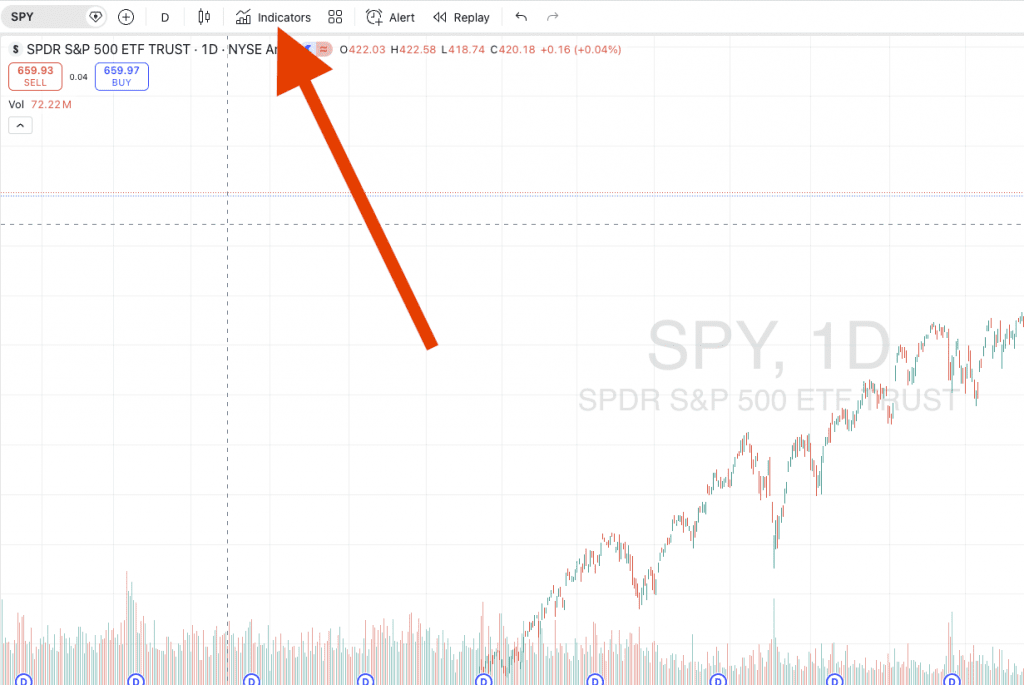
Step 1
Go to Indicators at the top.
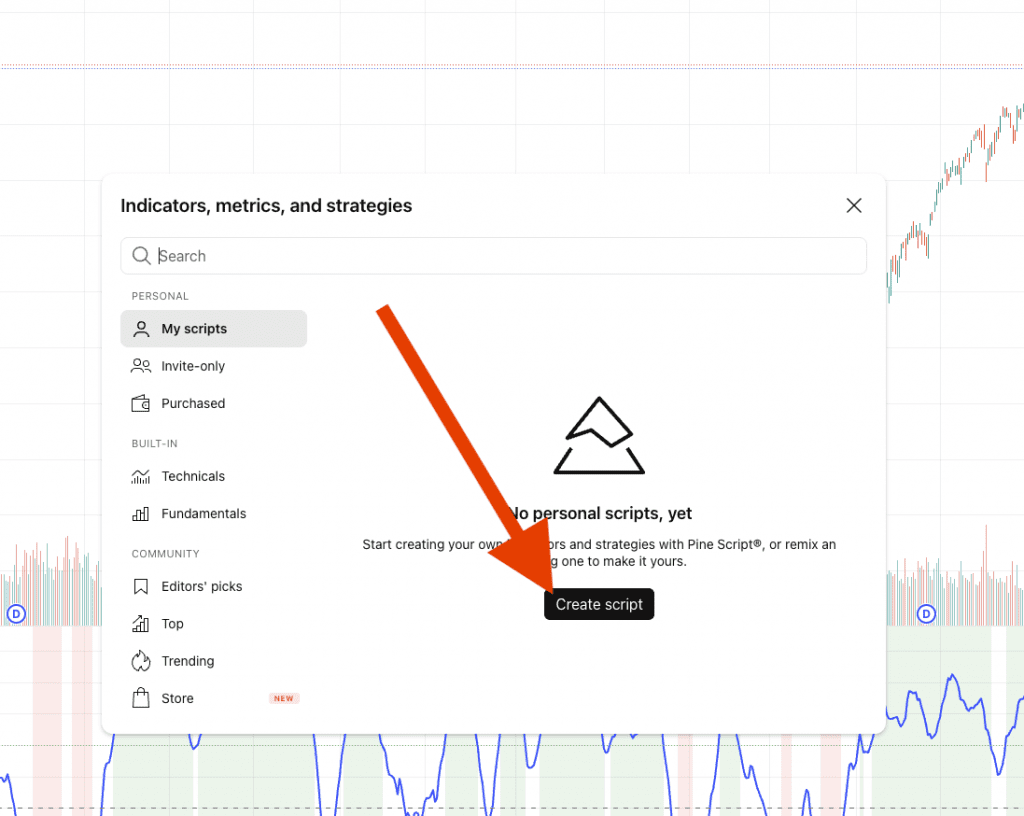
Step 2
Click on Create Script.
Step 3
Then copy-paste in the code.
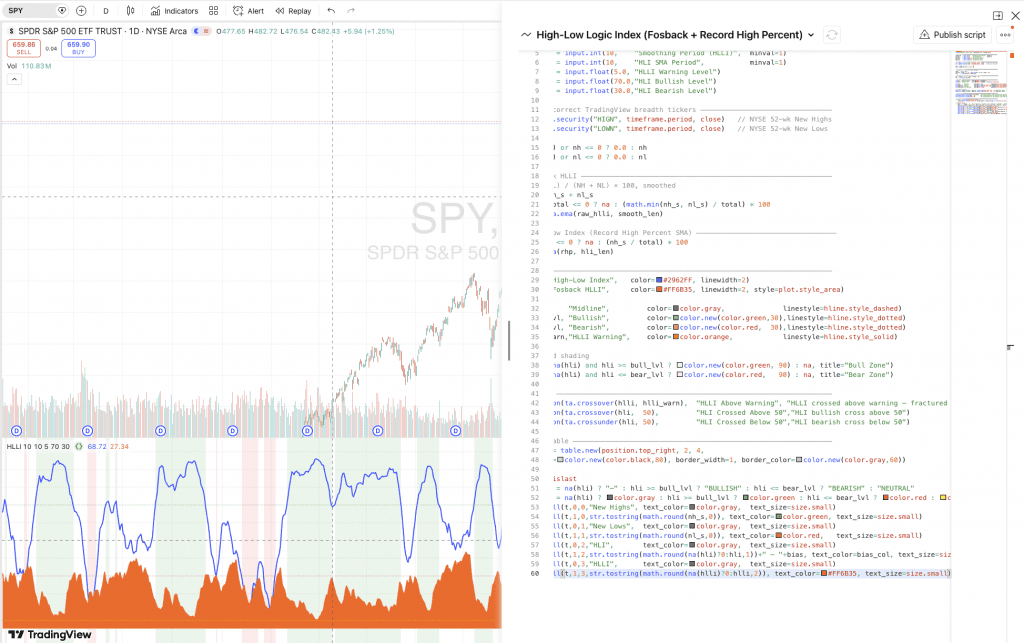
Then it should show up on the chart.
High-Low Logic Index Code
We have the code to copy-paste below. This works for TradingView Pine Script only.
//@version=5

indicator("High-Low Logic Index", shorttitle="HLLI", overlay=false)

// ── Inputs ──────────────────────────────────────────────────────────────────

smooth_len = input.int(10, "Smoothing Period (HLLI)", minval=1)
hli_len = input.int(10, "HLI SMA Period", minval=1)
hlli_warn = input.float(5.0, "HLLI Warning Level")
bull_lvl = input.float(70.0,"HLI Bullish Level")
bear_lvl = input.float(30.0,"HLI Bearish Level")

// ── Data: correct TradingView breadth tickers ────────────────────────────────

nh = request.security("HIGN", timeframe.period, close) // NYSE 52-wk New Highs
nl = request.security("LOWN", timeframe.period, close) // NYSE 52-wk New Lows
nh_s = na(nh) or nh <= 0 ? 0.0 : nh
nl_s = na(nl) or nl <= 0 ? 0.0 : nl

// ── Fosback HLLI ─────────────────────────────────────────────────────────────

// min(NH, NL) / (NH + NL) × 100, smoothed

total = nh_s + nl_s
raw_hlli = total <= 0 ? na : (math.min(nh_s, nl_s) / total) * 100
hlli = ta.ema(raw_hlli, smooth_len)

// ── High-Low Index (Record High Percent SMA) ──────────────────────────────────

rhp = total <= 0 ? na : (nh_s / total) * 100
hli = ta.sma(rhp, hli_len)

// ── Plots ────────────────────────────────────────────────────────────────────

plot(hli, "High-Low Index", color=#2962FF, linewidth=2)
plot(hlli, "Fosback HLLI", color=#FF6B35, linewidth=2, style=plot.style_area)
hline(50, "Midline", color=color.gray, linestyle=hline.style_dashed)
hline(bull_lvl, "Bullish", color=color.new(color.green,30),linestyle=hline.style_dotted)
hline(bear_lvl, "Bearish", color=color.new(color.red, 30),linestyle=hline.style_dotted)
hline(hlli_warn,"HLLI Warning", color=color.orange, linestyle=hline.style_solid)

// Background shading

bgcolor(not na(hli) and hli >= bull_lvl ? color.new(color.green, 90) : na, title="Bull Zone")
bgcolor(not na(hli) and hli <= bear_lvl ? color.new(color.red, 90) : na, title="Bear Zone")

// ── Alerts ───────────────────────────────────────────────────────────────────

alertcondition(ta.crossover(hlli, hlli_warn), "HLLI Above Warning", "HLLI crossed above warning — fractured breadth")
alertcondition(ta.crossover(hli, 50), "HLI Crossed Above 50","HLI bullish cross above 50")
alertcondition(ta.crossunder(hli, 50), "HLI Crossed Below 50","HLI bearish cross below 50")

// ── Info table ───────────────────────────────────────────────────────────────
var table t = table.new(position.top_right, 2, 4,
bgcolor=color.new(color.black,80),border_width=1,border_color=color.new(color.gray,60))
if barstate.islast
bias=na(hli)?"—":hli>=bull_lvl?"BULLISH":hli<=bear_lvl?"BEARISH":"NEUTRAL"
bias_col=na(hli)?color.gray:hli>=bull_lvl?color.green:hli<=bear_lvl?color.red:color.yellow
table.cell(t,0,0,"New Highs",text_color=color.gray,text_size=size.small)
table.cell(t,1,0,str.tostring(math.round(nh_s,0)),text_color=color.green,text_size=size.small)
table.cell(t,0,1,"New Lows",text_color=color.gray,text_size=size.small)
table.cell(t,1,1,str.tostring(math.round(nl_s,0)),text_color=color.red,text_size=size.small)
table.cell(t,0,2,"HLI",text_color=color.gray,text_size=size.small)
table.cell(t,1,2,str.tostring(math.round(na(hli)?0:hli,1))+" — "+bias,text_color=bias_col,text_size=size.small)
table.cell(t,0,3,"HLLI",text_color=color.gray,text_size=size.small)
table.cell(t,1,3,str.tostring(math.round(na(hlli)?0:hlli,2)),text_color=#FF6B35,text_size=size.small)
How to Add HLLI Into Your Analysis
Pairing With Price Trend Indicators
The HLLI works best as a confirmation or disconfirmation indicator.
It can be layered alongside price-based indicators and other analytical measures rather than as a standalone timing mechanism.
When the index’s price trend is rising and the HLLI is low, you have both momentum and breadth alignment.
This is a combination that many technical analysts believe increases the reliability of bullish setups.
When price is rising but the HLLI is climbing toward elevated territory, that divergence can be worth looking into as a risk-off measure.
Combining With the Advance-Decline Line
The Advance-Decline line measures the cumulative difference between advancing and declining stocks each day.
This makes it a natural companion to the HLLI.
The A-D line tells you about the direction of breadth, while the HLLI tells you about the extremity of breadth.
If you use them together, you can get a more complete picture.
The A-D line can confirm that more stocks are participating in a move, while the HLLI confirms that the market isn’t simultaneously generating an unusual number of catastrophic losers at the opposite extreme.
Timeframe and Smoothing Considerations
Fosback’s original formulation of the indicator used weekly data with a 10-week exponential moving average. This remains the standard approach for long-term market analysis.
For day traders, daily data with shorter smoothing periods is possible and can generate earlier signals. But it may also produce more false positives in choppier or range-bound markets.
For traders with a multi-week to multi-month time horizon, sticking close to the original weekly construction may give you the cleanest and most historically validated signal.
Limitations of the High-Low Logic Index Worth Knowing
No breadth indicator is infallible. The HLLI has its own set of caveats that honest practitioners acknowledge openly.
Based on NYSE-listed Issues
First, the index is based on NYSE-listed issues. This means changes in the composition of the exchange will happen over time – including the growing proportion of exchange-traded products and closed-end funds.
This can affect readings in ways that don’t purely have to do with equity market breadth.
Some analysts now calculate HLLI variants using common stocks only to address this.
Lagging/Coincident Rather than Leading
The index is a lagging-to-coincident indicator rather than a leading one.
It confirms what’s already happening beneath the market surface rather than predicting it weeks in advance.
Used with that expectation clearly in mind, it can have value for risk calibration. Used as a crystal ball or holy grail, it will disappoint.
Most Useful During Trending Markets
And like all breadth measures, the HLLI is most useful during trending markets.
In persistently low-vol, range-bound environments, readings can stay compressed for a long time without giving off much directional information.
Recognizing the market environment you’re operating can better contextualize any technical indicator you’re using, and the High-Low Logic Index is no exception.
| Topic | Key Idea | Why It Matters for Traders |
|---|---|---|
| High-Low Logic Index (HLLI) | A market breadth indicator developed by Norman Fosback in 1979. Looks at whether stocks are moving together or diverging internally. | Helps determine whether an index move reflects broad participation or narrow leadership. |
| Core Calculation | Uses the smaller of the number of NYSE stocks hitting 52-week highs or 52-week lows, then divided by total NYSE issues traded. | Captures situations where both highs and lows are elevated. Reveals internal market conflict. |
| Smoothing Method | Typically calculated weekly and smoothed with a 10-week exponential moving average. Can be done daily for day traders. | But longer timeframes are still believed to reduce noise and produce a clearer signal for multi-week to multi-month analysis. |
| Structural Logic | Uses the minimum of highs or lows rather than a ratio between them. | Highlights bifurcation, when parts of the market surge while others fall simultaneously. |
| Bullish Threshold | Readings below about 1%. | Suggest broad participation and internal agreement in the market’s direction. |
| Bearish Warning Zone | Readings above about 5%. | Signals serious breadth deterioration and historically appears near major market tops. |
| Low HLLI Environment | Few stocks making new lows + strong participation in new highs. | Indicates a healthy bull market. Index strength reflects the broader market. |
| High HLLI Environment | Many stocks hitting both new highs and new lows at the same time. | Shows internal market conflict and narrowing leadership. Often precedes major corrections. |
| Historical Examples | Elevated readings appeared before the 2000 dot-com peak and the 2007 financial crisis. | Examples of how breadth divergence can warn of fragile market environments. |
| Best Practical Use | Works best alongside price trend indicators rather than as a standalone signal. | Confirms whether price trends are supported by broad participation. |
| Combination Indicator | Often paired with the Advance-Decline line. | A-D line shows direction of participation. HLLI shows the extremity of market divergence. |
| Standard Timeframe | Weekly data with 10-week EMA smoothing is the traditional method. | Produces the most reliable signal. Aligns with Fosback’s original research. |
| Data Composition Issue | NYSE now includes ETFs and closed-end funds, which can distort readings. | Some analysts calculate HLLI using common stocks only for cleaner breadth signals. |
| Indicator Type | Lagging to coincident indicator rather than leading. | Confirms internal market conditions. Not reliable for predicting future moves. |
| Market Regime Sensitivity | Most informative during trending markets. | In sideways or low-volatility markets, readings may stay low without providing clear signals. |
| Primary Practical Value | Acts as a breadth “stress detector” for the market. | Helps traders tighten risk management when the stock market deteriorates under the hood. |
How Later Analysts Extended His Work
Several later concepts derive directly from Fosback’s idea.
Hindenburg Omen
The Hindenburg Omen uses similar conditions:
- large numbers of both highs and lows
- rising market index
- negative momentum confirmation
The idea here with “the Omen” is heavily built on Fosback’s HLLI framework.
Breadth Divergence Models
Modern quant researchers use the HLLI as a breadth stress indicator, a risk-off signal, and an input to market regime classification models. We wrote about such matters in more detail here.
When the HLLI spikes, systematic strategies often reduce equity exposure automatically.
They treat elevated readings as a statistical sign that the market’s internal structure is – or at least may be – breaking down.
This is similar to how 50-MA/200-MA crossovers still have an influence in modern markets. They’re directly built into some quant models.
FAQs – High-Low Logic Index
Why is a rising HLLI bad? What if it just means new sectors are winning and old ones are losing?
In my mind, this is the most legitimate pushback you can make against the indicator.
The answer is that the HLLI doesn’t know why the divergence is happening; it only knows that it’s happening.
Like all technical indicators, be sure to ask the why. This is where fundamental analysis, macro factors, and other lines of analysis come in.
Historically, the pattern of simultaneous widespread highs and lows has resolved badly more often than it has resolved as a clean sector rotation.
For example, tech companies creating new technologies that create new wealth, while old economy businesses like fax machine producers, xerox copiers, “buggy whip businesses,” etc., get replaced and fall.
True sector rotation tends to be sequential, money leaves one area and visibly rotates into another, keeping the overall number of new lows contained.
What the HLLI intends to flag is when the scale of the losers is too large to be explained by normal rotation alone.
In 2000, in terms of what was discounted into markets, new economy was in and old economy was out, but the sheer number of stocks hitting new lows was far beyond what a healthy handoff between sectors should produce.
That excess is the signal.
Moreover, if you go outside the technical signal and look at what was happening back then – e.g., lots of profitless, weak revenue businesses trading at extremely high values – it made the bubble precarious.
What’s the difference between the HLLI and the Advance-Decline line? Why do I need both?
The A-D line counts how many stocks are advancing versus declining each day. It accumulates that over time. It tells you about direction and participation.
The HLLI tells you about extremity – i.e., specifically whether the market is producing an abnormal number of simultaneous winners and losers at the 52-week level.
Each catches different problems.
A falling A-D line tells you participation is narrowing.
A rising HLLI tells you the dispersion between the best and worst performers is becoming structurally abnormal.
A market can have a flat A-D line and a low HLLI and be fine.
It can also have a rising A-D line and a climbing HLLI, which is a more subtle and dangerous condition that the A-D line alone would miss entirely.
How do I actually use the 1% and 5% thresholds in practice?
They’re not meant to be interpreted as triggers. You’re not meant to sell everything at 5%.
Think of them the way you think of overbought RSI readings – they’re useful context, not commands.
Practitioners might use them to adjust conviction and position sizing rather than to make binary decisions.
How does the HLLI relate to the Hindenburg Omen, and is the Omen just a souped-up version of it?
Essentially yes.
The Hindenburg Omen was developed by Jim Miekka and takes Fosback’s core insight – that concurrent new highs and new lows signal internal market stress, and layers on additional confirmation filters.
To trigger, the Omen requires that:
- both new highs and new lows each exceed 2.2% of NYSE issues on the same day,
- that the NYSE Composite is in an uptrend, and
- that the McClellan Oscillator is negative on the same day
The extra conditions were added to reduce false positives, which the raw HLLI can generate in sideways markets.
The Omen, while not that popular on its own, still gets more press when it triggers because it has a dramatic name and a specific trigger event.
But conceptually it’s downstream of Fosback.
The HLLI is the foundation; the Omen is one specific application built on top of it.