Hindenburg Omen

The Hindenburg Omen is a technical analysis indicator that’s designed to look for a major crash in markets.
Named after the catastrophic 1937 airship disaster, the Hindenburg Omen purports that something structurally unstable may be happening beneath the market’s surface.
The logic is that in a healthy bull market, most stocks should be trending in the same direction.
When a disproportionate number of stocks simultaneously hit 52-week highs and 52-week lows, the idea is that the market is fracturing internally.
The Hindenburg Omen is designed to catch exactly that kind of hidden divergence.
Key Takeaways – Hindenburg Omen
- The Hindenburg Omen is a stock market warning signal. The goal is to detect crashes before they happen.
- It triggers when a large number of stocks are simultaneously hitting both 52-week highs and lows.
- The logic is that the market is deteriorating underneath, but looks okay as it’s masked by the averages.
- All four conditions have to trigger on the same day:
- the high-low split exceeds 2.2%
- the 50-day moving average is still rising
- the McClellan Oscillator is negative, and
- new highs don’t outnumber new lows by more than 2:1
- It’s not reliable on its own. Only about 25% of signals preceded a real decline of 5%+.
- Serious traders might use it as a yellow flag, not a sell or short-sell button.
- What’s prudent would be to stack it alongside other warning signs before acting.
Best Brokers With The Hindenburg Omen Indicator
These brokers performed best in our hands-on tests of their platforms, and crucially they offer TradingView, which has Hindenburg Omen indicator through community-scripted indicators:


The 4 Conditions That Trigger the Hindenburg Omen
The Hindenburg Omen requires all of the following criteria to be met on the same trading day:
1) The High-Low Split
Both new 52-week highs and new 52-week lows must each exceed 2.2% of total issues traded.
This threshold is structured to increase the probability that the divergence is real and significant, not just noise.
2) The 50-Day Moving Average Must Be Rising
This condition confirms that the market’s broader trend is still technically positive.
So, in this case, things look fine on the surface while there’s fragility underneath.
It’s not a predicting a fall in an already falling market.
3) The McClellan Oscillator Is Negative
This McClellan Oscillator is a market breadth indicator. It measures advancing versus declining issues.
A negative reading here signals deteriorating internal momentum.
This adds a second layer of confirmation that the market is weakening from within.
4) New Highs Cannot Outnumber New Lows by More Than 2:1
If new highs vastly exceed new lows, the internal divergence is considered not severe enough to qualify.
The Omen requires near-parity to flag genuine market confusion.
When All Four Align…
When all four align, a confirmed signal is generated.
Technicians typically look for two or more signals within a 36-day window to take the Omen seriously, since a single day can sometimes be statistical noise.
Why 36 days?
The 36-day window doesn’t come from the Omen’s own logic. It’s simply an empirically adopted convention among some technical analysts.
Some use 30 days instead based on the observed pattern that market deterioration tends to either accelerate or resolve within roughly that timeframe.
It gives enough time such that repeated signals within are more likely to be indicative of stress rather than just a fleeting data quirk.
If you use a lower number of days (e.g., 25), then it’s less likely to trigger a signal, but when it does, it may be interpteted to have more weight given the two occurrences are clustered tightly together.
Condition
What It Measures
Threshold
High-Low Split
Both new 52-week highs AND lows as % of total issues traded
Each must exceed 2.2%
50-Day Moving Average
Direction of the market’s broader trend
Must be rising
McClellan Oscillator
Advancing vs. declining issues (internal momentum)
Must be negative
High/Low Ratio
Whether highs and lows are roughly balanced
Highs cannot outnumber lows by more than 2:1
Confirmation Window
How many signals are required, and within what timeframe
2+ signals within 36 days (or similar time period of your choice)
Its Historical Track Record
So is it actually any good?
The Hindenburg Omen has a complicated relationship with accuracy.
On one hand, it has appeared before most major stock market crashes of the past four decades, including the crashes of 1987, 2000, and 2008.
So, there’s that. But if there are too many false positives, then it’s not reliable.
On the other hand, the vast majority of confirmed signals have not been followed by catastrophic drops.
That’s why many professional traders treat it as one input among many rather than an infallible oracle – like practically all technical indicators.
Research suggests that roughly 25% of confirmed Hindenburg Omen signals have preceded meaningful market declines of 5% or more.
About 10% have preceded crashes that exceeded 15%.
Those numbers sound modest until you consider the downside of being wrong: ignoring a genuine warning and riding a portfolio into freefall.
Related: Strategies hedge funds use
Visualizing the Hindenburg Omen
Let’s look at the chart of the S&P 500 below with the Hindenburg Omen plotted:
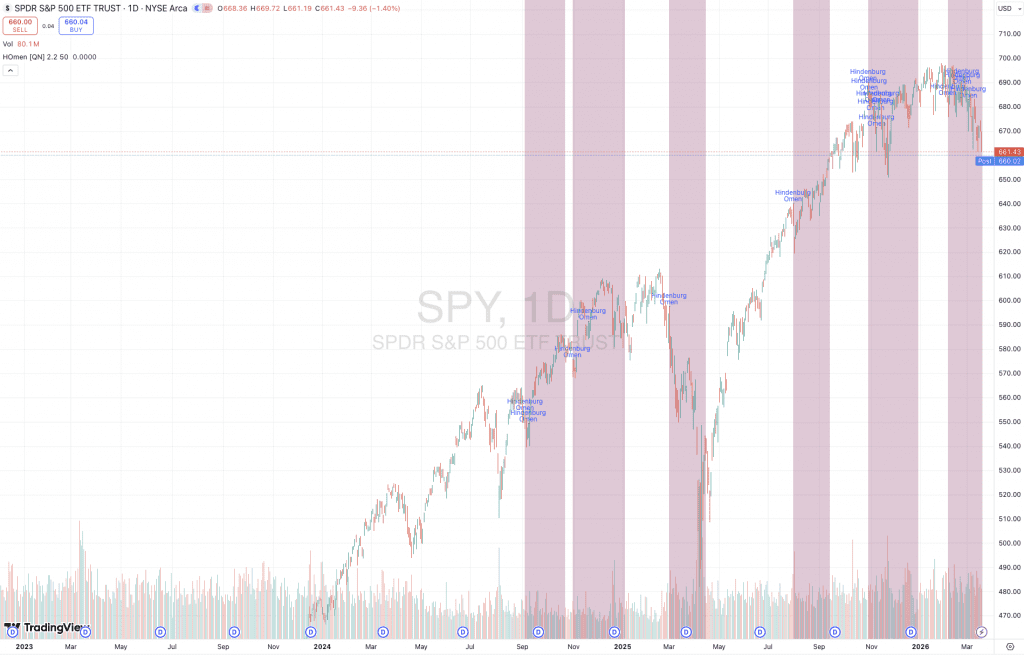
So we can see from this that signals tend to cluster around ongoing upward trends.
Multiple omens appears without immediate drawdowns. This shows its relatively high false-positive rate.
We can see some clusters that precede pullbacks. But there’s a lot of lag and dispersion – weeks to months.
In this sense, you might think of it as more of a “risk regime shift” indicator. Not so much as a trigger for shorts.
Reliability can improve a bit when signals appears in clusters rather than isolated points.
For technical analysis considerations, to improve its reliability, you might want to pair with momentum breakdowns. For trend-following strategies, they may want to pair with price deterioration signals.
The best interpretation, in our view, is that it’s a warning of internal fragility, and it’s just one metric and method of analysis among many. Using it as imminent crash timing is not suitable on its own.
Why the Omen Works Conceptually
The Hindenburg Omen is grounded in market breadth theory.
The idea behind market breadth is that sustainable rallies require broad participation – not just a handful of stocks carrying it upward.
When a narrow group of large-cap stocks continues rising while other names hit new lows, the rally is fragile and potentially deceptive.
Index-level returns can look perfectly fine while underlying market health is deteriorating.
This kind of internal divergence often appears in the late stages of a bull market.
These types of markets are generally characterized by:
- At or above potential GDP
- Unemployment is low
- Inflation is above target
- High expectations are discounted into the forward pricing
Policymakers are no longer stimulative and market pricing sets up for disappointment.
When traders are becoming increasingly selective, this often shows up as piling into perceived safe havens while quietly abandoning riskier positions.
At the same time, it can sometimes be the opposite – i.e., quality is ignored while risker positions become en vogue.
Flaws of the Hindenburg Omen
The Hindenburg Omen has genuine conceptual logic behind it.
At the same time, its practical track record exposes some weaknesses worth understanding.
False Positive Rate
The false positive rate is the biggest problem.
Nobody wants an incessant doom predictor.
The vast majority of confirmed signals haven’t preceded meaningful crashes.
So the Hindenburg Omen cries wolf far more often than it delivers.
If you acted defensively on every signal, you would have missed upside repeatedly over the past few decades.
Also, if you take it at face value, then when do you get back in?
Designed for NYSE Data
It was also designed specifically for NYSE data.
How broadly does it apply?
So it can behave inconsistently when applied to other exchanges or broader indexes like the S&P 500.
Market structure has also changed since the indicator was developed.
Now we have passive investing, ETFs, sophisticated market making, and algorithmic trading all influencing the new highs/lows data.
Arbitrary Metrics
The 2.2% threshold and 36-day window are also somewhat arbitrary.
They were derived empirically rather than from any type of internal logcal. This means small changes to either parameter can change how often the signal fires.
Timing or Magnitude?
Finally, the Omen tells you nothing about timing or magnitude.
Even if/when it’s right, a crash could follow in two weeks or eight months – and for reasons that had nothing to do with the logical of the indicator.
And it could mean a 6% pullback or a 40% collapse.
And like we just mentioned, how do you know when to get back in?
That’s a lot of ambiguity to act on.
How Serious Traders Use It
Sophisticated traders don’t use any given thing alone, but use it as a yellow flag.
If it’s part of what they track, the Omen appears alongside other warning signs, such as:
- rising credit spreads
- deteriorating earnings breadth, or
- an inverting yield curve
If it appears alongside those, the composite picture becomes more concerning.
Portfolio managers might use a confirmed signal as a cue to review position sizes, market delta (i.e., how correlated to the broader market they are), tighten stop-losses, increase hedges through options, stress-test their allocations against a hypothetical X% decline, and so on.
Conclusion
The Hindenburg Omen, like any indicator or statistic, isn’t a crystal ball or holy grail.
Treating it as one will lead you astray. But we shouldn’t dismiss something if there’s quality logic behind it.
Of course, there are other ways of doing something. The indicator can be modified in various ways – e.g., different thresholds, adding/subtracting indicators/metrics, and so on.
Ultimately, it’s a disciplined, quantitative way of asking a very important question: is this rally actually as healthy as it looks?