Trading Corporate Bonds


Key Takeaways – Corporate Bonds
- Corporate bonds are generally unsuitable for pure day trading
- They lack the volatility and fast-paced price changes that day traders rely upon to turn quick profits.
- Corporate bond ETFs like VTC serve a different purpose for longer-term traders/investors
- They provide portfolio diversification, steady income, and some stability within a balanced portfolio comprised of various asset classes.
- Successful swing and position traders (and especially investors) often trade within a certain structure to the portfolio to balance return and risk more efficiently, which can be informative to day traders.
- Day traders often focus on assets with higher volatility
- Stocks, options, futures, or even cryptocurrencies tend to offer better opportunities for day trading strategies due to their ability to experience rapid price swings in a short period.
Corporate bonds are not typically used for day trading purposes for several reasons:
- Lower liquidity compared to stocks
- Wider bid-ask spreads
- Less frequent pricing updates
- Higher transaction costs
- Lower volatility (day traders need movement)
- Longer time horizons (typically investment vehicles)
- Fundamentally-driven trading instruments (and credit risk assessments require in-depth analysis)
However, for swing traders, position traders, and investors, corporate bonds may become more common as the concept of portfolios and strategic allocation progressively become more important.
For those wanting broad exposure or something that can be used as more of a trading vehicle, this is where corporate bond ETFs come into play.
VTC (Vanguard Total Corporate Bond ETF) is a popular example.
In this article, we cover:
- Characteristics of VTC and portfolio considerations.
- How much should we allocate to corporate bonds (or mid-duration, investment-grade corporate bonds in general) in a balanced beta portfolio?
- We look at an example allocation that manages risk while targeting growth through a blend of asset types and geographical diversification, and how VTC fits in for its unique benefits within a balanced investment strategy.
VTC can be used in a balanced portfolio due to its moderate all-around characteristics.
On the spectrums from short-duration to long-duration and safe bonds to risky bonds, it’s right in the middle of both.
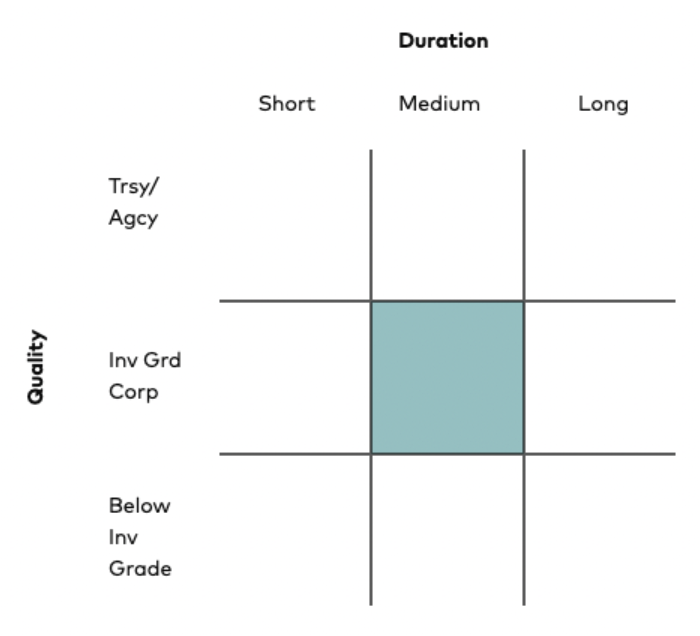
This ETF tries to mirror the performance of the Bloomberg US Corporate Bond Index (a broad spectrum of investment-grade US corporate bonds).
Its strategy of passive indexing gives it exposure to a wide range of corporate sectors, which essentially eliminates specific company risks while providing a steady income stream and portfolio stability.
Its expense ratio is 0.04%.
Benefits of Including Corporate Bonds in a Balanced Portfolio
- Diversification – Corporate bond ETFs can improve portfolio diversification by spreading risk across numerous corporations and industries. If we look at correlations focusing on the daily timeframe, VTC and SPY (S&P 500 ETF) have a +0.31 correlation (where +1 is a perfect positive correlation and -1 is a perfect negative correlation):
Asset Correlations
| Name | Ticker | SPY | VTC | Annualized Return | Daily Standard Deviation | Monthly Standard Deviation | Annualized Standard Deviation |
|---|---|---|---|---|---|---|---|
| SPDR S&P 500 ETF Trust | SPY | 1.00 | 0.31 | 13.47% | 1.25% | 5.06% | 17.51% |
| Vanguard Total Corporate Bond ETF | VTC | 0.31 | 1.00 | 1.53% | 0.52% | 2.33% | 8.08% |
- Income Potential – They offer a consistent source of income through interest payments from corporate bonds. For corporate bonds, the yield varies, but generally a mid-duration, investment-grade bond ETF should yield 0-2% above cash rates (sometimes the risk premium can be negative if interest rates are expected to fall).
- Stability – Bonds generally exhibit less volatility than stocks (lower duration and their returns are more predictable) and don’t have any inherent correlation with equities. This can have a stabilizing effect on the portfolio.
- Cost-Effectiveness – With a low expense ratio, ETFs like VTC provides efficient exposure to the corporate bond market to preserve returns over time.
Corporate Bonds’ Role in Risk Management & Portfolio Growth
A balanced portfolio typically includes both equities and bonds. Corporate bonds can contribute to such a portfolio by:
- Cushioning Volatility – During stock market downturns, the relative stability can help dampen portfolio losses. Having assets with different environmental sensitivities can provide the benefit of seeing others kick in while others experience losses.
- Income – The interest payments can be beneficial for those seeking reliable income, such as retirees.
- Supporting Growth – Besides offering income, the potential appreciation of bond prices can aid in gradual portfolio growth. (If the dividend yield of a corporate bond ETF is below the yield to maturity, this could be a realistic expectation.)
Considerations
Consider:
- Interest Rate Risk – Rising interest rates can decrease the value of existing bonds. ETFs like VTC have a moderation effective duration, but rising rates can still hit their value.
- Credit Risk – Though investment-grade bonds have a lower risk of default, the possibility still exists and should be acknowledged.
Example Portfolio Allocation
This example allocation includes a diversified mix aimed at balancing risk and potential returns, and how corporate bonds (VTC) might be structured within it:
- TIPS (Treasury Inflation-Protected Securities): 25%
- VTI (Vanguard Total Stock Market ETF): 25%
- GSG or AIGCI (Commodity Indexes): 5%
- GLD or IAU (Gold): 15%
- EMLC (Emerging Markets Local Currency Bond ETF): 5%
- VWOB (Vanguard Emerging Markets Government Bond ETF): 5%
- VWO (Vanguard FTSE Emerging Markets ETF): 5%
- VTC (Vanguard Total Corporate Bond ETF): 7.5%
- BND (Vanguard Total Bond Market ETF): 7.5%
How did we design this?
We want to have balance between high growth, low growth, high inflation, and low inflation environments.
This is the basic foundation of a balanced beta portfolio.
Our stocks, commodities, and emerging market exposure give us our “high growth” exposure.
Our bonds and gold give us some “low growth” exposure.
The adjustable principal aspect of TIPS and our commodity (and, to some extent, emerging markets) exposure gives us “high inflation” protection.
Our bonds give us some protection against “low inflation” and our stocks will usually do well in this environment as well – as long as growth is decent relative to discounted expectations.
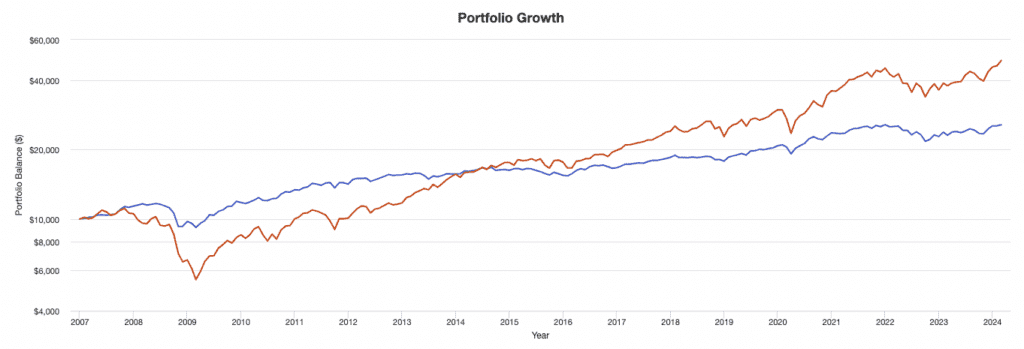
Performance Backtesting
We can study this portfolio’s performance back to 2007 and see the following statistics:
| Portfolio | Initial Balance | Final Balance | CAGR | Stdev | Best Year | Worst Year | Max. Drawdown | Sharpe Ratio | Sortino Ratio | Market Correlation |
|---|---|---|---|---|---|---|---|---|---|---|
| Balanced | $10,000 | $25,657 | 5.64% | 8.22% | 20.82% | -14.15% | -21.24% | 0.57 | 0.84 | 0.80 |
| S&P 500 | $10,000 | $48,755 | 9.67% | 16.35% | 33.35% | -37.04% | -50.89% | 0.58 | 0.85 | 1.00 |
We see a portfolio with about half the volatility with 59% of the returns of the S&P 500 (a risk-reward improvement) and other benefits like a lower maximum drawdown and lower left-tail risk.
The balanced portfolio can be engineered to return the same with less risk or higher returns with the same risk, but that’s a separate topic.
Portfolio Growth
(Please note that Portfolio 1 (blue line) is the balanced allocation while Portfolio 2 (red line) is the S&P 500.)
Summary Statistics
| Metric | Portfolio 1 | Portfolio 2 |
|---|---|---|
| Arithmetic Mean (monthly) | 0.49% | 0.88% |
| Arithmetic Mean (annualized) | 6.00% | 11.14% |
| Geometric Mean (monthly) | 0.46% | 0.77% |
| Geometric Mean (annualized) | 5.64% | 9.67% |
| Standard Deviation (monthly) | 2.37% | 4.72% |
| Standard Deviation (annualized) | 8.22% | 16.35% |
| Downside Deviation (monthly) | 1.57% | 3.17% |
| Maximum Drawdown | -21.24% | -50.89% |
| Stock Market Correlation | 0.80 | 1.00 |
| Beta(*) | 0.40 | 1.00 |
| Alpha (annualized) | 1.55% | 0.00% |
| R2 | 64.70% | 100.00% |
| Sharpe Ratio | 0.57 | 0.58 |
| Sortino Ratio | 0.84 | 0.85 |
| Treynor Ratio (%) | 11.57 | 9.45 |
| Calmar Ratio | 0.19 | 0.39 |
| Active Return | -4.03% | 0.00% |
| Tracking Error | 10.90% | 0.00% |
| Information Ratio | -0.37 | N/A |
| Skewness | -0.93 | -0.57 |
| Excess Kurtosis | 4.18 | 1.13 |
| Historical Value-at-Risk (5%) | 3.07% | 8.13% |
| Analytical Value-at-Risk (5%) | 3.42% | 6.88% |
| Conditional Value-at-Risk (5%) | 5.28% | 10.16% |
| Upside Capture Ratio (%) | 39.35 | 100.00 |
| Downside Capture Ratio (%) | 35.89 | 100.00 |
| Safe Withdrawal Rate | 8.04% | 7.99% |
| Perpetual Withdrawal Rate | 3.00% | 6.59% |
| Positive Periods | 127 out of 206 (61.65%) | 136 out of 206 (66.02%) |
| Gain/Loss Ratio | 1.08 | 0.83 |
| * US stock market is used as the benchmark for calculations. Value-at-risk metrics are monthly values. | ||
Conclusion
Corporate bonds are a potential component of a well-balanced portfolio.
They provide diversification, income, and stability with cost efficiency (when in the form of an ETF).
If our goal is to diversify broadly, they can be a part of the puzzle, giving us investment-grade, mid-duration corporate bond exposure.
But, like any exposure, it’s important to evaluate how corporate bonds align with individual financial goals and risk tolerance.