Value-at-Risk (VaR)


How much money could I lose in a day (week, month, quarter, year) on a really bad day?
What would the worst 5% or the worst 1% of days look like?
You’re asking the same question that Value-at-Risk (VaR) tries to answer.
It’s one of the most widely used risk measures in finance because it gives a single, clear number to summarize potential losses.
Fundamentally, VaR answers this: “With X% confidence, how much could we lose in the next day, week, or month?” (Of course, you can customize the timeframe to whatever you’d like.)
For example, if a portfolio has a one-day 95% VaR of $5 million, it means that on 95% of trading days, losses won’t exceed $5 million. But on the other 5% of days, things could get worse.
It’s a simple idea, but it carries a lot of weight in risk management. We go into this more below.
Key Takeaways – Value-at-Risk (VaR)
- VaR is finance’s way of answering a simple but important question: “How much could I lose on a really bad day?”
- It gives one number that shows potential losses at a chosen confidence level. As such, it makes complex risk easier to grasp.
- It matters because it can provide common language for decision-makers across a range of roles.
- Banks use it to size capital buffers, regulators to enforce discipline, and traders/investors to see their downside.
- There are three main approaches (Historical Simulation, Parametric (variance-covariance), and Monte Carlo) each with trade-offs.
- But VaR has blind spots.
- It won’t tell you how bad losses get once the threshold is crossed. That’s why professionals pair it with Expected Shortfall and stress tests for a fuller picture.
- It’s analogous to a weather forecast. It might tell you there’s a 5% chance of storms tomorrow, but not how much rain if it does occur.
- As mentioned, you need other metrics like CVaR (Expected Shortfall) to tell you the difference between a light rain or downpour or other elements if it does happen.
Why VaR Matters
VaR gained popularity because it bridges stakeholders: notably, risk managers and decision-makers.
A CEO generally doesn’t want a thick statistical report. Many CEOs of investment firms and trading shops aren’t necessarily technical, or have simply been out of it for a long time. They’re more about business-building and broader firm-level strategy rather than in the weeds of the day to day.
Accordingly, they want a number, a line in the sand. VaR provides that.
Banks use it to decide how much capital they need to hold against risky positions. Regulators use it to keep financial institutions honest. Investors and traders use it to gauge the downside of a portfolio.
It’s not perfect (and we’ll get to that), but it’s useful because it translates complex risk into something tangible.
Trading is probabilistic. Outcomes are not known and can’t be known.
And even though professionals conceptually understand that outcomes follow a distribution of outcomes – a range of possibilities with different probabilities associated with them – even the distributions themselves cannot be known.
VaR helps give you something concrete.
Ways to Calculate VaR
There’s more than one way to get to a VaR number, and each method has its own pros and cons.
1. Historical Simulation
This is the “look back and see what would’ve happened” approach.
It takes past returns, reshuffles them, and shows you how your portfolio would have performed.
It’s intuitive and doesn’t assume fancy math, but it assumes the future will look like the past, which won’t always the case.
2. Variance-Covariance (Parametric)
This method assumes returns follow a certain type of curve. Typically, a normal distribution (“bell curve”).
When people say that stocks have “15% volatility” they’re expressing volatility as a standard deviation following the parametric approach.
It uses the mean and standard deviation of returns to estimate losses. The upside is speed and simplicity.
The downside: markets often behave in ways that don’t fit neat, normal distributions.
As we’ve looked at in other articles, financial return distributions are often fat-tailed.
3. Monte Carlo Simulation
This is the high-tech version. It generates thousands of random market scenarios based on assumed distributions and correlations.
It’s flexible. You’re not constrained by historical data or out-of-the-box mathematical models.
But also computationally heavy and sensitive to the assumptions you feed it.
Expected Shortfall (Conditional VaR)
Expected Shortfall (also called Conditional VaR or CVaR) takes the idea of Value-at-Risk one step further.
Instead of just asking, “How bad can it get at the 95% level?”, it asks, “Okay, if we do cross that line, what’s the average damage?”
Why It Matters
Think of VaR as saying, “On most days, losses won’t exceed $5 million.”
That’s useful, but it’s like hearing there’s a 5% chance of rain without knowing if it’ll drizzle or pour, whether there’s a thunderstorm, etc.
Expected Shortfall tells you the average size of the storm when it hits.
This makes it especially valuable for capturing tail risk; the rare, extreme losses that can sink a portfolio.
After the 2008 financial crisis, regulators leaned heavily on Expected Shortfall because it paints a clearer picture of worst-case scenarios.
A More Honest Risk Measure
Expected Shortfall also is just one metric that’s imperfect.
But it does force us to look beyond the estimated basics of a situation and acknowledge that losses can spiral far past a single cutoff point.
It’s not just about where the cliff is; it’s about how far you fall once you go over it.
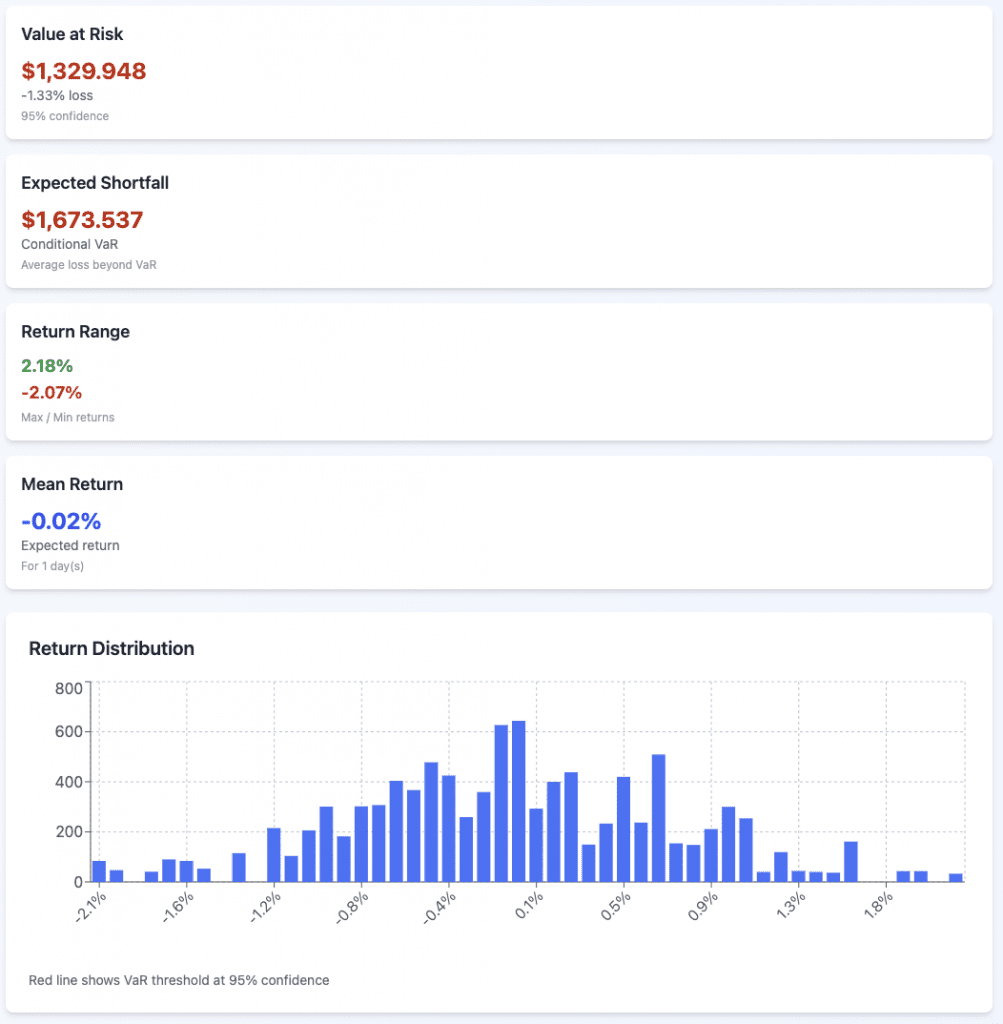
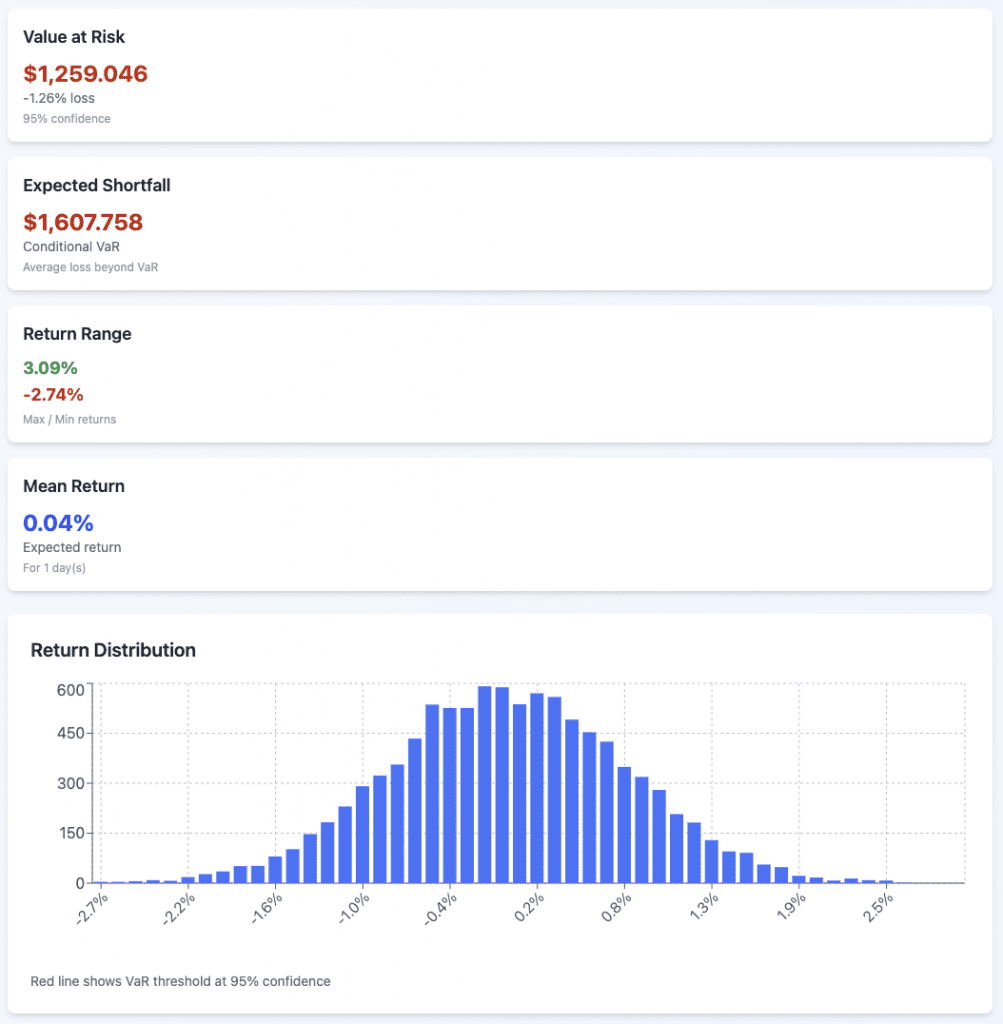
Example VaR Calculations
Let’s do some example calculations for each to show how it changes based on each of the approaches we covered and at different confidence intervals.
We’ll do both VaR and CVaR at 95% and 99%.
We’ll model this off the S&P 500, using 7% expected annual returns and 15% volatility.
The portfolio value is $100,000 and our timeframe is one day.
We’ll illustrate with images.
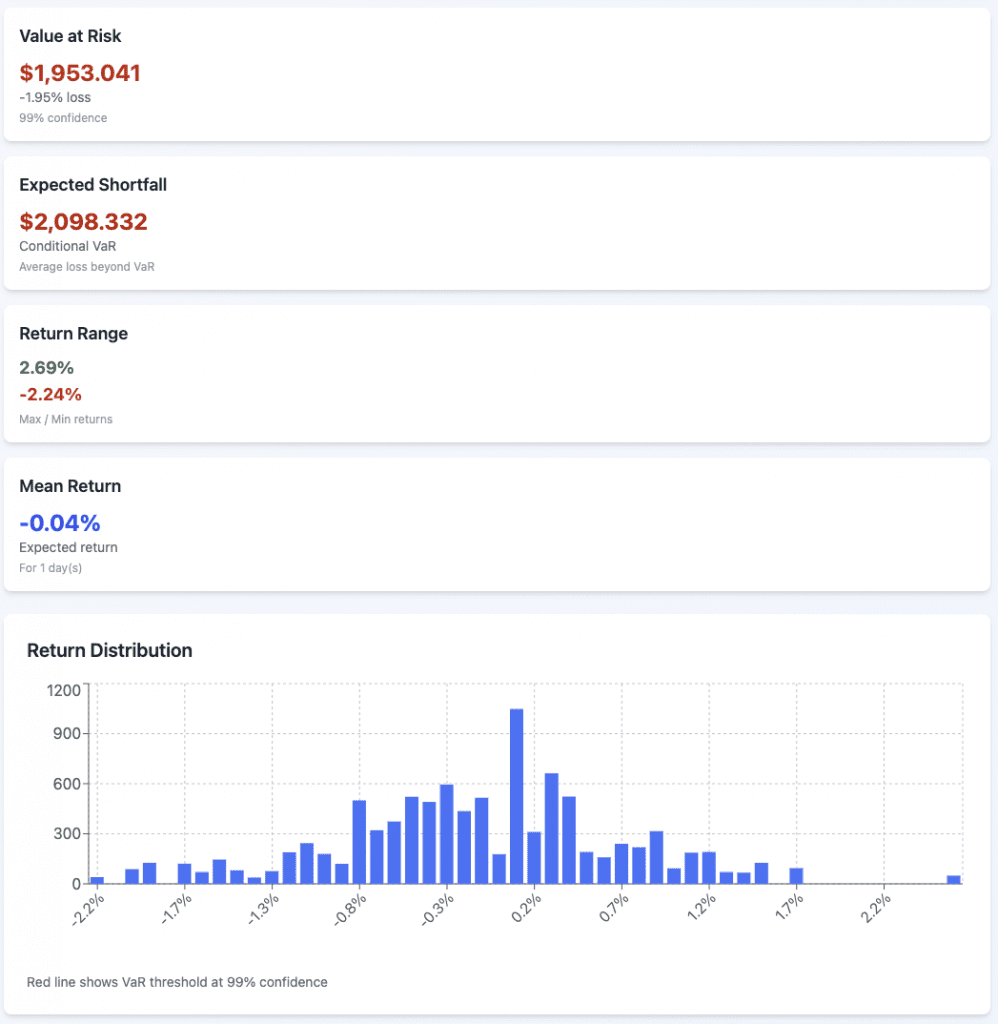
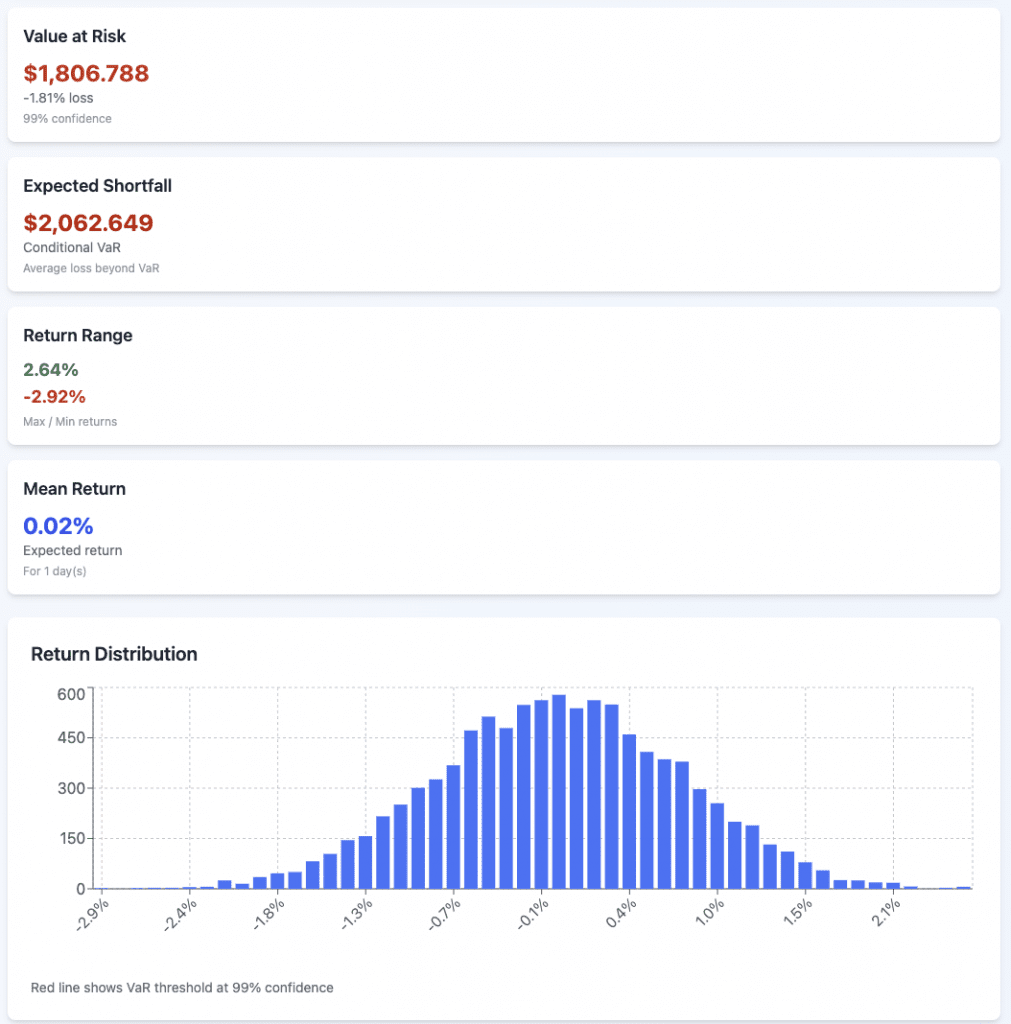
Historical
95%
99%
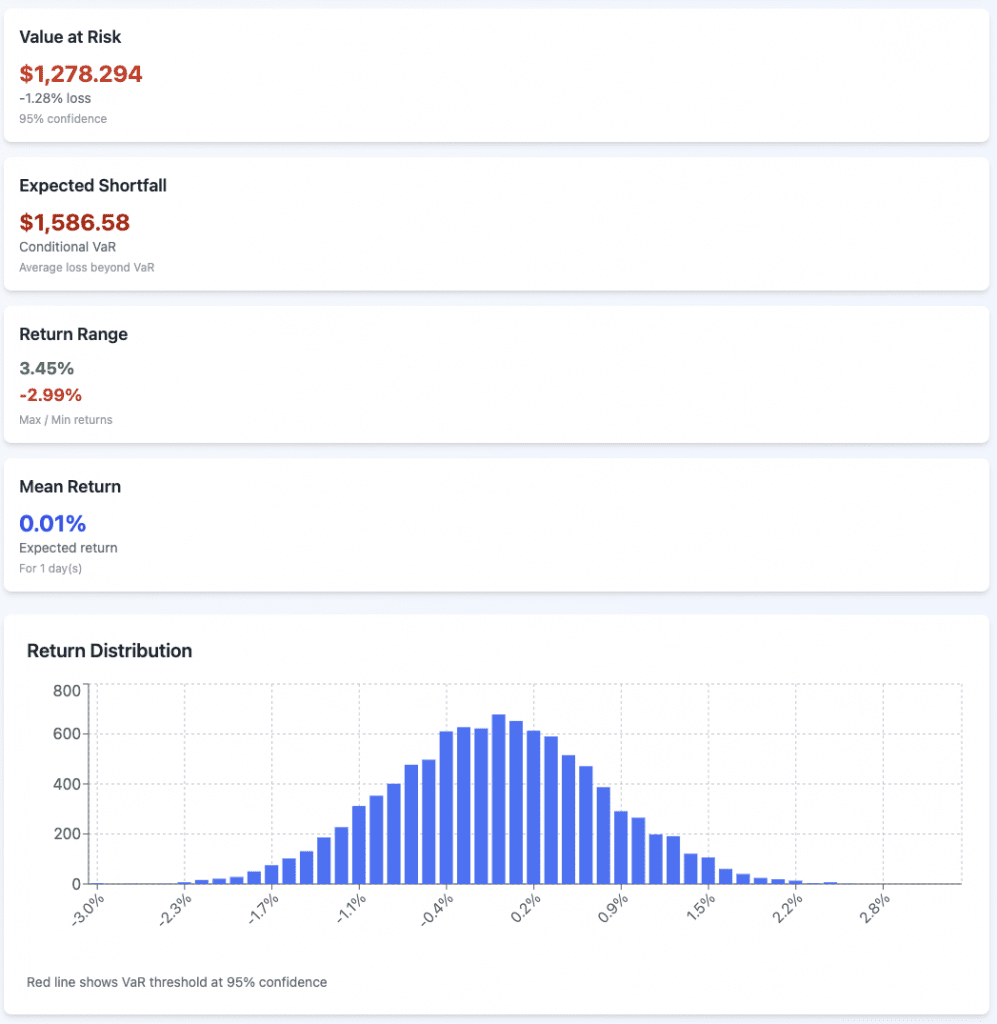
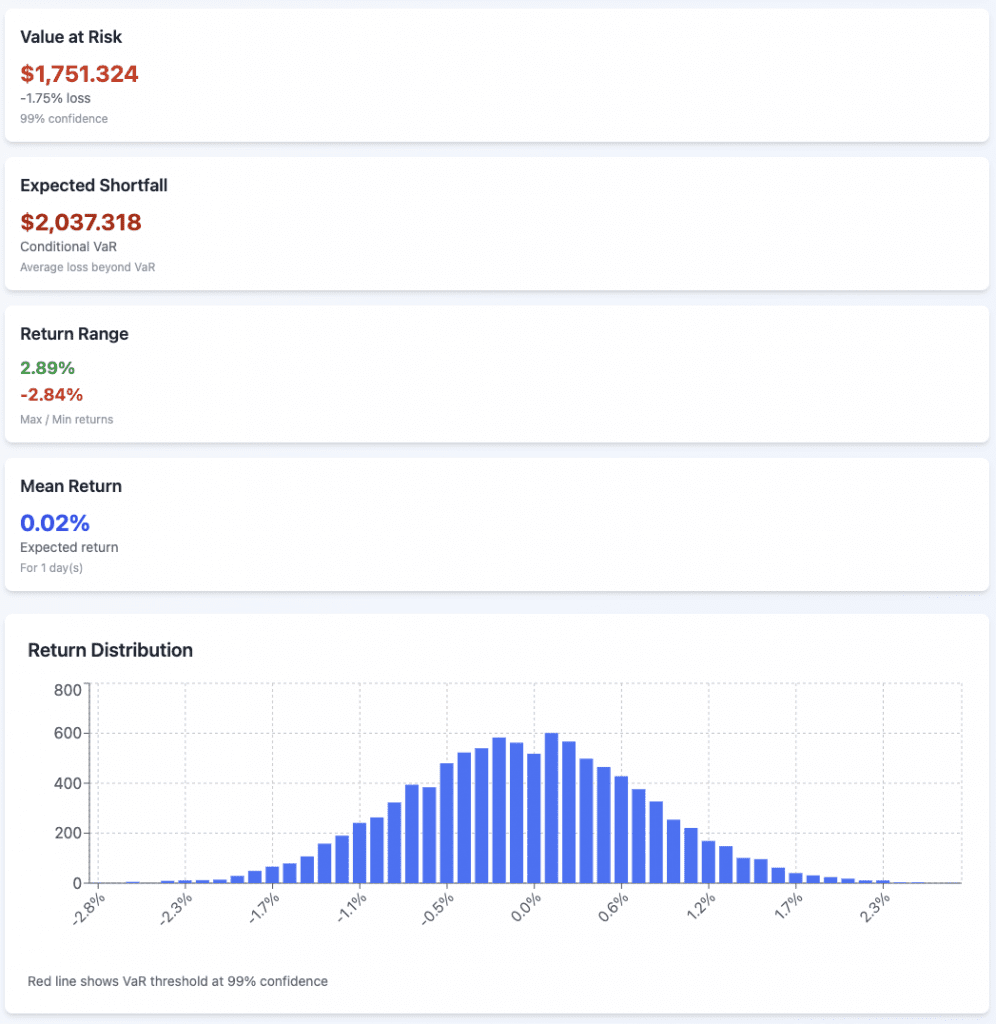
Parametric
95%
99%
Monte Carlo
95%
99%
The Limitations of VaR
For all its usefulness, VaR has blind spots.
Tail risk
VaR tells you the loss at a given confidence level, but not how bad things can get beyond that threshold.
In our earlier example, yes, there’s a 5% chance of losing more than $5 million, but how much more? VaR won’t say.
Assumptions
Historical patterns, normal distributions, model inputs… all of these can fail when markets break down.
Models are always a simplification of reality.
False sense of security
Because it looks precise, VaR can lull decision-makers into overconfidence. It’s a forecast, not a guarantee.
So, Is VaR Still Useful?
Absolutely; if you use it wisely.
VaR is like an ETA on a traffic app. It gives you an average travel time, but it can’t tell you how bad the traffic jam and ETA will be if there’s an accident or something out of the ordinary.
That’s why most risk managers pair VaR with other measures like Expected Shortfall, stress testing, or scenario analysis.
Like with pilots, they don’t look at one gauge.
At the end of the day, VaR is a model. It’s not perfect, but it’s practical, and that’s why it remains one of the most common languages of risk in finance.
VaR’s Use in Tail Risk Hedging
Discipline
Many trading firms adopt a clear, rules-based policy: hedge the 99% VaR on every trade.
In practice, this means that once the firm calculates the worst 1% loss scenario, it must purchase protection – usually in the form of out-of-the-money (OTM) options – to cap that downside.
Setting this as a baseline requirement, it means that tail risk is never left to chance or gut feel.
Why It Works
This approach enforces discipline in two ways.
First, it acknowledges that markets can always move beyond “normal” expectations, and hedges are there to catch those rare but devastating outcomes.
Second, it creates organizational clarity. Traders know that hedging isn’t optional – it’s simply standard operating procedure.
Exceptions, if allowed, require explicit approval from risk committees or senior management (e.g., the hedge is too costly or the position is too small).
That extra hurdle discourages reckless behavior.
Practical Benefits
Capping extreme risk through OTM options protects the firm from catastrophic losses while allowing it to participate in normal market dynamics.
It also improves capital efficiency.
Regulators and counterparties are more comfortable with firms that have systematic hedging frameworks. It may even translate into better funding and trading terms.
A Culture of Preparedness
Beyond the math, such policies shape culture.
They encourage traders to think in probabilities rather than certainties, and to respect the tails of the distribution where financial careers and firms often break.
A VaR hedge policy doesn’t fully eliminate risk, but it builds resilience so the firm can survive the rare occasions when markets turn against it.
Other Approaches
There are, of course, other ways of doing things.
For example, some hedge funds have a policy where their drawdowns cannot exceed 20%.
In such a scenario, they assume all their positions perfectly correlate to 1 and set up hedges so that they hedge the appropriate amount of gross exposure for each trade.