Rubber Band Trading


Rubber Band Trading is a popular mean reversion trading strategy that relies on the use of Bollinger Bands and other mean reversion indicators.
This approach is based on the idea that financial markets are inherently cyclical, and that asset prices tend to revert to their mean values over time.
By identifying periods when prices have deviated significantly from their average values, traders can capitalize on the natural tendency for prices to “snap back” to their historical norms.
Key Takeaways – Rubber Band Trading
- Rubber Band Trading is a popular mean reversion strategy that relies on Bollinger Bands and other mean reversion indicators to capitalize on the natural tendency of asset prices to revert to their historical norms.
- While Rubber Band Trading can be effective in identifying potential reversals, its reliance solely on price and volatility indicators may leave traders exposed to unexpected price movements that these indicators won’t capture.
- To mitigate this risk, traders should deepen their understanding of market dynamics by understanding the diverse buying and selling drivers behind the markets their involved in beyond just translations of price and volatility.
Rubber Band Trading as a Mean Reversion Strategy
Rubber Band Trading operates on the principle of mean reversion, which posits that prices eventually return to their average values after periods of abnormal deviation.
The strategy involves monitoring price movements in relation to Bollinger Bands (and potentially other mean-reverting indicators).
Bollinger Bands are statistical bands that measure price volatility and are plotted above and below a moving average.
When prices reach or exceed the outer limits of these bands, traders interpret this as a signal that prices are likely to revert to their mean values.
In addition to Bollinger Bands, Rubber Band Trading can incorporate other mean reversion indicators, such as the Relative Strength Index (RSI), Moving Average Convergence Divergence (MACD), and Stochastics.
These tools can help traders identify potential reversals and provide additional confirmation of signals generated by Bollinger Bands.
By combining these indicators, traders can increase the accuracy and effectiveness of their Rubber Band Trading strategy.
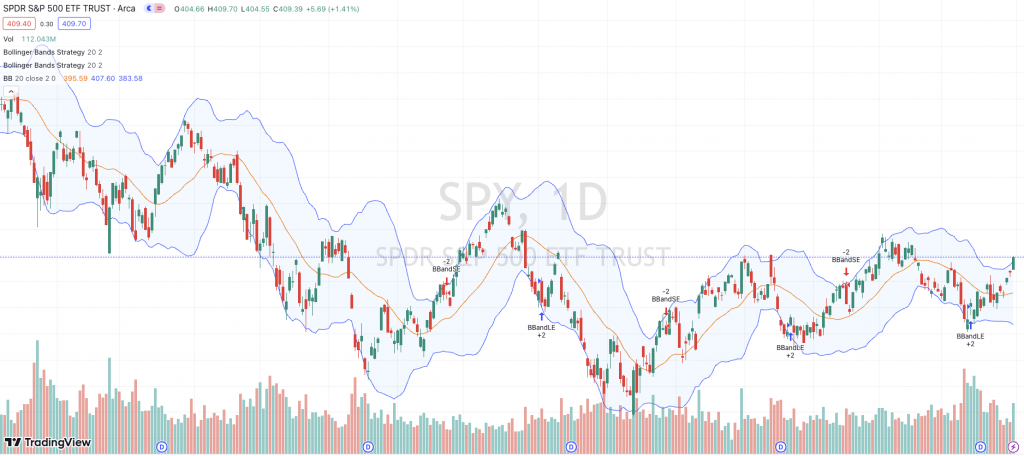
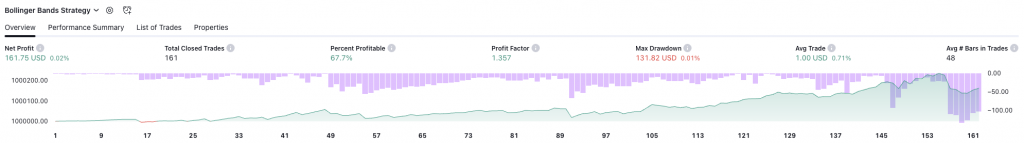
Example of Rubber Band Trading on SPY
Below shows an example of Bollinger Bands trading as it pertains to SPY (S&P 500 ETF).
Rubber Band Trading Drawbacks
Rubber Band Trading has limitations. One of the primary drawbacks of this strategy is its reliance on indicators that focus solely on price and volatility.
Bollinger Bands, for example, are derived from historical price data and measure price fluctuations in relation to a moving average.
So, it doesn’t account for other factors that may influence asset prices, such as economic news, fundamental analysis, or all the information there is to know about the buyers and sellers in the market (who’s buying, who’s selling, how big are they, what are they motivated to do).
Traders who rely exclusively on Rubber Band Trading may therefore find themselves exposed to unexpected price movements that are not captured by their indicators.
To mitigate this risk, it is important for traders to deeply understand the cause-effect drivers of their markets in order to obtain a more comprehensive understanding of the market dynamics at play.
Conclusion
Rubber Band Trading is a type of mean reversion strategy.
By being aware of its limitations and incorporating a diverse range of market data, analysis and insights, traders can maximize the potential of this approach and improve their overall trading performance.